International Journal of Scientific & Engineering Research Volume 2, Issue 9, September-2011 1
ISSN 2229-5518
Wheat disease identification using Classification
Rules
A.Nithya, Dr.V.Sundaram
Abstract -Many techniques have been developed for learning rules and relationships automatically from diverse data sets, to simplify the often tedious and error-prone process of acquiring knowledge from empirical data. Decision tree is one of learning algorithm which posses certain advantages that make it suitable for discovering the classification rule for data mining applications. Normally Decision trees widely used learning method and do not require any prior knowledge of data distribution, works well on noisy data .It has been applied to classify Wheat disease based on the symptoms. This paper intended to discover classification rules for the Indian Wheat diseases using the c4.5 decision trees algorithm. Expert systems have been used in agriculture since the early 1980s. Several systems have been developed in different countries including the USA, Europe, and Egypt for plant-disorder diagnosis, management and other production aspects. This paper explores what Classification rule can do in the agricultural domain.
Index Terms-Decision Trees, Pruning, Datamining, Classification, Expert System, Neural Networks
1.INTRODUCTION
- - - - - - - - - - - - - - - - - - - - - - - - - - - - - - - - - - - - - - - - -
Decision trees have become one of the most powerful and popular approaches in knowledge discovery and data mining, the science and technology of exploring large and complex bodies of data in order to discover useful patterns. The area is of great importance because it enables modeling and knowledge extraction from the abundance of data available. The construction of decision tree classifiers does not require any domain Knowledge or parameter setting, and therefore is appropriate for exploratory Knowledge discovery. The Decision tree can handle high dimensional agricultural data. Their representation of acquired knowledge. The learning and classification steps of decision trees induction are simple and fast. The transfer of experts from consultants and scientists to agriculturists, extends workers and farmers represent a bottleneck for the development of agriculture on the national. The term Knowledge Discovery in Databases or KDD for short, refers to the broad process of finding knowledge in data, and emphasizes the "high-level" application of particular data mining methods.It is of interest to researchers in machine learning, pattern recognition, databases, statistics, artificial intelligence, knowledge acquisition for expert systems, and data visualization. The unifying goal of the KDD process is to extract knowledge from data in the context of large databases. Many machine learning schemes can work with either symbolic or numeric data, or a combination of both, and attempt to discover relationships in the data that have not yet been hypothesized. Once a
A.Nithya is currently pursuing Ph.D in Karpagam
University, India, PH-9659428605.
E-mail: nithy_arumugam@yahoo.com
. Dr.V.Sundaram,Karpagam College of Engineering,India,.
Relationship has been discovered; further statistical analysis can be performed to confirm its significance.
Sometimes, both fields work independently towards the same goal, as in the case of ID3 (Quinlan, 1986), a machine learning scheme, and CART (Breiman et al, 1984), standing for “classification and regression trees,” a statistical scheme. These methods both induce decision trees using essentially the same technique. Machine learning researchers also incorporate statistics into learning schemes directly, as in the case of the Bayesian classification system AUTO CLASS (Cheese man et al, 1988). C4.5 performs top down induction of Decision trees from a set of examples which have ach been given a classification (Quinlan, 1992). Typically, a training set will be specified by the user. The root of the tree specifies an attribute to be selected and tested first, and the subordinate nodes dictate tests on further attributes. The leaves are marked to show the classification of the object they represent. An information-theoretic heuristic is used to determine which attribute should be tested at each node, and the attribute that minimizes the entropy of the decision is chosen. C4.5 is a well-developed piece of software that derives from the earlier ID3 scheme (Quinlan, 1986), which itself evolved through several versions
According to [9], the ID3 algorithm is a decision tree building algorithm which determines classification of objects by testing values of their properties. It builds tree in top down fashion, starting from set of objects and specification of properties. At each node of tree, the properties tested and the result is used to partition data object set. The information theoretic heuristic is used to produce shallower trees by deciding an order in which to select attributes. The first stage in applying the information theoretic heuristic is to calculate the proportions of positive and negative training cases that are currently available at a
IJSER © 2011 http://www.ijser.org
International Journal of Scientific & Engineering Research Volume 2, Issue 9, September-2011 2
ISSN 2229-5518
node. In the case of the root node this is all the cases in the
training set. A value known as the information needed for the node is calculated using the following formula where p is the proportion of positive cases and q is the proportion of negative cases at the node:
Gain (S, A) = Entropy (S) - ∑ ( | Sv | / | S | ) Entropy ( Sv )
ii) Gain Ratiov: € Values (A)
Gain Ratio (S, A) Ξ Gain(S, A) / Split Information (S, A)
c
Split Information (S, A) Ξ - ∑ (|Si|/ |S|) log2 (|Si|/|S|)
-p log2p - q log2q
iii) Gini value:
The basic algorithm of ID3
Examples S, each of which is descried by number of attributes along with the class attribute C, the basic pseudo code for the ID3 algorithm is:
If (all examples in S belong to class C) then make leaf
labeled C
Else select the “most informative” attribute A Partition S according to A’s values (v1... vn)
Recursively construct sub-trees T1, T2... Tn for each subset of S.
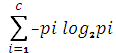
ID3 uses a statistical property, called information gain measure, to select among the candidates attributes at each step while growing the tree. To define the concept of information gain measure, it uses a measure commonly used in information theory, called entropy. The entropy is calculated by
Entropy (S) =
Where S is a set, consisting of s data samples, Pi is the portion of S belonging to the class i. Notice that the entropy is 0 when all members of S belong to the same class and the entropy is 1 when the collection contains an equal number of positive and negative examples. If the collection contains unequal numbers of positive and negative examples, the entropy is between 0 and 1. In all calculations involving entropy, the outcome of all calculations involving entropy, the outcome of (0 log2 0) is defined to be 0. With the Information gain measure, given entropy as a measure of the impurity in a collection of training examples, a measure of effectiveness of an attribute in classifying the training data can be defined. This measure is called information gain and is the expected reduction in entropy caused by partitioning the examples according to this attribute. More precisely, the information gain is Gain(S, A) of an attribute A, relative to a collection of examples S.
i) Information gain:
Gini (D) = 1 - ∑ p2
Where pj is relative frequency of class j in D
Neural networks have emerged as advanced data mining tools in cases where other techniques may not produce satisfactory predictive models. Neural networks were inspired by models of biological neural networks since much of the motivation came from the desire to produce artificial systems capable of sophisticated, perhaps "intelligent", computations similar to those that the human brain routinely performs, and thereby possibly to enhance our understanding of the human brain. Using three input variables-color, appearance and type of diseases were generated for calculating, training and evaluation of artificial neural networks. The artificial neural network was designed with three neurons in the input layer (color, appearance, type of diseases) and one neuron in the output layer The optimum number of neurons in the hidden layer was obtained by using a trial and error method. Generally, networks with more hidden layers, less neurons and fewer width networks, have a better performance compared with networks of less depth and more neurons in one layer, although training in networks of less width is more difficult than for less depth networks. Neural Works Professional
11/PLUS software was used for this research work and analysis. To obtain stable topologies, the training process (Figure 3) was repeated eight times for each topology because the software was considered as a different set of initial random values for the weights and bias values (vectors). For network optimization, an increasing method
IJSER © 2011 http://www.ijser.org
International Journal of Scientific & Engineering Research Volume 2, Issue 9, September-2011 3
ISSN 2229-5518
for selecting the number of neurons and layers was used for
network training. New neurons were added to the network gradually, whenever in one stage network a local minimum was involved. This method has better practical potential for finding the correct size of a network. Advantages of this method are:
a. Network entanglements were increased gradually with increasing neuron numbers,
b. Optimum size of network was often obtained with this arrangement, and Monitoring and evaluation of local minimums were performed during training.
Actual algorithm for a 3-layer network (only one hidden layer):
Initialize the weights in the network (often randomly) Do
feature set which are used to train the NN model; whilst a
testing features sets are used to verify the accuracy of the trained NN model. Before the data can be fed to the ANN model, the proper network design must be set up, including type of the network and method of training. This was followed by the optimal parameter selection phase. However, this phase was carried out simultaneously with the network training phase, in which the network was trained using the feed-forward back propagation network. In the training phase, connection weights were always updated until they reached the defined iteration number or acceptable error. Hence, the capability of ANN model to respond accurately was assured using the Mean Square Error (MSE) criterion to emphasis the model validity between the target and the network output.
For each example e in the training set
O = neural-net-output(network, e) ; forward pass
T = teacher output for e
Calculate error (T - O) at the output units
Compute delta_wh for all weights from hidden
layer to output layer ; backward pass
Compute delta_wi for all weights from input layer to hidden layer ;
backward pass continued
Update the weights in the network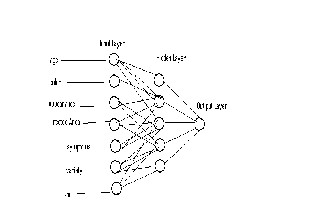
Return the network
Figure 1.Neural Network for Wheat disease classification
In this paper, neural networks are used in the automatic detection of wheat diseases. Neural network is chosen as a classification tool due to its well known technique as a successful classifier for many real applications. The training and validation processes are among the important steps in developing an accurate process model using NNs. The dataset for training and validation processes consists of two parts; the training
25% in Missouri.[60] A wide range of organisms infect wheat, of which the most important are viruses and fungi
The main wheat-disease categories are:
Seed-borne diseases: these include seed-borne scab, seed-borne Stagonospora (previously known as Septoria), common bunt (stinking smut), and loose smut. These are managed with fungicides.
Leaf- and head- blight diseases: Powdery mildew, leaf rust, Septoria tritici leaf blotch, Stagonospora (Septoria) nodorum leaf and glume blotch, and Fusarium head scab.
IJSER © 2011 http://www.ijser.org
International Journal of Scientific & Engineering Research Volume 2, Issue 9, September-2011 4
ISSN 2229-5518
Crown and root rot diseases: Two of the more important of these are 'take-all' and Cephalosporium stripe. Both of these diseases are soil borne.
Viral diseases: Wheat spindle streak mosaic (yellow mosaic) and barley yellow dwarf are the two most common viral diseases. Control can be achieved by using resistant varieties.
Each option resulted in a different decision tree.
The resultant accuracy of each tree when applied to the testing samples also varied. The complete results are provided below:
if appearance=spot and color =red disease =barley yellow dwarf
if appearance=spot and color =yellow green<=30days
Then disease= spindle streak mosaic virus
The decision tree classifier applied on the dataset uses three different splitting criteria namely
(i) Information Gain
(ii) Gain Ratio
(iii) Gini Index
As the above results depict the fact that change in
selection criteria of best attribute while constructing learning tree may change the performance of decision tree classifier. According to above shown results information gain has the highest performance over gain ratio and gini Index splitting criteria. Below is the performance chart of three different splitting criterions drawn against the number of correctly recognized test samples.
The decision tree algorithm provides many benefits of trees over many other classifiers such as neural network. The most important benefits are interpretability. Moreover the c4.5 can effectively create comprehensive tree with greater predictive power and able to get a prediction error about 1.5% on data of test set. The enhancement in classification results over fitting error using pruning techniques and Handling the huge numbers of attribute values.
[1].Gilbert Saporta. Data Mining and Official Statistics, Paper, Chaire de Statistique Appliquée, Conservatoire National des Arts et Métiers.
292 rue Saint Martin, Paris, 15 novembre 2000.
[2].a Sikandar, Haris Vohra, Syed Samad Ahmed Bukhari, Faiz-ul- Haque Zeya’, Decision Tree and Neural Network Classifier Performance Comparison using Canny Cancer Detector a Diagnosis Tool
*3+ Ying Lu, Jiawei Han, “Cancer Classification Using Gene Expression Data”, Information Systems vol. 28 issue 4, Elsevier Science Ltd., Oxford,UK, 2003, pp. 243 – 268.
[4]Patricia L.Dolan, Yang Wu, Linnea K. Ista, Robert L. Metzenberg, Mary Anne Nelson, Gabriel P. Lopez, “Robust and efficient synthetic method for forming DNA microarrays”, PubMed Central, Oxford University Press, USA, 2001.
IJSER © 2011 http://www.ijser.org
International Journal of Scientific & Engineering Research Volume2, Issue 9, September-2011 5
ISSN 2229-5518
• A.Nithya is currently pursuing Ph.D in Karpag am Uni versity, India, PH-9659428605. E-mail: nithy_arumugam@yahoo.com
• . Dr.V.Sundaram,Karpagam Colleg e of Engineering,India,.
IJSER ©2011