International Journal of Scientific & Engineering Research, Volume 6, Issue 3, March-2015 672
ISSN 2229-5518
Web and Text Mining – Sentiment Analysis
Ms. Anjana Agrawal
Abstract— This paper describes the key steps followed in Text Mining, including sentiment analysis. To demonstrate the complete process Input text data was obtained from “Twitter” for one of the leading political organization and the tweets were scored for sentiment analysis. Output generated in terms of “Common Key Words”, “Association between common key words”, “Sentiment Score” was observed and analyzed for a period of approx. 3 weeks. This output was important for the organization considering the fact that this political organization was campaigning for the elections scheduled in near future and based on the “Citizen” sentiments, organization was able to refine their next course of action.
Index Terms— Bias, Entity Extraction, Key words, Tokens
1 Introduction
Social media is a blur of tweets, shares and content. Some of the interesting trend shows that 72% of all internet users are now active on social media and 71% of user’s access social media from a mobile device. Although social media as a platform is quite population in young generation (18-29 year olds have an 89% usage), this is being used by every age group. 30-49 age bracket sits at 72%, 60% of 50 to 60 year olds are active on social media and in 65 plus bracket, 43% are using social media.
This increased usage of social media has resulted in the generation of large quantity of unstructured text and this ocean has key gems which have to be mined appropriately to extract the required information.
Social media analytics is the practice of gathering data from blogs and social media websites and analyzing that data to make business decisions. The most common use of social media analytics is to mine Customer Sentiment in order to support Marketing, Branding and Customer Service activities almost for all industries.
The purpose of Text Mining is to process unstructured (textual) information, extract meaningful numeric indices from the text, and, thus, make the information contained in the text accessible to the various data mining (statistical and machine learning) algorithms. In the most general terms, text mining will "turn text into numbers" (meaningful indices), which can then be used for predictive analysis. Normally in a text analysis, one of the biggest challenges is to deal with unstructured noisy data. In addition most of the social media platforms provide “language” support.
Information can be extracted to derive summaries for the words, association of the brand with specific keywords or to compute summaries for the documents based on the words contained in them. E.g. “Black Money” and “Real Estate Industry” are the popular words being discussed on social media and their relationship in terms of positive sentiment or negative sentiment can be extracted via text mining.
Natural Language Processing has enriched the text mining industry by expanding the information extraction in terms of
“Entities” i.e. “People”, “Organization” and “Location” thus providing context to the extracted information points.
Text mining could analyze documents and determine similarities between them or how they are related to other variables of interest e.g. In a large recruitment and search agency setup , it is a common requirement to find the similarity between open positions which is just not limited to couple of key word. This specific feature of text mining can not only help to identify the similarity but can also provide the common context between the documents.
In today’s challenging environment, for any business to survive, it is very important to understand what customer thinks about their brand and service proposition. Considering the fact that social media is being used as a popular platform to share views and information gets transmitted or shared in “no-time”, organization needs to have a machinery to continuously churn the media data and understand the “Sentiments” and analyze these sentiment trends based on the demographic details like location, gender, occupation.
IJSER © 2015 http://www.ijser.org
International Journal of Scientific & Engineering Research, Volume 6, Issue 3, March-2015 673
ISSN 2229-5518
Hence, in a nutshell following key aspects are targeted from text mining and sentiment analysis perspective whenever an analytical model is being developed for a political organization:
Capturing of citizen data from social media to understand attitudes, opinions, and trends and manage online reputation.

Track brand growth, Identify and evaluate when and where social profiles are growing which serves as a guide to decide the future strategy.
Measure and segment sentiment matrix, Get to know audience by demography like location, organization, age, sex etc.
Analyze and visualize Social demographics, Discover real time spikes in brand sentiments to see whether conversations are positive, negative or neutral.
Identify the primary influencers within specific social network channels, To identify the key influencers and top trend setter (both positive and negative).
What content resonates and identify the association between key words.
Content matching to identify if an individual is re-tweeting the same content.
Automatic Categorization and Classification of the text/content based on specific key words.
Prediction for a specific demography
2 Scope
Considering that, in India, assembly elections for the country capital were scheduled on the month of February’ 2015, a political party was identified for this project.
This organization is currently using following free ware tools to perform Social Media Sentiment Analysis specifically taking inputs from Face book and Twitter.
• Hoot suite: Social Media Management for any organization. Manages social networks, schedules messages, engages your audiences, and measures ROI right from the dashboard.
• Keyhole – This allows a real-time tracking of a specific hash-tag.
• Tagboard - Uses hash tags to search for and collect public social media within seconds of being posted to networks like Twitter and Face book. This robust tool offers the power to select specific posts to feature on websites, in broadcast TV, and on large displays.
This organization has a team of 200+ volunteers, operating from different locations (both within India and outside India), who are actively tracking these hash tags.
As these are freeware tools there are certain limitations like:
• Comparison of hash tags across multiple days is not available as Face book and Twitter both provides a download of the previous day data at a price.
• Same is true with “impression” comparison as the data of previous days (i.e. archival data) is available at a price.
• Comparison/Analysis is limited to figurative symbols.
• No automatic mechanism to identify the positive/negative trend setters.
• Hence team currently manages this through various excel sheets.
IJSER © 2015 http://www.ijser.org
International Journal of Scientific & Engineering Research, Volume 6, Issue 3, March-2015 674
ISSN 2229-5518
Considering the limitation of the existing tool set and requirement the organization, scope of the project is as follows:
2.1 Live Twitter Analysis using OAuth
Considering the limitation of archived tweet, one of the requirements was to access “live” tweets” through token-based authentication system.
2.2 Key words analysis
Freeware tools as mentioned in the introduction section, uses certain figurative symbols to identify if the sentiment is positive or negative.
Requirement was to compare the trending of specific key words which can be subsequently used by the team for appropriate action. In addition business also wanted to identify association between key words which can be interpreted as per the business requirement to define next steps.
2.3 Entity Extraction
Freeware tools have a capability to provide the ranking of top profiles based on the trending of various hash-tags on a real time basis.
Ranking/Identification was required in terms of “Entities” as “People”, “Organization” and “Location” using Natural
Language Processing (NLP) algorithm.
2.4 Sentiment Analysis and Prediction
Requirement was to predict the sentiments on an on-going basis and identify the following on a daily basis
• Top positive and negative twitters on a daily basis.
• Individuals who were trending positive and have started tweeting negatively
Diagrammatic representation of the process followed for the above mentioned scope is provided in fig.1. of this document.
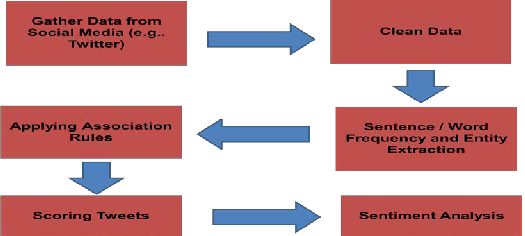
Fig. 1. Process flow for Sentiment Analysis
IJSER © 2015 http://www.ijser.org
International Journal of Scientific & Engineering Research, Volume 6, Issue 3, March-2015 675
ISSN 2229-5518
3 Data in Consideration
For Development
88 K tweets from 19th Jan ‘15 to 22nd Jan’15
For Model Validation
In- Sample
38 K tweets from 19th Jan,15 to 22nd Jan’15
Out-of-Sample
100 K tweets from 24th Jan,15 to 28th Jan’15
For Model Execution
200 K tweets from 29th Jan’15 till 7th Feb’15
29 K tweets for 10th Feb’15 (afternoon only as this was the result day and morning tweets were too dynamic to
be considered for any analysis)
4 Data Cleansing and Tokenization
RapidMiner Studio was used to develop the model. Fig.2. has details of the operator being used for data cleaning along with the model flow.
Tokenize operator splits the text of a document into a sequence of tokens. All non-letter character is used for this model. This will result in tokens consisting of one single word, what's the most appropriate option before finally building the word vector. Transform Cases operator transforms all characters in a document to either lower case or upper case, respectively. “Lower Case” transformation was used in our model. Filter Stopwords (English operator filters English stopwords from a document by removing every token which equals a stopword from the built-in stopword list. Filter Token (by length) operator filters tokens based on their length (i.e. the number of characters they contain). Minimum character =3 and Maximum character = 999 for the model. Stem (WordNet) – Stem (porter) operator stems English words using the Porter stemming algorithm applying an iterative, rule-based replacement of word suffixes intending to reduce the length of the words until a minimum length is reached. Stem Wordnet uses Wordnet dictionary to define the stem rule. OpenWordNetDictionary operator refers to a Wordnet dictionary which is stored in a specified directory while defining the wordlist.
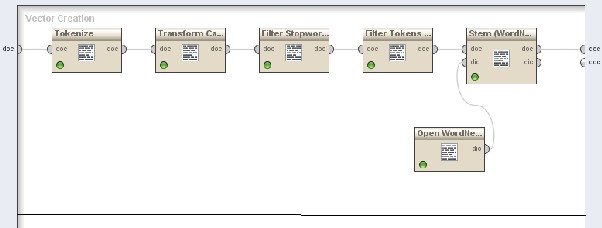
Fig. 2. Model for Data Cleansing
Fig. 3. (a) has the list of key words which were frequently being on the day when result was declared and Fig. 3 (b) has the list of key words which were frequently used before the Election Day.
Note – Size of the oval symbolically represents the count of words in the tweet
IJSER © 2015 http://www.ijser.org
International Journal of Scientific & Engineering Research, Volume 6, Issue 3, March-2015 676
ISSN 2229-5518
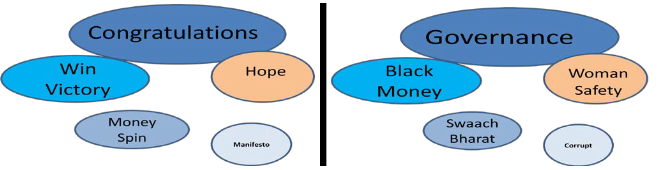
Fig. 3 (a). Key words – On the result day Fig. 3 (b). Key words – Before the election
Fig. 4 has details of some alarming key words
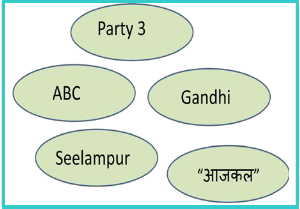
• “Party 3” is another political party which was contesting the election but was not predicted to be a strong party and hence concern was why citizens are tweeting about this party.
• “ABC” is the name of a political leader who has
changed the party and hence concern was that if this movement has been taken negatively.
• “Seelampur” is name of one of the location and was
not identified as a “Key location” from any aspect. Hence the concern was that why this location is being discussed.
Fig. 4. Alarming Key words
5 Entity Extraction
Natural language processing (NLP) technique was used to extract entities i.e. People, Location and Organization. NLP is used to detect in human language the kinds of things that humans detect automatically.
Fig. 5. has details of the entity extracted and the alarming entities have been highlighted with a figurative symbol. E.g. Why people are tweeting “Obama” on the political organization hashtags, Why citizens are talking about “China” in Delhi election, why “High Court” is being discussed during election days etc.
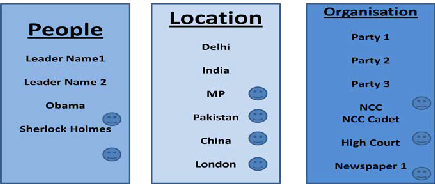
Fig. 5. Entity Extraction using NLP algorithm
IJSER © 2015 http://www.ijser.org
International Journal of Scientific & Engineering Research, Volume 6, Issue 3, March-2015 677
ISSN 2229-5518
6 Association Rules
Fig. 6. is a main process created in RapidMiner Studio to identify association between key words.
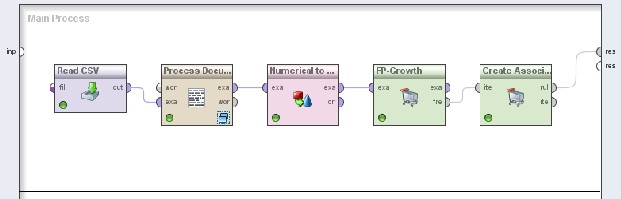
Fig. 6. Main Process for Association Rules
Fig. 7. is a diagrammatic representation of some specific key words with confidence more than 66%.
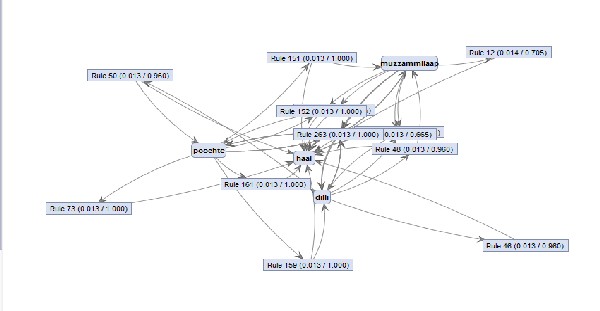
Fig. 7. Output of Association Rules
7 Tweets Scoring
“Extract Sentiment” operator is used to score the tweets. One of the important aspects of tweets scoring is to clean the data set using the process flow detailed out in Section 4 of this document.
Fig. 8. has a sample out of the scored tweets. As it is observed in the output, based on the type of key words being used, tweets have a different score. Tweet which has the word “implementation” has the higher weightage as the same is expected once the contesting party comes in power.
IJSER © 2015 http://www.ijser.org
International Journal of Scientific & Engineering Research, Volume 6, Issue 3, March-2015 678
ISSN 2229-5518
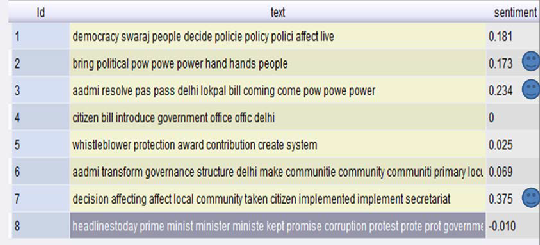
Fig. 8. Scoring of Tweets
8 Sentiment Analysis
Model was trained using various algorithms like the k-Nearest Neighbor algorithm (KNN) with different values of K, Support Vector Machine (SVM), and Naïve Bayes with and without Laplace correction.
Fig. 9. has a comparative details in reference to the confusion matrix produced from all the above mentioned algorithms and the Naïve Bayes (without Laplace) was used for the execution subsequently.

Fig. 9. Confusion Table using different algorithms
IJSER © 2015 http://www.ijser.org
International Journal of Scientific & Engineering Research, Volume 6, Issue 3, March-2015 679
ISSN 2229-5518
9 Model Refinement
On the request of the customer, “Bias” was introduced in the model to understand the trend for the following aspect:
Key words being used by the region which is being considered as the “Pro” and “Anti” for the party.
What is the sentiment score if the “Bias” introduced for the positive trending region is removed.
Frequency of the negative trending region turning into positive in terms of count of people who are now tweeting
positively and the key words being used by them.
What are the demographic factors which influence what is being tweeted and what should be considered as a base
when governance model would be developed in future.
9.1 Model design
Test sample was created with the following variables:
• Dependent Variable – Sentiment score was calculated as per the steps defined in Section 6 of this document and this score was considered as the “Y” variable for this model.
• Independent Variables- Based on the twitter profile, following variables were created
o Region - Entire Delhi is divided into “seven” regions as per the “Lok Sabah” seat distribution. “Region” was
defined as a categorical variable which can have “seven” values i.e. “Region 1 to Region 7”.
o Vote Percentage – Based on the post election data available for 2013, vote percentage was calculated i.e. total
number of voters divided by the votes received by the party in consideration for each region. Hence this variable can also take “seven values” aligned with the “Region”.
o Region Weightage – Rank was defined for seven regions and region is given a weightage based on the fact if a
region was qualified as “Pro” or “Anti” by the party. E.g. if “Region 1” is considered as “Pro” , then the weightage for that specific region would be lowest, whereas the region which is being considered as the most “Anti” will have the highest weightage.
Note – We could have considered the “Vote Percentage” to calculate the “Region Weightage”, however an additional column was created to validate if the trend has changed from 2013 to 2015 because there has been some incidences because of which party brand has gone down.
Sample sheet with the formula related to “Independent Variables” was shared with the concerned party with the regression equation. Output obtained was expected to be analysed in terms of the following aspects:
“Key words” being used by the “Pro” region which have a higher sentiment score.
“Key words” being used by the “Anti” regions.
What are the “Key words” being used by the “Anti” regions to effectively contributes towards “positive” trends?
10 Reality Check - What went wrong in “Exit Poll”

Although the model developed by us in this project and output published by other organizations who were involved in predicting the result for Delhi election had a clear indication for a specific party, however the results in terms of vote share and distribution of seat was nowhere close to the prediction. A closer review of exit poll data since 2009 showed that only 3 out of the 72 exit polls since 2009 got the leading party wrong.
However, the record on seat forecast has been patchy, with only 42% of exit poll seat forecasts coming close to the final tally. The exit polls in Delhi predicted the victory for the party in consideration but still they were way off the mark in the Delhi assembly election. To their credit, exit polls did show that party was going to return to power in Delhi. But, they went wrong in the numbers and margin.
Half-a-dozen exit polls on the Election Day said the party was likely to bag between 31 and 54 seats in the 70-member assembly. They would push back the Party 2 to the second spot and wipe out the Party 3. The party in consideration
IJSER © 2015 http://www.ijser.org
International Journal of Scientific & Engineering Research, Volume 6, Issue 3, March-2015 680
ISSN 2229-5518
romped home with about 67 seats, way more than what the exit polls predicted. The exit polls said the Party 2 could bag
17-35 seats. Here too they went wrong, with the Party 2 relegated to a second spot with a dismal show of 3 seats. Here is
actual data from exit polls:
| Agency | Party in consideration | Party 2 | Party 3 | |
| 1 | 48 | 22 | 0 | |
| 2 | 43 | 26 | 1 | |
| 3 | 31-39 | 27-35 | 2-4 | |
| 4 | 38-46 | 19-27 | 3-5 | |
| 5 | 38 | 29 | 2 | |
| 6 | 53 | 17 | 0 | |
| 7 | 31 | 35 | 4 | |
| 8 | 39-43 | 25-29 | 1-3 | |
Hence this section has been introduced to consolidate some post election facts which could be utilized to refine the model for future use.
Following are the possible reasons for a wrong prediction by all exit polls:
Model must have been developed using the historic data (specifically of earlier polls in Delhi) and party has created a history by winning 96% seats which has never happened earlier, hence no historic data to support this reality.
Assumption is that analyst must have “extrapolated” the model output to account for “Party 3” vote share as it was expected that this share will divide between party in consideration and Party 2 account. However the movement had happened only to “party in consideration” vote share, which probably was not expected.
Party campaign was mostly driven by “Nukaad and Mohalla Sabha” and data collected during these meetings is not
something which is publically available. Hence organizations doing the exit poll analysis won’t have been able to
get this data as party have a huge team of volunteers wherein data/information access is limited within the internal team.
In one of the exit poll it was published that “Central Government” employees were not very happy with the policies which were implemented by Party 2 and they were able to predict the score of approx 50 seats for party. However not sure if the analyst team accounted for the fact that party campaign was positive and they were talking about the “Delhi” and not “Nation” in their campaign (probably some weightage could have been introduced to consider this factor.
There was a remarkable change in the “positive wave” when Party 2 was not able to introduce a leader who has a
“Brand”. Possibly model was not able to account for this change in “Brand” value
One of the key data points which were required for prediction was the data originated at “Nukaad and Mohalla Sabha”. It is an expensive exercise both in terms of data collection from multiple corners (at least 2-3 key locations covered by each seat i.e. total of 140-210 location data for 70 seats) and thereafter consolidation/cleaning/merging with the available historical data.
IJSER © 2015 http://www.ijser.org