International Journal of Scientific & Engineering Research, Volume 6, Issue 5, May-2015 29
ISSN 2229-5518
Water absorption characteristics and modelling of unripe plantain chips Ajala, A.S.,1 Ajala, F.A2
1Department of Food Science and Engineering, Ladoke Akintola University of Technology, P.M.B. 4000, Ogbomoso, Nigeria
2Department of Computer Science and Engineering, Ladoke Akintola University of Technology, P.M.B. 4000, Ogbomoso, Nigeria
*Corresponding author e-mail: ajlad2000@ yah oo.com; faajala@lautech.edu.ng
Abtract: In this study, water absorption characteristics of dried unripe plantain chips were investigated by soaking in distill water at 20, 30 and 40oC. The data generated were fitted into three models namely Peleg, Weibull and exponential. The statistical criteria used in evaluation of the models were coefficient of determination (R2), reduced chi square (χ2), mean bias error (MBE) and root mean square error (RMSE). The result shows that temperature did not affect water absorption properties initially, but it did affect it as re- hydration progressed. The result of R2 shows that Weibull model has the highest value of 0.979 and exponential model has lowest value of 0.653. Therefore, Weibull model was adjudged to have successfully fitted water absorption of unripe plantain chips.
Key word: Modeling, moisture content, temperature, water absorption, plantain chips, exponential, Weibull and Peleg
Nomenclature
α Drying constant in the model β Drying constant in the model k Drying constant in the model k1 Drying constant in the model k2 Drying constant in the model
M0 initial moisture content of the sample (g water/g solid)
Mt instantaneous moisture content of the sample (g water/g solid)
Ms saturation moisture content of the sample (g water/g solid) MBE mean bias error
MR moisture ratio
MRexp experimental moisture ratio
MRpre predicted moisture ratio
N number of observation
RMSE root mean square error
R2 coefficient of determination t re-hydration time (mins)
Wd weight of dehydrated plantain chips (g) Wr weight of re-hydrated plantain chips (g) χ2 reduced chi square
z number of constant in the models
—————————— ——————————
1. INTRODUCTION
Plantains are rich source of carbohydrate and calories to many people worldwide. About 12million metric
tons are produced in Africa annually [10]. Plantain production in Africa is estimated at more than 50% of worldwide production [11]. The major producing countries with an annual output exceeding a million tonnes include Nigeria, Ghana, Cote d’Ivoire and Cameroon [7]. Nigeria is one of the largest plantain
IJSER © 2015 http://www.ijser.org
International Journal of Scientific & Engineering Research, Volume 6, Issue 5, May-2015 30
ISSN 2229-5518
producing countries in the world [12]. Despite its prominence, Nigeria does not feature among plantain exporting nations because it produces more for local consumption than for export [5]. Frison and Sharrock, [13] observed that banana and plantain represent more than 25 percent of the food energy requirement of Africa. It has a very high nutritional value in source of dietary carbohydrates, vitamins and minerals. Plantains are extremely rich in vitamin A [15].
Plantain flour is derived from mature but unripe plantain fruits by carefully peeling off its greenish skin. The fruit is then sliced into flat shapes (chips) and spread under the sun to dry. It may also be dried in the ovens or mechanical dryers. After the chips have been dried to safe moisture content of about 13%, it will be pulverized into flour. The flour can be reconstituted in boiling water to form a gelatised paste called
‘amala’ (in Yoruba and foufou in Cameroon) which can be eaten with different soups or sauces. The flour is also used for several other traditional dishes ranging from ‘akara’, ukpo ogede’ and soups [23]. Because of the health benefits of plantain flour, the popularity of the food has increased tremendously in Nigeria recently. The diabetic patients are encouraged to eat “amala” from plantain flour due to its low sugar content. It is also gradually finding applications in weaning food formulation and composite flour preparations [21], [24], [19], [20].
The shelf life of unripe plantain chips is grossly affected by many factors and is a major problem limiting the production of plantain flour in Nigeria due to unavailability of established storage conditions that can guarantee longer shelf life [37], [22]. Conventionally, this unripe plantain chips is sold in the market in baskets and loose sacks so that buyers can see the product. As a result of this, the product is exposed to insect infestation and becomes moldy over time due to its hygroscopic nature. However, as this product is becoming popular due to its health benefit, there is a need to design effective storage system that would elongate its shelf life. To do this there is need to be informed about the water absorption properties of this product so as to guarantee an effect storage system. Hence modeling of the water absorption pattern of the chips is necessary. This serves as the objective of the study.
There have been literature on modeling of food product; for instant [6] studied modeling of water absorption of chickpeas (Cicer arietinum L.) using Peleg’s equation. Afolabi et al. [2] studied modeling the water absorption characteristics of different maize types during soaking using Peleg equation. Sibian et al. [31] studied Absorption behaviour of pearl millet soaking using Peleg model but literature on modeling of plantain chips is scarce hence there is need to examine this.
2. MATERIALS AND METHODS
(a) Water absorption kinetics of dehydrated plantain chips experiments
Dried plantain chips with initial moisture content of 13.1% (db) and average size of 3cm x 0.4cm x 0.15cm
were obtained from the Food Science and Engineering Departmental Food Processing laboratory, Ladoke Akintola University of Technology, Ogbomoso Nigeria. The samples were soaked in distill water at temperature of 20, 30 and 40oC in a thermostatically controlled water bath. For every 1 g of plantain chip,
200ml of distill water in the beaker was used, that is (1:20) as recommended by [6]. Plantain samples were
periodically taken from the water and placed on absorbent paper to remove surface moisture from the chips and weighed to determine weight gain. This was repeated until samples reached saturation moisture content. Values of triplicates for each experiment were measure and the average results were used in modeling process. The moisture ratio (MR) is computed in equation 1 as follows:

MR = Wr 1
Wd
(b) Mathematical model
Three well known models namely Peleg, Weibull and exponential were used for re-hydration process. The
experimental data were fitted into these three different models as presented in Table 1. These mathematical models shows the correlation between moisture ratio and soaking time with various coefficients attached to each model
IJSER © 2015 http://www.ijser.org
International Journal of Scientific & Engineering Research, Volume 6, Issue 5, May-2015 31
ISSN 2229-5518
Table 1: Mathematical drying models


Models Equation References
Peleg
M t − M 0

= t
k1 + k2 t
[6]
Weibull
Exponential

MR = exp(−( t )α
β
MR = exp(−kt)
[16] [16]

(c) Statistical Analysis
Statistical analyses were performed on the experimental and simulated data to determine the discrepancies
between the observed and simulated values. The constant of each model was determined using a non-linear regression analysis performed using programming protocol of Statistical Package for Social Scientist (SPSS 15.0 versions) software. The statistical criteria used to evaluate the efficacy of the models were coefficient of determination (R2), reduced chi square (χ2), mean bias error (MBE) and root mean square error (RMSE). Goodness of fit is said to have occurred in a model if R2 value is high and other criteria such as χ,2 RMSE and MBE values are low [18], [8]. The equation for each statistical criterion is as shown in Equations 2 through 4 below
n
∑ (MR(exp,i ) − MR( pred ,i )
2
)
χ2=
i −1 2
N − z
1 n

MBE= ∑ (MR( pred ,i ) − MR(exp,i ) ) 3
N i =1
1

RMSE =
N
n
∑
i =1
(MR( pred ,i )
− MR(exp,i )
1 / 2
2
4
3. RESULTS AND DISCUSSION
(a) Water absorption pattern of the Chips
Figure 1 shows the water absorption properties of the plantain chips over time. The graph shows gradual inclination with a less steep gradient over a period of 36 minutes. Within this period, although at different rehydrating temperatures of 20. 30 and 40oC, the graph had close patterns of rehydration but after 36th minute, the rehydrating patterns were greatly affected by temperature. At first, temperature did not played a significant role in water absorption into molecular cell of the samples; so, water absorption took place through the capillary cells freely without the influence of temperature but when the samples has taken relatively sufficient moisture, the rate of water absorption was not as fast as initially. Therefore, moisture at elevated temperature had higher energy to penetrate the granular cells of the samples than at lower temperature. This phenomenon has been earlier reported by [6], [3], “unpublished” [4].
IJSER © 2015 http://www.ijser.org
International Journal of Scientific & Engineering Research, Volume 6, Issue 5, May-2015 32
ISSN 2229-5518
7
6
5
4 MC (20°C) MC (30°C)
3 MC (40°C)
2
1
0
0 10 20 30 40 50 60
Soak ng tim e (m ins )
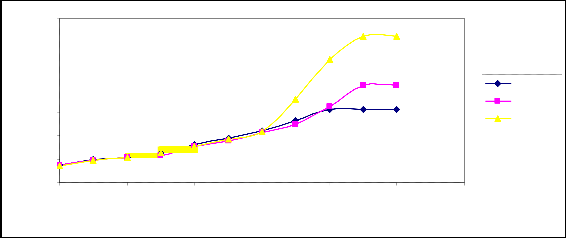
Figure 1: Moisture content against time
Figure 2 shows the rate of change of moisture in the samples. The gradient of change in moisture varies at different temperatures with different gradients; the highest gradient found in samples rehydrated at 40oC followed by 30oC and the least is 20oC. This implies that water absorption per hour was faster at 40oC than
30 and 20oC due to the reason earlier gave above. After the 15th minute, the slope of the curves were less steep and the graphs gradually flattened off which means faster moisture change in the samples only took
about one-third of re-hydrating time. Water absorption after this time was gradual until it reached the
saturation point. Ali et al [6] gave similar report that the phenomenon of water absorption curves are characterized by an initial phase of rapid water pickup followed by an equilibrium phase, during which the re-hydrating samples approaches its full soaking capacity. The same observation was reported by other researchers such as [2], [30], [1], [33], [14], [17].
25
20
15 ΔMC/ΔT(20°C)
ΔMC/ΔT(30°C)
10 ΔMC/ΔT(40°C)
5
0
0 10 20 30 40 50
Time (mins)
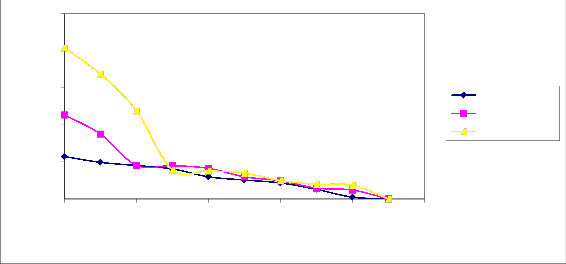
Figure 2: Re-hydration change rate against time
(b) Statistical analysis of the models.
The values of statistical criteria used to evaluate the models are as presented in Table 2. The acceptability of these models is based on the high values of R2 and low values of the other statistical criteria as shown. The lowest value of R2 is 0.653 (exponential model) while the highest R2 value is 0.979 (Weibull model). The lowest value of χ2 is 0.001984 (Weibull model) while the highest value is 0.038375 (exponential model). The lowest value of MBE is -0.04619 (exponential model) while the highest value is 0.004715 (Weibull model). The lowest value of RMSE is 0.040289 (Weibull model) and the highest value is
IJSER © 2015 http://www.ijser.org
International Journal of Scientific & Engineering Research, Volume 6, Issue 5, May-2015 33
ISSN 2229-5518
0.186778 (exponential model). Close examination of these statistical criteria show that Weibull model has the highest value of R2 and lowest values of χ2 and RMSE. Therefore Wiebull model is adjudged to have the best fit in modeling this re-hydration process.
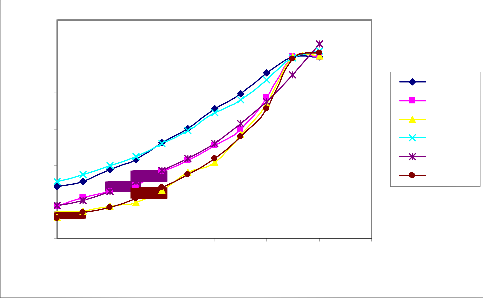
Figure 3 further proves the reliability of the Weibull model to adequately predict the re-hydration behaviour of the plantain samples. It shows the closeness of the experimental and predicted values of the moisture ratio at each temperature of the observation. The experimental and predicted values are closely related even sometime the graph overlaps each other.
(b) Table 2: Models Evaluation using statistical criteria
Model Temp

(oC)

R2 χ2 MBE RMSE
Peleg 20 0.882 0.010926 -0.02983 0.094551
30 0.913 0.008835 -0.0328 0.085021
40 0.935 0.008592 -0.01582 0.083844
Weibull 20 0.941 0.005678 0.004715 0.068157
30 0.979 0.001984 0.001749 0.040289
40 0.950 0.006656 0.003269 0.073795
Exponential 20 0.748 0.023397 -0.04619 0.145841
30 0.701 0.025798 -0.03916 0.153141
40 0.653 0.038375 -0.03491 0.186778
1.2
1
0.8
0.6
0.4
Exp (20°C) Exp (30°C) Exp (40°C) Pre (20°C) Pre (30°C)
Pre (40°C)
0.2
0
0 10 20 30 40 50 60
Tim e (m ins )
Figure 3: Experimental and predicted moisture ratio against time using Weibull model
The constant in each model is as presented in Table 3. The value of k1 in Peleg model is as follows; 91.78,
60.192 and 27.643 (minutes) which correspond to 20, 30 and 40oC respectively. This shows that the value
of k1 is indirectly related the temperature of rehydration. k1 is called Peleg rate constant and connotes mass transfer rate into /from a food sample. It relates with water absorption rate in that at lower value of k1 , there is high initial water absorption rate within the sample as reported by [31]. The lower the value of k 1 , the higher the water absorption rate. This k1 is also temperature sensitive as its value decreased at higher temperature, the rate of water absorption is increased as shown in the curve (Figure 1). This observation has been reported earlier by other researchers such as [2], [33], [17], [36], [35], [25]. The parameter k2 is
IJSER © 2015 http://www.ijser.org
International Journal of Scientific & Engineering Research, Volume 6, Issue 5, May-2015 34
ISSN 2229-5518
known as Peleg capacity constant and relates to the extent of water absorption. The lower the value of k2, the higher the water absorption. This assertion has been reported by [36], [31], [26]. The value of β in Weibull is as follows; -38.191, -27.908 and -21.48 for 20, 30 and 40oC respectively. The values of β increase as the rehydrating temperature increases showing the same trend as in Peleg model. Also, the value of α increase with increase in temperature from 0.305, 0.179 and 0.109 for re-hydrating temperature of 20, 30 and 40oC. The increase in α value is an indication of initial higher water absorption rate as reported by [29], [9]. The values of k in exponential model increase as the temperature increases as shown in Table 3. The values are as follows: 8.744, 14.422 and 17.977 min-1 for 20, 30 and 40oC respectively. This effect of temperature on model constants has been earlier reported by other researchers such as [27], [28].
(c) Table 3: Values for model constants


Model Temp (oC) k (min-1) k1 (min) k2 (-) α (-) β (min)
Peleg 20 91.78 0.410
30 60.192 -0.228
40 27.643 -0.918
Weibull 20 0.305 -38.191
30 0.179 -27.908
40 0.109 -21.48
Exponential 20 8.744
30 14.422
40 17.977
4. CONCLUSION
Temperature and soaking time affected water absorption behaviour of the unripe plantain chips samples in
such a way that as temperature increased, water absorption was also increased. Weibull model had best fit and represent well the re-hydration characteristics of the dehydrated plantain chips.
5. REFERENCES
[1] Addo, A, Bart-Plange, A, and Dzisi, K. (2006). Water absorption characteristics of Obatanpa and
Mamaba Maize Hybrids(Zea mays). International Journal of Food Engineering, 2 (3), Art. 7. DOI:
10.2202/1556-3758.1067
[2] Afolabi, T.J., Agary, S.E. and Tunde-Akintunde, T.Y. (2014). Modelling the water absorption characteristics of different maize (Zea Mays L.) types during soaking. Chemical and Process Engineering Research, volume 25, p 53
[3] Ajala, A.S., Ajala, F.A. and TundeiJAkintunde, T.Y. (2012). Study on Drying Kinetics of
Fermented Corn Grains. Food Science and Quality Management, Vol 5, pp10-12
[4] Ajala, A.S. (2014). Optimization of the drying of cassava chips in a tunnel dryer. A PhD thesis submitted to the Department of Food Science and Engineering, Faculty of Engineering and Technology Ladoke Akintola University of Technology, Ogbomoso, Nigeria. Pp 133-135
[5] Akinyemi, S.O.S. Aiyelaagbe, I.O.O. and Akyeampong, E. (2010). Plantain (Musa spp.) cultivation in Nigeria: a review of its production, marketing and research in the last two decades. Acta Hort. 879: 211-214
[6] Ali Y., Mehmet, D. Ö., Mustafa, B. (2010). Modeling of water absorption of ultrasound applied chickpeas (Cicer arietinum L.) using Peleg’s equation. Journal of Agricultural Sciences, volume
16, pp 278-286
IJSER © 2015 http://www.ijser.org
International Journal of Scientific & Engineering Research, Volume 6, Issue 5, May-2015 35
ISSN 2229-5518
[7] Baruwa, O.I., Masuku, M.B. and Alimi, 1T. (2011). Economic analysis of plantain production in derived savannah zone of Osun State, Nigeria. Asian Journal of Agricultural Sciences 3(5): 401-
407
[8] Demir, V., Gunhan, T., Yagcioglu, A.K. and Degirmencioglu, A. 2004. Mathematical modeling and the determination of some quality parameters of air dried bay leaves. Biosystems Engineering,
88: 429-437Doymaz, I. 2007. Air drying characteristics of tomatoes. Journal of Food Engineering,
78:1291-1297
[9] Elçin, D. and Belma, Ö. (2015). Modeling of the Water Uptake Process for Cowpea Seeds(Vigna Unguiculata L.) under Common Treatment and Microwave Treatment, J. Chem. Soc.Pak., Vol. 37, No. 01, 2015, pp1-5
[10] Fakayode, B.S., Rahji, M.A.Y. Ayinde,O.and Nnom, G.O. (2011). An economic assessment of plantain production in Rivers State,Nigeria. InternationalJournalofAgriculturalEconomics&RuralDevelopment 4 (2): 28-30
[11] FAO (1990). Food Agriculture Organisation (FAO) 1990. Annuaire de la production mondiate
(Annual Book of the World Production). Roma, Italy
[12] FAO (2004) Anuario Estadístico FAO. www.faostat.fao.org. (02/2008).
[13] Frison, E.A and S.L Sharrock (1999): “Introduction: The Economic, Social and Nutritional
Importance of Banana in the World” In Banana and Food Security.
[14] Hung T.V, Liu LH, Black RG, & Trewhella MA (1993). Water absorption in chicken pea (C. arientum) and field pea (P. sativum) cultivars using Peleg’s model. Journal of Food Science, 58,
848–852.
[15] Kainga, P.E., and Seiyabo, I.T. (2012). Economics of plantain production in Yenagoa Local Government Area of Bayelsa State. Journal of Agriculture and Social Research (JASR) Vol. 12, No. 1:114-116
[16] Khazaei, J. (2008). Characteristics of mechanical strength and water absorption in almond and its
kernel. Cercetări Agronomice în Moldova Vol. XLI , No. 1 (133)
[17] Maharaj, V. and Sankat C.K. (2000). The rehydration characteristics and quality of dehydrated dasheen leaves. Canadian Journal of Agricultural Engineering, 42(2), 81– 85.
[18] Maydeu-Olivares, A. and Garcı´a-Forero, C. 2010. Goodness-of-Fit Testing. International
Encyclopedia of Education (2010), vol. 7, pp. 190-196
[19] Mepba, D.H., Eboh L, Nwaojigwa, S.U. (2007). Chemical composition, functional and baking properties of wheat-plantain composite flours. Afr. J. Food Agric. Nutr. Dev., 7(1): 1-22
[20] Ogazi, P.O., Oyewusi, F.A., Ozumba, A.U., Ogundipe, H.O., Osifo, B.O.A. and Lukambi, F.A. (1996). Development and Sensory Evaluation of Soyamusa: A Soybean-Plantain Baby Food. ISHS Acta Hortic., p.540: International Conference on Banana and Plantain for Africa.
[21] Olaoye, O.A., Onilade, A.A., Idowu, O.A. (2006). Quality characteristics of bread produced from composite flours of wheat, plantain and soybeans. Afr. J. Biotechnol., 5(11): 1102-1106.
[22] Olorunda A.O and Adelusola M.A, (1997), Screening of plantain/banana cultivars for import, storage and processing characteristics, Paper presented at the International Symposium on genetic improvement of bananas for resistance to disease and pests, 7-9 September, IRAD, Montpellier, France.
IJSER © 2015 http://www.ijser.org
International Journal of Scientific & Engineering Research, Volume 6, Issue 5, May-2015 36
ISSN 2229-5518
[23] Onuoha, O.N., Eme, P.E. and Ekpo, U.E. (2014). Chemical evaluation of unripe plantain dishes commonly consumed by type 2 diabetics attending the University of Uyo Teaching Hospital in Akwa Ibom State, Nigeria. Pakistan Journal of Nutrition 13 (6): 331-334
[24] Otegbayo BO, Sobande FO, Aina JO (2002). Nutritional quality of soy-plantain extruded snacks.
Ecol. Food Nutr., 42(5): 473-474.
[25] Quicazán MC, Caicedo LA, & Cuenca M (2012). Applying Peleg's equation to modelling the kinetics of solid hydration and migration during soybean soaking. Ingeniería e Investigación 32 (3), 53-57.
[26] Resio, C.A., Aguerre, R.J. and Suarez, C. (2006). “Hydration kinetics of amaranth grain,” Journal of Food Engineering, 72, 247–253
[27] Sabrina, C., Shilpi, G. and Nissreen, A. (2012). Effect of different rehydration temperatures on moisture and phytochemical constituents of dried edible irish brown seaweed. Dublin Institute of Technology. Pp1-3
[28] Sedat, S., Mahir, T. and Sundaram, G. (2001). Analysis of chickpea soaking by simultaneous water transfer and water-starch reaction. Journal of Food Engineering, volume 50: 91-98
[29] Shafaei, S. M. Masoumi, A. A. (2014). Estimating moisture absorption kinetics of beans during soaking using mathematical models. Agric. International: GIGR Journal volume 16 no 3 pp231-
234
[30] Shittu TA, Awonorin SO, & Raji AO (2004). Evaluating some empirical models for predicting water absorption in African Breadfruit (Treculia Africana) seeds. International Journal of Food Properties, 7(3), 585-602
[31] Sibian, M.S. Saxena, D.C. and Riar, C.S. (2013). Study of absorption behaviour, functional and pasting properties of pearl millet soaking under different chemical stresses. International Journal of Agriculture and Food Science Technology. Volume 4, Number 4, pp. 347-352
[32] Smiles D.E. (2005). Temperature effect on water absorption by three different porous materials.
Soil Research 43(4) 533-540)
[33] Sopade P.A., Ajisegiri ES, & Badau MH (1992). The use of P\eleg’s equation to model water absorption in some cereal grains during soaking. Journal of Food Engineering, 15, 269–283.
[34] Sopade, P.A., Ajisegiri ES, & Okonmah GN (1994). Modelling water absorption characteristics of some Nigerian varieties ofcowpea during soaking. Tropical Science, 34, 297–305.
[35] Tunde-Akintunde T.Y. (2010). Water absorption characteristics of Nigerian Acha (Digitariaexilis).
International Journal of Food Engineering, 6 (5), art 11: 1-10. DOI: 10.2202/1556-3758.1650
[36] Turhan M, Sayar S, & Gunasekaran S (2002). Application of Peleg’s model to study water absorption in chicken pea during soaking. Journal of Food Engineering, 53(2), 153–159.
[37] Wills R.B.H, McGlasson W.B, Graham D, Lee T.H and Hall E.G. (1989), Physiology and Biochemistry of Fruit and Vegetables. In Wills R.B.H, McGlasson W.B, Graham D, Lee T.H and Hall E.G. Post harvest – An Introduction to the Physiology and Handling of Fruit and Vegetables, London, BSP Professional Books, 174.
IJSER © 2015 http://www.ijser.org
International Journal of Scientific & Engineering Research, Volume 6, Issue 5, May-2015 37
ISSN 2229-5518
IJSER © 2015 http://www.ijser.org