model of the process as shown in Figure 1.
International Journal of Scientific & Engineering Research, Volume 5, Issue 5, May-2014 1474
ISSN 2229-5518
Water-Gas Shift Process for Hydrogen
Production – Effects of Operating Parameters
Abdulwahab GIWA, Yusuf Olabode RAJI and Saidat Olanipekun GIWA Abubakar Tafawa Balewa University, Tafawa Balewa Way, PMB 0248, Bauchi, Nigeria
Emails: abdulwahabgiwa@gmail.com, bode2000eh@gmail.com and sogiwa@gmail.com
800 oC and a reactor pressure of 1 bar as the initial simulation data. The effects of the parameters were studied by varying each one of them at a time between the selected lower and upper limits using their corresponding chosen increments. The results obtained from the simulations carried out revealed that the composition of the product obtained
from the reactor was affected by the carbon monoxide feed molar flow rate, the steam feed molar flow rate and the
reaction temperature whereas it was not influenced by the reactor pressure. Also, the equilibrium constant of the reaction was found to depend well on the reaction temperature. In addition, the relationship between each of the operating parameters and the product molar density showed that the latter was affected by the reaction temperature and pressure nonlinearly and linearly, respectively. It has, therefore, been discovered that the key parameter that can be adjusted to influence the production of hydrogen using water-gas shift process is the reaction temperature because it was able to affect all the process variables considered significantly.
—————————— ——————————
Hydrogen is one of the most important industrial commodities. It is used in the production of ammonia, urea,
methanol and higher alcohols, and hydrochloric acid. It is also used as a reducing agent, and to desulfurize various petroleum and edible oils. In addition, it is used in a multitude of industrial processes as a fuel, and, also, in liquid form, it is an important cryogenic fluid (Kroschwitz, 2001).
Actually, hydrogen may become an important secondary energy form if problems of generating, storage, and transportation can be solved. Like electricity, hydrogen requires some other sources of energy for its production. Once produced, however, hydrogen holds the promise of significant technical and economic advantages over its competition. For example, preliminary calculations show that pipelining hydrogen should be cheaper than transporting electricity by wire. Arguments, currently unresolved, surround costs and the possibility that cheaper methods of manufacture may be possible by unconventional means (Austin, 1984).
Since it has been discovered that hydrogen is an important energy form, it means that any research that will enhance the production of hydrogen should be seriously embarked upon. As can be obtained from the literature, one of the processes used for the production of hydrogen is water-gas shift process. As such, the study of anything related to water-gas shift process will definitely contribute to hydrogen production.
Water-gas shift reaction, otherwise referred to as water-gas shift process describes the reaction of car-bon
monoxide and steam to form carbon dioxide and hydrogen. The process was discovered by an Italian physicist Felice Fontana in 1780. It was not until much later that the industrial value of this process was realized. Before the early 20th century, hydrogen was obtained by reacting steam under high pressure with iron to produce iron, iron oxide and hydrogen. With the development of industrial processes that required hydrogen, such as the Haber–Bosch ammonia synthesis, the demand for a cheaper and more efficient method of hydrogen production was needed (Vielstich et al.,
2003). As a resolution to this problem, the water-gas shift reaction was combined with the gasification of coal to produce pure hydrogen product. As the idea of hydrogen economy gains popularity, the focus on hydrogen as a replacement fuel source for hydrocarbons increases.
According to the information gathered from the literature, it was found that Boutikos and Nikolakis (2010) carried
out a simulation study of the effect of operating and design parameters on the performance of a water-gas shift membrane reactor by considering the effects of the relative values of membrane permselectivity, permeation flux and reaction rate on the performance of a water-gas shift membrane reactor. Smith et al. (2011) used Computational Fluid Dynamics (CFD) to analyze water-gas shift membrane reactor. Chen et al. (2008) modeled and simulated hydrogen generation from high-temperature and low-temperature water-gas shift reactions in order to aid in recognizing the
IJSER © 2014 http://www.ijser.org
International Journal of Scientific & Engineering Research, Volume 5, Issue 5, May-2014 1475
ISSN 2229-5518
detailed phenomena of the WGSRs through taking into account the effects of both the reaction temperature and the steam/CO ratio. Giunta et al. (2006) carried out the simulation of a low temperature water-gas shift reactor using a heterogeneous model. Falco et al. (2011) worked on the simulation of water-gas shift membrane reactors using a two- dimensional model and investigated the effect of hydrogen removal in membrane water-gas shift reactors in order to analyze the performance of the reactor type. Brunetti et al. (2007) also carried out the simulation study of water-gas shift reaction by employing a membrane reactor. Finally, Giwa and Giwa (2013) carried out the simulation, sensitivity analysis and optimization of hydrogen production by steam reforming of methane using Aspen Plus; in their work, the production of hydrogen was simulated by considering a steam reforming process that involved a reforming reaction and a water-gas shift reaction.
In an attempt to contribute to the success of this (water-gas shift) process for the production of hydrogen, it is aimed, in this work, to investigate the effects of some operating parameters (steam molar flow rate, carbon monoxide molar flow rate, reaction temperature and reactor pressure) on the process with the aid of Aspen Plus. It is intended that the variations of the product composition, the reaction equilibrium constant and the molar density of the reactor product obtained from water-gas shift process to the selected operating parameters will be clearly given.
The water-gas shift process studied in this work was accomplished by developing an Aspen Plus (Aspen, 2012)
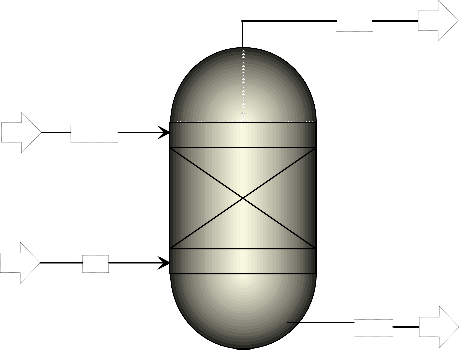
model of the process as shown in Figure 1.
TOPP
WGSR
STEAM
CO
BOTP
Figure 1. Aspen Plus model of water-gas shift process for hydrogen production
As can be seen from Figure (1), the process had two feed streams – carbon monoxide and steam. The steam feed entered the reactor at a temperature of 100 oC and a pressure of 1 bar while the carbon monoxide entered the reactor at a temperature and a pressure of -150 oC and 1 bar, respectively. For the initial simulation of the process in Aspen Plus environment, 50 kmol/hr of each feed was used and the temperature of the reactor was set to 800 oC while its pressure was 1 bar. The non-random two-liquid (NRTL) activity coefficient model was used as the property method for the development of the Aspen Plus model of the water-gas shift process. The reaction occurring in the reactor, which was an equilibrium type, is written as given in Equation (1) below:
CO + H2O ↔ CO2 + H2
(1)
For the investigations of the effects of the operating parameters (steam molar flow rate, carbon monoxide molar flow rate, reaction temperature and reactor pressure) on the selected process variables (the product composition, the reaction equilibrium constant and the molar density of the reactor product), the ranges of the operating parameters used are as given in Table 1.![]()
Table 1. Ranges of operating parameters investigated
Parameter Overall Range
IJSER © 2014 http://www.ijser.org
International Journal of Scientific & Engineering Research, Volume 5, Issue 5, May-2014 1476
ISSN 2229-5518
Upper Increment
In the course of the investigations, each of the operating parameters shown in the table above was used to run the developed Aspen Plus model of the water-gas shift process, one at a time. In other words, when one operating parameter was varied, the other ones were kept constant at the values used for the initial model simulation.
At this point, it should be noted that the reactor has two outlet streams, that is, the top product and the bottom product. Owing to the fact that the reaction of this process is in vapor phase, the top product of the reactor was taken as the product (reactor product).
The results obtained from the simulation of the developed Aspen Plus model of the water-gas shift process using
50 kmol/hr of each of the reactants (carbon monoxide and steam), and using reaction temperature and pressure of
800 oC and 1 bar, respectively revealed that the mole fraction of the hydrogen obtained from the process at steady
state was 0.2552.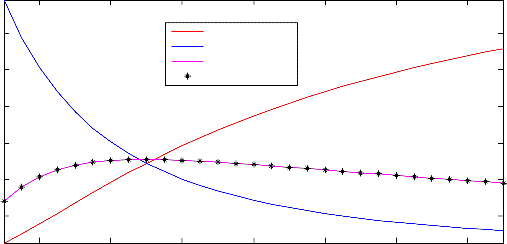
0.6
0.5
Carbon monoxide
Steam
Carbon dioxide
Hydrogen
0.4
0.3
0.2
0.1
20 40 60 80 100 120 140
Carbon monoxide flow rate (kmol/hr)
Figure 2. Effect of carbon monoxide flow rate on product composition
Even though this purity (mole fraction) was found to be very low, no attempt was made to maximize it at this stage because the aim of the work was to investigate the effects of the selected operating parameters on the process for hydrogen production and, since, in the course of the investigations, the variation of the mole fraction of hydrogen, as the operating parameters are varied, will also be clear.
After the initial simulation of the process model of the water-gas shift process, the operating parameters were
varied (using the data given in Table 1) and the results of the variations on the mole fraction of the top product are as given in Figures 2 – 5.
From Figure 2 showing the effect of carbon monoxide molar flow rate on product composition, it was noticed that, as the molar flow rate of carbon monoxide feed was increased, the mole fraction of steam was found to decrease while that of carbon monoxide was found to increase. Furthermore, the mole fraction profile of the main product of the process (hydrogen) was found to increase, but it later decreased as the carbon monoxide feed flow rate was increased more than about 50 kmol/hr. The trend of the mole fraction profile of other product of the process (carbon dioxide) was found to be the same as that of hydrogen product. From this results, it has been discovered that there should be an optimum value of molar flow rate of carbon monoxide feed that is required to give high purity of hydrogen in the product of the water-gas shift process.
Shown in Figure 3 are the mole fractions of the reactor product components obtained when the molar flow rate of steam was varied. As can be seen from the figure, the behaviors of the products were found to be the same as those observed, before, when the molar flow rate of carbon monoxide was varied. However, the observations made for carbon monoxide and steam were not the same as before. As shown in the figure, the mole fractions of carbon monoxide and steam were found to decrease and increase, respectively as the molar flow rate of steam feed used in
IJSER © 2014 http://www.ijser.org
International Journal of Scientific & Engineering Research, Volume 5, Issue 5, May-2014 1477
ISSN 2229-5518
the course of running the process was increased. These results were actually found to be in line, but not the same, with what was observed when the molar flow rate of carbon monoxide feed was varied because, then, the mole fraction of carbon monoxide increased as the molar flow rate of carbon monoxide feed was increased. In this case, now, as the molar flow rate of steam feed was increased, the mole fraction of steam found in the reactor product was found to also increase.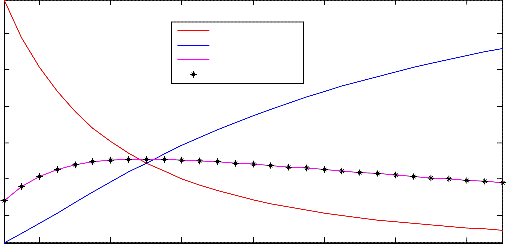
0.6
0.5
Carbon monoxide
Steam
Carbon dioxide
Hydrogen
0.4
0.3
0.2
0.1
20 40 60 80 100 120 140
Steam flow rate (kmol/hr)
Figure 3. Effect of steam flow rate on product composition
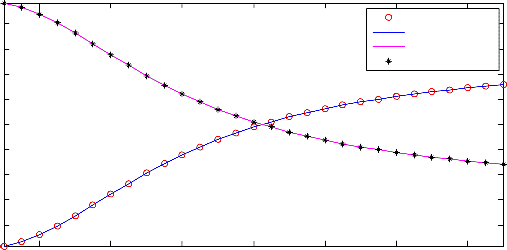
In Figure 4, the effect of reaction temperature on the composition of the product obtained from the water-gas shift process studied in this work is shown. From the figure, it was observed that the mole fraction profiles of the two reactants of the process were found to increase while those of the products were found to decrease with increase in the reaction temperature. The results obtained in this case has revealed that low temperature was favorable to high conversion of the reactants in this process. This discovery was found to be in conformity with what is available in the literature (for instance, in the book of Austin (1984)) that water-gas shift reaction is favored by low temperature. This has testified to the fact the results of the simulation carried out using Aspen Plus are in good agreement with the basic principles of the process available in the literature.
0.45
0.4
0.35
Carbon monoxide
Steam
Carbon dioxide
Hydrogen
0.3
0.25
0.2
0.15
0.1
0.05
200 400 600 800 1000 1200 1400
Reaction temperature (oC)
Figure 4. Effect of reaction temperature on product composition
Also investigated in this work was the effect of pressure on the mole fractions of the components present in the product of the water-gas shift process and the results of this investigation are as given in Figure 5. From the figure, it was discovered that the mole fractions of the components were constant as the pressure was varied from 1 to 15 bar.
IJSER © 2014 http://www.ijser.org
International Journal of Scientific & Engineering Research, Volume 5, Issue 5, May-2014 1478
ISSN 2229-5518
This was also found to correspond to the observation made by Austin (1984) that water-gas shift reaction is unaffected by pressure.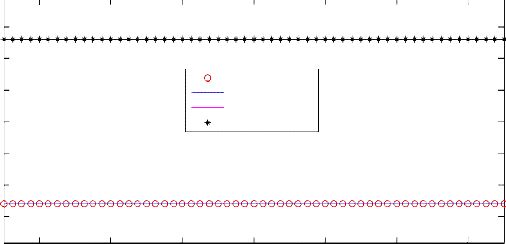
0.256
0.254
0.252
0.25
Carbon monoxide
Steam
Carbon dioxide
Hydrogen
0.248
0.246
0.244
2 4 6 8 10 12 14
Reactor pressure (bar)
Figure 5. Effect of reactor pressure on product composition
Even though the main focus of this research work was on hydrogen, as can be noticed, the other components involved in the process used for the production of hydrogen were also considered in order to develop the means of enhancing the conversions of the process reactants and suppressing the production of other products so that high purity of the desired product (hydrogen) can be obtained from the process.
Also investigated in this work were the influences of the operating parameters of the water-gas shift process on
the equilibrium constant of the reaction because equilibrium constant is an important factor in any equilibrium reaction like the one being considered in this study. Just as the operating parameters were varied when their effects on the product composition were being investigated, the same thing has been carried out to know their effects on the equilibrium constant of the reaction and the results obtained are as given in Figures 6 – 9.
The effect of carbon monoxide feed molar flow rate on the equilibrium constant of the reaction is shown in Figure
6. From the figure, it was observed that there was not any change in the equilibrium constant of the reaction as the molar flow rate of carbon monoxide feed was varied. This was an indication that the equilibrium constant of this process was independent of the molar flow rate of carbon monoxide feed.
2
1.8
1.6
1.4
1.2
1
0.8
0.6
0.4
0.2
20 40 60 80 100 120 140
Carbon monoxide flow rate (kmol/hr)
Figure 6. Effect of carbon monoxide flow rate on the reaction equilibrium constant
IJSER © 2014 http://www.ijser.org
International Journal of Scientific & Engineering Research, Volume 5, Issue 5, May-2014 1479
ISSN 2229-5518

2
1.8
1.6
1.4
1.2
1
0.8
0.6
0.4
0.2
20 40 60 80 100 120 140
Steam flow rate (kmol/hr)
Figure 7. Effect of steam flow rate on the reaction equilibrium constant
Also investigated, and the result of which is given in Figure 7, was the effect of steam feed molar flow rate on the equilibrium constant of the process. Similar to what was obtained in the case of the carbon monoxide feed molar flow rate, the molar flow rate of steam feed was found not to have any effect on the reaction equilibrium constant either.
Figure 8 shows the results obtained when the effect of the reaction temperature on the reaction equilibrium
constant was investigated. According to the figure, the increase in the water-gas shift reaction temperature made the reaction equilibrium constant to decrease (see Figure 8). It has thus been seen that the reaction equilibrium constant of this process is a function of the reaction temperature because the equilibrium constant changed as the reaction temperature was varied.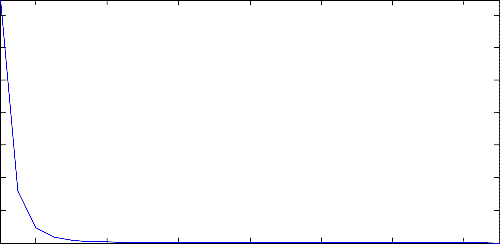
3500
3000
2500
2000
1500
1000
500
200 400 600 800 1000 1200 1400
Reaction temperature (oC)
Figure 8. Effect of reaction temperature on the reaction equilibrium constant
IJSER © 2014 http://www.ijser.org
International Journal of Scientific & Engineering Research, Volume 5, Issue 5, May-2014 1480
ISSN 2229-5518

2
1.8
1.6
1.4
1.2
1
0.8
0.6
0.4
0.2
2 4 6 8 10 12 14
Reactor pressure (bar)
Figure 9. Effect of reactor pressure on the reaction equilibrium constant
In Figure 9, the relationship between the equilibrium constant of the process and the reactor pressure is given. It can be seen from the straight horizontal line of the relationship shown in the figure that the reaction equilibrium constant did not change with changes in the reactor pressure. In other words, for the study that has been carried out in this work, the reaction equilibrium constant was discovered to be independent of the reactor pressure.
So far, it has been seen from the investigations carried out that all the operating parameters considered except reaction temperature did not affect the equilibrium constant in any way because they all gave constant horizontal curves while only the study of the reaction temperature on the reaction equilibrium constant was able to produce a curve that decreased with increase in reaction temperature.
In order to establish the dependence of this process more on temperature than any of the other parameters considered in this work, the relationship between each of the operating parameters and the molar density of the reactor product was also studied. The results obtained from this study are as given in Figures 10 – 13.
1
0.8
0.6
0.4
0.2
0
-0.2
-0.4
-0.6
-0.8

20 40 60 80 100 120 140
Carbon monoxide flow rate (kmol/hr)
Figure 10. Relationship between the product molar density and carbon monoxide feed molar flow rate
IJSER © 2014 http://www.ijser.org
International Journal of Scientific & Engineering Research, Volume 5, Issue 5, May-2014 1481
ISSN 2229-5518

1
0.8
0.6
0.4
0.2
0
-0.2
-0.4
-0.6
-0.8
20 40 60 80 100 120 140
Steam flow rate (kmol/hr)
Figure 11. Relationship between the product molar density and steam feed molar flow rate
Shown in Figure 10 is the relationship between the reactor product molar density and carbon monoxide feed molar flow rate. As can be seen from the figure, the change in the carbon monoxide feed molar flow rate did not have any effect on the molar density of the product because the curve was just a horizontal straight line.
Figure 11 shows the profile obtained from the study carried out on the relationship between the reactor product
molar density and steam feed molar flow rate. Just as it was obtained in the case of the carbon monoxide feed molar flow rate that was studied before, the profile in this case was also found to be a horizontal straight line, which implied that the steam feed molar flow rate had not any effect on the molar density of the reactor product.
The results obtained from the investigation carried out on the effect of the reaction temperature on the molar
density of the reactor product of this water-gas shift process, given in Figure 12, have shown that the reaction temperature could influence the molar density of the reactor product significantly. As can be seen, the product molar density was found to decrease in a, somehow, nonlinear manner as the reaction temperature was increased.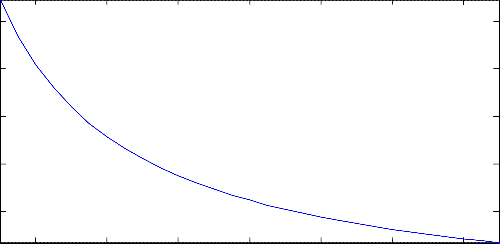
0.03
0.025
0.02
0.015
0.01
200 400 600 800 1000 1200 1400
Reaction temperature (oC)
Figure 12. Relationship between the product molar density and the reaction temperature
IJSER © 2014 http://www.ijser.org
International Journal of Scientific & Engineering Research, Volume 5, Issue 5, May-2014 1482
ISSN 2229-5518
0.16
0.14
0.12
0.1
0.08
0.06
0.04
0.02
2 4 6 8 10 12 14
Pressure (bar)
Figure 13. Relationship between the product molar density and the reactor pressure
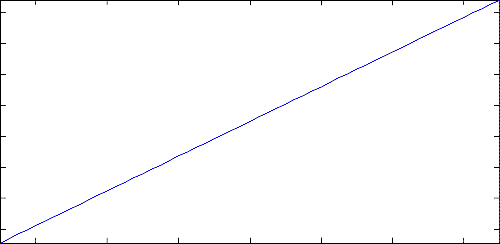
Also considered in this work, and the results of which are as shown in Figure 13, was the effect of the water-gas shift reactor pressure on the molar density of the reactor product obtained from the water-gas shift process used for the production of hydrogen. From the figure, it was discovered that the reactor product molar density increased with increase in the reactor pressure. Moreover, the relationship between the reactor product molar density and the reactor pressure was found to be, somehow, linear, as seen in Figure 13, and as against that of the reaction temperature in which case that the relationship was found to be, somehow, nonlinear.
It has thus been discovered that, among all the parameters considered for the product molar density, the reaction temperature and the reactor pressure were the ones found to be effective in causing changes in the molar density of the reactor product, as they were varied. In other words, the molar density of the reactor product has been found to depend on both the reaction temperature and the reactor pressure of the water-gas shift process.
The results obtained from the investigations carried out on the effects of the operating parameters of water-gas
shift process used for the production of hydrogen have revealed that carbon monoxide feed molar flow rate, steam feed molar flow rate and reaction temperature were found to affect the composition of the product obtained from the reactor while pressure was not found to be so. Furthermore, among the operating parameters considered, the equilibrium constant of the reaction was found to depend on only the reaction temperature. That is, the equilibrium constant of this process was found to be a function of the reaction temperature. Also, the relationship between each of the operating parameters considered and the product molar density revealed that the reaction temperature and the reactor pressure were found to affect the product molar density in, somehow, nonlinear and linear manners, respectively.
BOTP Reactor bottom product
CFD Computational Fluid Dynamics
CO Carbon monoxide feed
PEM Proton exchange membrane
STEAM Steam feed
TOPP Reactor top product
WGS Water-gas shift
WGSR Water-gas shift reactor
(1) Aspen, Aspen Plus, Aspen Technology, USA, 2012.
(2) Austin, G.T., Shreve’s Chemical Process Industries, 5th Edition, McGraw-Hill Book Company, Singapore, 1984.
(3) Boutikos, P. and Nikolakis, V., “A Simulation Study of the Effect of Operating and Design Parameters on the
Performance of a Water Gas Shift Membrane Reactor, Journal of Membrane Science,” Volume 350, Issues 1–2, 15
March 2010, Pages 378–386.
IJSER © 2014 http://www.ijser.org
International Journal of Scientific & Engineering Research, Volume 5, Issue 5, May-2014 1483
ISSN 2229-5518
(4) Brunetti, A., Caravella, A., Barbieri, G., and Drioli, E., “Simulation Study of Water Gas Shift Reaction in a
Membrane Reactor,” Journal of Membrane Science, Volume 306, Issues 1–2, 1 December 2007, Pages 329–340.
(5) Chen, W.-H., Lin, M.-R., Jiang, T.L., and Chen, M.-H., “Modeling and Simulation of Hydrogen Generation from High-Temperature and Low-Temperature Water Gas Shift Reactions,” International Journal of Hydrogen Energy, Volume 33, Issue 22, November 2008, Pages 6644–6656.
(6) Falco, M.D., Piemonte, V., Basile, A., “Simulation of Water Gas Shift Membrane Reactors by a Two-dimensional
Model,” Computer Aided Chemical Engineering, Volume 29, 2011, Pages 1643–1647.
(7) Giunta, P., Amadeo, N., and Laborde, M., “Simulation of a Low Temperature Water Gas Shift Reactor Using
The Heterogeneous Model/Application to a PEM Fuel Cell,” Journal of Power Sources, Volume 156, Issue 2, 1
June 2006, Pages 489–496.
(8) Giwa, A. and Giwa, S.O., “Simulation, Sensitivity Analysis and Optimization of Hydrogen Production by Steam Reforming of Methane Using Aspen Plus,” International Journal of Engineering Research & Technology, Volume 2, Issue 7, July 2013, 1719-1729.
(9) Kroschwitz, J.I., Kirk-Othmer Encyclopedia of Chemical Technology, John Wiley & Sons, Inc., New York, 2001.
(10) Smith, R.J.B., Muruganandam, L., and Shekhar, S.M., “CFD Analysis of Water Gas Shift Membrane Reactor, Chemical Engineering Research and Design,” Volume 89, Issue 11, November 2011, Pages 2448–2456.
(11) Vielstich, W., Lamm, A., and Gasteiger, H.A., Handbook of Fuel Cells: Fundamentals, Technology, Applications
(Reprinted ed.), Wiley, New York, 2003.
IJSER © 2014 http://www.ijser.org