International Journal of Scientific & Engineering Research, Volume 1, Issue 2, November-2010 1
ISSN 2229-5518
The Insulin Bio Code - Standard Deviation
Lutvo Kuric
Bosnia and Herzegovina
ABSTRACT-This paper discusses cyberinformation studies of the amino acid composition of insulin, in particular the identification of scientific terminology that could describe this phenomenon, ie, the study of genetic information, as well as the relationship between the genetic language of prot eins and theoretical aspect of this system and cybernetics. The result of this research show that there is a matrix code for insulin. It also shows that the coding system within the amino acidic language gives detailed information, not only on the amino acid „record“, but also on its structure, configuration and its various shapes. The issue of the existence of an insulin code and coding of the individual structural elements of this prot ein are discussed. Answers to the following questions are sought. Does the matrix mechanism for biosynthesis of this prot ein function within the law of the general theory of information systems, and what is the significance of this for understanding the genetic language of insulin? W hat is the essence of existence and functioning of this language?
Is the genetic information charact erized only by biochemical, or also by cyberinformation principles? The potential effects of physical and chemical, as well as cybernetic and inform ation ptinciples, on the biochemical basis of insulin are also investigated.This aper discusses new methods for developing genetic technologies, in particular more advanced digit al technology based on programming, cybernetics, and informational laws and systems, and how this new technology could be useful in medicine, bioinformatics, genetics, biochemistry, and other natural sciences.
Index Terms: - human insulin; bio code; standard deviation; genetics code; amino acids code;
The biologic role of any given protein in essential life processes, eg, insulin, depends on the positioning of its component amino acids, and is understood by the „positioning of letters forming words“. Each of these words has its biochemical base. If this base is expressed by corresponding discrete numbers, it can be seen that any given base has its own program, along with its own unique cybernetics and information characteristics.
Indeed, the sequencing of the molecule is determined not only by distin biochemical features, but also by cybernetic and information principles. For this reason, research in this field deals more with the quantitative rather than qualitative characteristcs of genetic information and its biochemical basis. For the purposes of this paper, specific physical and chemical factors have been selected in order to express the genetic information for insulin.Numerical values are them assigned to these factors, enabling them to be measured. In this way it is possible to determine oif a connection really exists between the quantitative ratios in the process of transfer of genetic information and the qualitative appearance of the insulin molecule. To select these factors, preference is given to classical physical and chemical parameters, including the number of atoms in the relevant amino acids, their analog values, the position in these amino acids in the peptide chain, and their frenquencies.There is a arge numbers of these parameters, and each of their gives important genetic information. Going through this process, it becomes clear that there is a mathematical relationship between quantitative ratios and the qualitative appearance of the biochemical
„genetic processes“ and that there is a measurement method that can be used to describe the biochemistry of insulin.
The sample of an insulin can be represented by two different forms: one is the discrete form and the other is the sequential form. In the discrete form, a insulin is represented by a set of discrete codes or a multiple dimension vector. In the sequential form, an insulin is represent by a series of amino acids according to the order of their position in the chains 1AI0. Therefore, the sequential form can naturally reflect all the information about the sequence order and lenght of an Insulin. The crux is: can we develop a different discrete form to represent an insulin that will allow accomodation of partial, if not all, sequence-order information? Since a protein sequence is usually represented by a series of amino acid codes, what kind of numerical values should be assigned to these codes in order to optimally convert the sequence-order
information into a series of numbers for the discrete form representation?
IJSER © 2010 http://www.ijser.org
International Journal of Scientific & Engineering Research, Volume 1, Issue 2, November-2010 2
ISSN 2229-5518
How functioning of biochemistry is determined through cybernetic information principles, will be discussed further in next section.
The matrix mechanism of Insulin, the evolution of biomacromolecules and, especially, the biochemical evolution of Insulin language, have been analyzed by the application of cybernetic methods, information theory and system theory, respectively. The primary structure of a molecule of Insulin is the exact specification of its atomic composition and the chemical bonds connecting those atoms.
The structure 1AI0 has in total 12 chains. Out of these 2 are sequence-unique (Figure 1)![]()
1AI0:A
G I V E Q C C T S I C S L Y Q L E N Y C N
10 22 19 19 20 14 14 17 14 22 14 14 22 24 20 22 19 17 24 14 17
1 2 3 4 5 6 7 8 9 10 11 12 13 14 15 16 17 18 19 20 21
![]()
1AI0:B
F V N Q H I C G S H L V E A L
23 19 17 20 20 22 14 10 14 20 22 19 19 13 22
![]()
22 23 24 25 26 27 28 29 30 31 32 33 34 35 36
Y | L | V | C | G | E | R | G | F | I | Y | T | P | K | T |
24 | 22 | 19 | 14 | 10 | 19 | 26 | 10 | 23 | 22 | 24 | 17 | 17 | 24 | 17 |
37 | 38 | 39 | 40 | 41 | 42 | 43 | 44 etc. | 45 | 46 | 47 | 48 | 49 | 50 | 51 |
Rank = 1,2,3..., n.
Number of amino acids = 306; Number of atoms = 5640;
„Fig 1.“ Number of atoms in insulin A and B chain
The aforementioned aminoacids are positioned from number 1 to 51. Numbers 1, 2, 3, n... present the position of a certain aminoacid. This positioning is of the key importance for understanding of programmatic, cybernetic and information principles in this protein. The scientific key for interpretation of biochemical processes is the same for insulin as other proteins and sequences in biochemistry. The first aminoacid in this example has 10 atoms, the second one 22, the third one 19, etc. They have exactly these numbers of atoms because there are many codes in the insulin molecule, analog codes, and other voded features. In fact, there is a cybernetic algorithm which it is „recorded“ that the firs amino acid has to have 10 atoms, the second one 22, the third one 19, etc. The first amino acid has its own biochemistry, as does the
second and the third, etc. The obvious conclusion is that there is a concrete relationship between
IJSER © 2010 http://www.ijser.org
International Journal of Scientific & Engineering Research, Volume 1, Issue 2, November-2010 3
ISSN 2229-5518
quantitative ratios in the process of transfer of genetic information and qualitative appearance, ie, the characteristcs of the organism.
We shall now give some mathematical evidences that will prove that in the biochemistry of insulin there really is programmatic and cybernetic algorithm in which it is „recorded“, in the language of mathematics, how the molecule will be built and what will be the quantitative characteristics of the given genetic information.
In genetics standard deviation is a measure of difference for interval and ratio variables between the observed number of atoms (DNA, RNA, protein) and the mean. The sign of deviation, either positive or negative, indicates whether the observation is larger than or smaller than the mean. The magnitude of the value reports how different (in the relevant numerical scale) an observation is from the mean. One of the features of the mean is that the sum of the deviations across the entire set of all observations is always zero.
The arithmetic mean of a list of numbers is the sum of all the members of the genetic sequences divided by the number of items in the list. If the list is a statistical sample, we call the resulting statistic a sample mean.
Examples are presented in Eq. [1].
Eq. [1]. The formula for calculating of the arithmetic mean of a list of numbers is the sum of all the members of the genetic
Insulin is composed of aminoacids with various numerical values. This numerical values are in an irregular order. Here is a concrete example:
G,A,C,S,T,N,P,V,E,Q,H,I,L, F,Y,K,R. = 17 aminoacids and 321 atoms; X = Standard deviation
X = (321 : 17) = 18,8823529
TABLE 1
Representation of the negative standard deviations 1.
Standard deviation (-)
Amino acids | Number of atoms | Standard deviation |
2 | 3 | 4 |
G | 10 | -8,882353 |
A | 13 | -5,882353 |
C | 14 | -4,882353 |
IJSER © 2010 http://www.ijser.org
International Journal of Scientific & Engineering Research, Volume 1, Issue 2, November-2010 4
ISSN 2229-5518
S | 14 | -4,882353 |
T | 17 | -1,882353 |
N | 17 | -1,882353 |
P | 17 | -1,882353 |
7 amino | 102 | (-)30,17647 |
(10–18,882353) = -8,882353; (13 – 18,882353) = -5,882353; (14 – 18,882353) = -4,882353; etc.
TABLE 2
Representation of the positive standard deviations 1.
Standard deviation (+)
Amino acids | Number of atoms | Standard deviation |
2 | 3 | 4 |
V | 19 | 0,117647 |
E | 19 | 0,117647 |
Q | 20 | 1,117647 |
H | 20 | 1,117647 |
I | 22 | 3,117647 |
L | 22 | 3,117647 |
F | 23 | 4,117647 |
Y | 24 | 5,117647 |
K | 24 | 5,117647 |
R | 26 | 7,117647 |
10 amino | 219 | +30,17647 |
(19 – 18,882353) = 0,117647; (20 – 18,882353) = 1,117647; (22 – 18,882353) = 3,117647; etc. (R - T) = (7,117647 – (-) 1,882353) = 9; (R - N) = (R-P) = 9; (F - S) = (F - C) = 9;
(L - T) = (L - N) = (L - P) = 5; (F - T) = (F - N) = (F-P) = 6;
etc.
A data set with a mean of 18,8823529 and a standard deviation of 30,17647.
A low standard deviation indicates that the data points tend to be very close to the mean, whereas high standard deviation indicates that the data is spread out over a large range of values.
Standard deviation (-) = -30,17647
Standard deviation (+) =+30,17647
Thus, there is a mathematical balance of negative and positive standard deviation. Schematic representation of the negative and positive standard deviations 1 we will show in the fig.2.
Mathematical evidence is provided here to prove that in the biochemistry of insulin there really is programmatic and cybernetic algorithm in which it is „recorded“, in the language of mathematics, how the
IJSER © 2010 http://www.ijser.org
International Journal of Scientific & Engineering Research, Volume 1, Issue 2, November-2010 5
ISSN 2229-5518
molecule will be built and what will be the quantitative characteristics of the given genetic information. Example: The standard deviation of the amino acids we can calculate with the help of determinants:
DET 7, 102, 10, 219 = 513; [513 : (7+10)] = 30,17647
Standard deviations: -30,17647, +30,17647, DET 30,17647
„Fig 2.“ Schematic representation of the determinants of standard deviation
As we see, the digital pictures of biochemistry provide us with cybernetic and information interpretation of the scientific facts. Now we have the exact scientific proofs that there is a genetic language that can be described by the theory of systems and cybernetics, and which functions in accordance with certain principles.
This protein has 306 amino acids. These amino acids are 5640 atoms.
X = Standard deviation
X = (5640:306) = 18,431373
TABLE 3.
Representation of the negative standard deviations 2.
Standard deviation (-)
Amino acids | Number of atoms | Standard deviation | Number of Aminoacids |
1 | 2 | 3 | 4 |
G | 10 | -8,431373 | 24 |
A | 13 | -5,431373 | 6 |
C | 14 | -4,431372 | 36 |
S | 14 | -4,431372 | 18 |
T | 17 | -1,431373 | 18 |
N | 17 | -1,431373 | 18 |
P | 17 | -1,431373 | 6 |
Sum | 102 | 126 |
(10-18,431373) = -8,431373; (13-18,431373) = -5,431373; etc.
TABLE 4.
Representation of the positive standard deviations 2.
Amino acids | Number of atoms | Standard deviation | Number of Aminoacids |
1 | 2 | 3 | 4 |
V | 19 | +0,568627 | 24 |
E | 19 | +0,568627 | 24 |
Q | 20 | +1,568627 | 18 |
IJSER © 2010 http://www.ijser.org
International Journal of Scientific & Engineering Research, Volume 1, Issue 2, November-2010 6
ISSN 2229-5518
H | 20 | +1,568627 | 12 |
I | 22 | +3,568627 | 24 |
L | 22 | +3,568627 | 30 |
F | 23 | +4,568627 | 12 |
Y | 24 | +5,568627 | 24 |
K | 24 | +5,568627 | 6 |
R | 26 | +7,568627 | 6 |
Sum | 219 | 180 |
DET 219, 180, 102, 126 = 9234; [9234 : (126+180)] = 30,17647;
9234 = (513 + 513… + 513)
A data set with a mean of 18,431373 and a standard deviation of 30,17647.
DET 7, 102, 10, 219 = 513; [513 : (7+10)] = 30,17647
DET 219, 180, 102, 126 = 9234 = (513+513+513…+ 513); [9234 : (126+180)] = 30,17647
Standard deviations: -30,17647, +30,17647, DET 30,17647
9234 = (962 + 18);
9234 = (513 x 18)
As we see, within the digital pictures in biochemistry, the physical and chemical parameters are in a strict compliance with programmatic, cybernetic and information principles. This can be seen from the following
examples:
IJSER © 2010 http://www.ijser.org
International Journal of Scientific & Engineering Research, Volume 1, Issue 2, November-2010 7
ISSN 2229-5518
The standard deviation is the most common measure of statistical dispersion in genetics, measuring how widely spread the values in a data set are. If many data points are close to the mean, then the standard deviation is small; if many data points are far from the mean, then the standard deviation is large. If all the data values are equal, then the standard deviation is zero.
X = Standard deviation
X = (5640:306) = 18,431373
TABLE 5.
Representation of the negative standard deviations 3.
Standard deviation (-)
Amino acids | Number of atoms | Standard deviation | Number of aminoacids | (2x4) | (3x4) |
1 | 2 | 3 | 4 | 5 | 6 |
G | 10 | -8,431373 | 24 | 240 | -202,352952 |
A | 13 | -5,431373 | 6 | 78 | -32,588238 |
C | 14 | -4,431372 | 36 | 504 | -159,529392 |
S | 14 | -4,431372 | 18 | 252 | -79,764696 |
T | 17 | -1,431373 | 18 | 306 | -25,764714 |
N | 17 | -1,431373 | 18 | 306 | -25,764714 |
P | 17 | -1,431373 | 6 | 102 | -8,588238 |
Sum | 102 | - | 126 | 1788 | -534,3529 |
(10-18,431373) = 8,431373; (13-18,431373) = 5,431373; etc.
TABLE 6.
Representation of the positive standard deviations 3.
Standard deviation (+)
Amino acids | Number of atoms | Standard deviation | Number of aminoacids | (2x4) | (3x4) |
1 | 2 | 3 | 4 | 5 | 6 |
V | 19 | +0,568627 | 24 | 456 | +13,647048 |
E | 19 | +0,568627 | 24 | 456 | +13,647048 |
Q | 20 | +1,568627 | 18 | 360 | +28,235286 |
H | 20 | +1,568627 | 12 | 240 | +18,823524 |
I | 22 | +3,568627 | 24 | 528 | +85,647048 |
L | 22 | +3,568627 | 30 | 660 | +107,05881 |
F | 23 | +4,568627 | 12 | 276 | +54,823524 |
Y | 24 | +5,568627 | 24 | 576 | +133,647048 |
K | 24 | +5,568627 | 6 | 144 | +33,411762 |
R | 26 | +7,568627 | 6 | 156 | +45,411762 |
Sum | 219 | 180 | 3852 | 534,3529 |
Table 5. and 6. Overview of negative and positive standard deviations for R6 insulin HEXAMER (d1ai02), showing some of the quantitative characteristc of the insulin molecule and the exact mathematical balance between its components. The values show some of the quantitative characteristics of the molecule of
insulin.
IJSER © 2010 http://www.ijser.org
International Journal of Scientific & Engineering Research, Volume 1, Issue 2, November-2010 8
ISSN 2229-5518
Standard deviation (-) = -534,3529
Standard deviation (+) =+534,3529
DET 126, 180, 1788, 3852 = 163 512; [163 512 : (126+180)] = 534,3529
Standard deviations: -534,3529, +534,3529,
DET 534,3529
Schematic representation of the negative and positive standard deviations 3 we will show in the fig.3.
Schematic representation of the negative and positive standard deviations 4 we will show in the fig.10. and 11.
X = Standard deviation
X = (5640:306) = 18,431373
TABLE 7.
Representation of the negative standard deviations 4.
Standard of deviation (-)
Amino acids | Number of atoms | Number of Aminoacids | (3x4) | Standard deviation (-) |
2 | 3 | 4 | 5 | 6 |
T | 17 | 18 | 306 | -25,764706 |
N | 17 | 18 | 306 | -25,764706 |
F | 23 | 12 | 276 | -55,764706 |
S | 14 | 18 | 252 | -79,764706 |
G | 10 | 24 | 240 | -91,764706 |
H | 20 | 12 | 240 | -91,764706 |
R | 26 | 6 | 156 | -175,764705 |
K | 24 | 6 | 144 | -187,764706 |
P | 17 | 6 | 102 | -229,764706 |
A | 13 | 6 | 78 | -253,764706 |
10 | 181 | 126 | 2100 | -1217,647059 |
TABLE 8.
IJSER © 2010 http://www.ijser.org
International Journal of Scientific & Engineering Research, Volume 1, Issue 2, November-2010 9
ISSN 2229-5518
Representation of the positive standard deviations 4.
Standard deviation (+)
Amino acids | Number of atoms | Number of Aminoacids | (3x4) | Standard deviation (+) |
2 | 3 | 4 | 5 | 7 |
Q | 20 | 18 | 360 | +28,235294 |
V | 19 | 24 | 456 | +124,235294 |
E | 19 | 24 | 456 | +124,235294 |
C | 14 | 36 | 504 | +172,235294 |
I | 22 | 24 | 528 | +196,235294 |
Y | 24 | 24 | 576 | +244,235294 |
L | 22 | 30 | 660 | +328,235294 |
7 | 140 | 180 | 3540 | +1217,647059 |
DET 10, 2100, 7, 3540 = 20 700; [20 700 : (10+7)] = 1217,647059;
Standard deviations: -1217,647059, +1217,647059, DET 1217,647059
Schematic representation of the negative and positive standard deviations 4 we will show in the fig.4.
In genetics standard deviation is a measure of difference for interval and ratio variables between the observed number of atoms (DNA, RNA, protein) and their position in the chains 1AI0. Example:
Position of amino acids in the chains 1AI0-(Rank) = 46971;
X = Standard deviation
X = (46971 : 17) = 2763;
TABLE 9.
Representation of the negative standard deviations 5.
Standard deviation (-)
Amino acids | Number of atoms | Rank | Standard deviation |
2 | 3 | 4 | 5 |
N | 17 | 2673 | -90 |
S | 14 | 2601 | -162 |
Q | 20 | 2565 | -198 |
F | 23 | 1932 | -831 |
H | 20 | 1872 | -891 |
P | 17 | 1059 | -1704 |
K | 24 | 1065 | -1698 |
R | 26 | 1023 | -1740 |
A | 13 | 975 | -1788 |
9 amino | 174 | 15765 | -9102 |
(10–18,882353) = -8,882353; (13 – 18,882353) = -5,882353; (14 – 18,882353) = -4,882353; etc.
IJSER © 2010 http://www.ijser.org
International Journal of Scientific & Engineering Research, Volume 1, Issue 2, November-2010 10
ISSN 2229-5518
TABLE 10.
Representation of the positive standard deviations 5.
Standard deviation (+)
Amino acids | Number of atoms | Rank | Standard deviation |
2 | 3 | 4 | 5 |
T | 17 | 2937 | +174 |
I | 22 | 3570 | +807 |
E | 19 | 3642 | +879 |
V | 19 | 3648 | +885 |
G | 10 | 3750 | +987 |
Y | 24 | 3762 | +999 |
L | 22 | 4635 | +1872 |
C | 14 | 5262 | +2499 |
8 amino | 147 | 31206 | +9102 |
Standard deviation = -9102
Standard deviation = +9102
In this example, there is a mathematical balance of the standard deviation 5.
DET 9, 15765, 8, 31206 = 154 734; [154 734 : (9+8)] = 9102;
Determinants = 9234, 513, 154734, 163512;
DET 9234, 513, 154734, 163512 = 1 430 491 266;
1430491266 = (513 + 513 + 513… + 513);
In this example there is also a mathematical balance between positive and negative values of the standard deviations. This balance is one of important quantitative characteristics of all processes in biochemistry. Each numerical value has its standard deviation. The research we carried out have shown that standard deviation are one of quantitative characteristics in biochemistry. Standard deviation is , actually, a discrete code that protects and guards genetic information coded in bio-chemical processes. This a recently discovered code, and more detailed knowledge on it is yet to be discovered.
From the previous examples we can see that this protein really has its quantitative characteristics. It can be concluded that there is a connection between quantitative characteristics in the process of transfer of genetic
information and the qualitative appearance of given genetic processes.
IJSER © 2010 http://www.ijser.org
International Journal of Scientific & Engineering Research, Volume 1, Issue 2, November-2010 11
ISSN 2229-5518
The results of our research show that the processes of sequencing the molecules are conditioned and arranged not only with chemical and biochemical lawfulness, but also with program, cybernetic and informational lawfulness too. At the first stage of our research we replaced nucleotides from the Amino Acid Code Matrix with numbers of the atoms and atomic numbers in those nucleotides. Translation of the biochemical language of these amino acids into a digital language may be very useful for developing new methods of predicting protein sub-cellular localization, membrane protein type, protein structure secondary prediction or any other protein attributes. Since the concept of Chou's pseudo amino acid composition was proposed [1-2], there have been many efforts to try to use various digital numbers to represent the 20 native amino acids in order to better reflect the sequence-order effects through the vehicle of pseudo amino acid composition. Some investigators used complexity measure factor [3], some used the values derived from the cellular automata [4-7], some used hydrophobic and/or hydrophilic values [8-16], some were through Fourier transform [17-18], and some used the physicochemical distance [19]. The author [34-42] is devoted to provide a digital code for each of 20 native amino acids. These digital codes should more complete and better reflect the essence of each of the 20 amino acids. Therefore, it might stimulate a series of future work by using the aut hor’s digital codes to formulate the pseudo amino acid composition for predicting protein structure class [20-22], subcellular location [23,24], membrane protein type [9,25], enzyme family class [26,27], GPCR type [28, 29], protease type [30], protein-protein interaction [31], metabolic pathways [32], protein quaternary structure [33], and other protein attributes. It is going to be possible to use a completely new strategy of research in genetics in the future. However, close observation of all these relationships, which are the outcomes of periodic laws (more specifically the law of binary coding), stereo-chemical and digital structure of proteins.
8
6
4
2
0
Series1
-2 Series2
-4
-6
-8
-10
1 2 3 4 5 6 7 8 9 10
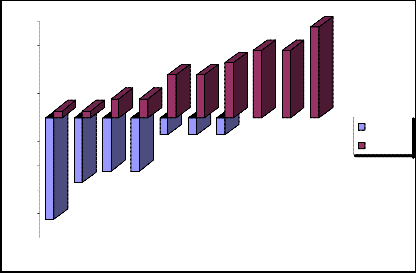
„Fig 2.“ Schematic representation of the negative and positive standard deviations 1
IJSER © 2010 http://www.ijser.org
International Journal of Scientific & Engineering Research, Volume 1, Issue 2, November-2010 12
ISSN 2229-5518
400
300
200
100
0
Series1
Series2
-100
-200
-300
1 2 3 4 5 6 7 8 9 10
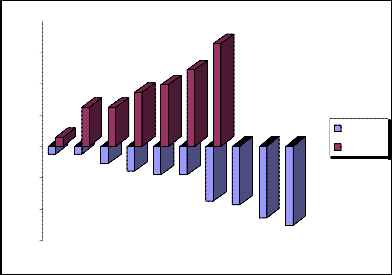
„Fig 3.“ Schematic representation of the negative and positive standard deviations 3.
400
300
200
100
0
Series1
Series2
-100
-200
-300
1 2 3 4 5 6 7 8 9 10
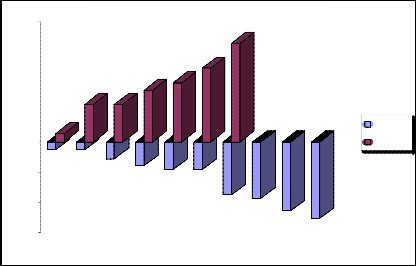
„Fig 4.“ Schematic representation of the negative and positive standard deviations 4.
[1] K.C. Chou, Gene Cloning & Expression Technologies, Chapter 4 (Weinrer, P.W., and Lu, Q., Eds.), Eaton Publishing, Westborough, MA (2002), pp. 57-70.
[2] K.C. Chou, Prediction of protein cellular attributes using pseudo amino acid composition PROTEINS: Structure, Function, and Genetics (Erratum: ibid., 2001, Vol.44,60) 43 (2001) 246-255.
[3] X. Xiao, S. Shao, Y. Ding, Z. Huang, Y. Huang, K. C. Chou, Using complexity measure factor to predict protein subcellular location, Amino Acids 28 (2005) 57-61.
[4] X. Xiao, S. Shao, Y. Ding, Z. Huang, X. Chen, K. C. Chou, Using cellular automata to
generate Image representation for biological sequences, Amino Acids 28 (2005) 29-35.
IJSER © 2010 http://www.ijser.org
International Journal of Scientific & Engineering Research, Volume 1, Issue 2, November-2010 13
ISSN 2229-5518
[5] X. Xiao, S. Shao, Y. Ding, Z. Huang, X. Chen, K. C. Chou, An Application of Gene Comparative Image for Predicting the Effect on Replication Ratio by HBV Virus Gene Missense Mutation, Journal of Theoretical Biology 235 (2005) 555-565.
[6] X. Xiao, S. H. Shao, Z. D. Huang, K. C. Chou, Using pseudo amino acid composition to predict protein structural classes: approached with complexity measure factor, Journal of Computational Chemistry 27 (2006) 478-482.
[7] X. Xiao, S. H. Shao, Y. S. Ding, Z. D. Huang, K. C. Chou, Using cellular automata
images and pseudo amino acid composition to predict protein sub-cellular location, Amino Acids 30 (2006) 49-54.
[8] K. C. Chou, Using amphiphilic pseudo amino acid composition to predict enzyme subfamily classes, Bioinformatics 21 (2005) 10-19.
[9] K. C. Chou, Y. D. Cai, Prediction of membrane protein types by incorporating
amphipathic effects, Journal of Chemical Information and Modeling 45 (2005) 407-413. [10] Z. P. Feng, Prediction of the subcellular location of prokaryotic proteins based on a
new representation of the amino acid composition, Biopolymers 58 (2001) 491-499. [11] Z. P. Feng, An overview on predicting the subcellular location of a protein, In Silico
Biol 2 (2002) 291-303.
[12] M. Wang, J. Yang, Z. J. Xu, K. C. Chou, SLLE for predicting membrane protein types, Journal of Theoretical Biology 232 (2005) 7-15.
[13] S. Q. Wang, J. Yang, K. C. Chou, Using stacked generalization to predict membrane protein types based on pseudo amino acid composition, Journal of Theoretical Biology, in press (2006) doi:10.1016/j.jtbi.2006.1005.1006.
[14] M. Wang, J. Yang, G. P. Liu, Z. J. Xu, K. C. Chou, Weighted-support vector machines
for predicting membrane protein types based on pseudo amino acid composition, Protein
Engineering, Design, and Selection 17 (2004) 509-516.
[15] S. W. Zhang, Q. Pan, H. C. Zhang, Z. C. Shao, J. Y. Shi, Prediction protein homo- oligomer types by pseudo amino acid composition: Approached with an improved feature extraction and naive Bayes feature fusion, Amino Acids 30 (2006) 461-468.
[16] Y. Gao, S. H. Shao, X. Xiao, Y. S. Ding, Y. S. Huang, Z. D. Huang, K. C. Chou, Using pseudo amino acid composition to predict protein subcellular location: approached with Lyapunov index, Bessel function, and Chebyshev filter, Amino Acids 28 (2005) 373-
376.
[17] Y. Z. Guo, M. Li, M. Lu, Z. Wen, K. Wang, G. Li, J. Wu, Classifying G protein- coupled receptors and nuclear receptors based on protein power spectrum from fast Fourier transform, Amino Acids 30 (2006) 397-402.
[18] H. Liu, M. Wang, K. C. Chou, Low-frequency Fourier spectrum for predicting membrane protein types, Biochem Biophys Res Commun 336 (2005) 737-739.
[19] K. C. Chou, Prediction of protein subcellular locations by incorporating quasi- sequence-order effect, Biochemical & Biophysical Research Communications 278 (2000) 477-483.
[20] K. C. Chou, A novel approach to predicting protein structural classes in a (20-1)-D
amino acid composition space, Proteins: Structure, Function & Genetics 21 (1995) 319-
344.
[21] K. C. Chou, C. T. Zhang, Predicting protein folding types by distance functions that make allowances for amino acid interactions, Journal of Biological Chemistry 269 (1994) 22014-22020.
[22] K. C. Chou, C. T. Zhang, Review: Prediction of protein structural classes, Critical
Reviews in Biochemistry and Molecular Biology 30 (1995) 275-349.
[23] K. C. Chou, D. W. Elrod, Protein subcellular location prediction, Protein Engineering
12 (1999) 107-118.
[24] K. C. Chou, Review: Prediction of protein structural classes and subcellular locations, Current Protein and Peptide Science 1 (2000) 171-208.
[25] K. C. Chou, D. W. Elrod, Prediction of membrane protein types and subcellular
locations, PROTEINS: Structure, Function, and Genetics 34 (1999) 137-153.
IJSER © 2010 http://www.ijser.org
International Journal of Scientific & Engineering Research, Volume 1, Issue 2, November-2010 14
ISSN 2229-5518
[26] K. C. Chou, D. W. Elrod, Prediction of enzyme family classes, Journal of Proteome
Research 2 (2003) 183-190.
[27] K. C. Chou, Y. D. Cai, Predicting enzyme family class in a hybridization space, Protein Science 13 (2004) 2857-2863.
[28] K. C. Chou, D. W. Elrod, Bioinformatical analysis of G-protein-coupled receptors, Journal of Proteome Research 1 (2002) 429-433.
[29] K. C. Chou, Prediction of G-protein-coupled receptor classes, Journal of Proteome
Research 4 (2005) 1413-1418.
[30] K. C. Chou, Y. D. Cai, Prediction of protease types in a hybridization space, Biochem.
Biophys. Res. Comm. 339 (2006) 1015-1020.
[31] K. C. Chou, Y. D. Cai, Predicting protein-protein interactions from sequences in a hybridization space, Journal of Proteome Research 5 (2006) 316-322.
[32] K. C. Chou, Y. D. Cai, W. Z. Zhong, Predicting networking couples for metabolic pathways of Arabidopsis, EXCLI Journal 5 (2006) 55-65.
[33] K. C. Chou, Y. D. Cai, Predicting protein quaternary structure by pseudo amino acid composition, PROTEINS: Structure, Function, and Genetics 53 (2003) 282-289.
[34] L.Kuric, The digital language of amino acids. Amino Acids (2007) 653-661.
[35] L.Kuric, The Atomic Genetic Code. J. Comput Sci Biol 2 (2009) 101-116.
[36] L.Kuric, Mesure complexe des caracteristiques dynamiques de series temporelles
“Journal de la Societe de statistique de Paris”- tome 127, No 2.1986.
[37] L.Kuric, The Insulin Bio Code - Zero Frenquencies, GJMR Vol. 10 Issue 1: 15 May
2010.
[38] L.Kuric, Molecular biocoding of insulin, Advances and Applications in Bioinformatics and Chemistry, Jul. 2010.p.45 – 58.
[39] L.Kuric, The Insulin Bio Code – Prima sequences, GJMR Vol. 1 Issue 1: 15 June
2010.
[40] L.Kuric, ATOMIC HEMOGLOBIN CODE, GJMR Volume 10 Issue 2, October 2010. [41] L.Kuric, Language of Insulin Decoded:Discret code 1128, IJPBS JOURNAL,
October 2010.
[42] L.Kuric, „Measures of Bio Insulin Frequencies“, IJCSET (Volume 1. Issue 4.
December, 2010)
IJSER © 2010 http://www.ijser.org