International Journal of Scientific & Engineering Research, Volume 6, Issue 1, January-2015 117
ISSN 2229-5518
Texture, rheological properties and microstructure of soy protein gels coagulated by CaSO4 and the effect of soybean soluble polysaccharide on the gel performance
Xiaofeng Xia, Mandour Abdalhai, Matabaro Emmanuel, He Qian*
Abstract—This study was performed to investigate the impact of SSPS (soy soluble polysaccharide) addition on the gel behavior of SPI (soy protein isolates) gels, CaSO 4 was applied as coagulant in this research. Soy protein gels with different SSPS addition were prepared and the Young’s modulus value, rheological properties, W HC (Water Holding Capacity), microstructure of which were also determined. The Young’s modulus and G’ max of gels decreased as the SSPS concentration increased from 0% to 1.25%. The core size of the gel microstructure increased and the W HC value decreased at this SSPS addition range. In addition, the viscosity of SPI-SSPS solvents increased as the SSPS addition improved from 0% to 1.25%, while the transparency of the solutions decreased in this duration.
Index Terms—SPI; SSPS; gel; CaSO4 ; gel strength
—————————— ——————————
contribute to its functionality (Li, Matsumoto, Nakamura,
1 INTRODUCTION
oya products have been consumed by Asian people as daily foods in the form of tofu or soymilk for more than
2000 years. Soybeans are a cheap and healthy protein source whose quality is high compared to that of milk or beef. [1]. Apart from traditional soya food products like soy milk, tofu, soy sauce and fermented tofu, non-traditional ones such as soy yogurt and soy cheese have attracted much attention because they contain lower saturated fats and cholesterol[2, 3]. Additionally, soy protein concentrates and soy protein isolates have long been used in food industry as food ingredients for their multiple functions such as emulsification, foaming, gelation, water and fat adsorption [4]. Many studies have been conducted on the gelation mechanism of soy protein. Generally, the gelation mechanism of soy protein involves two steps: First, soy protein is heated and denatured. This leads to the exposure of hydrophobic bonds located inside the native protein molecules. Secondly, different coagulates are added to stimulate gelation under incubation [5]. CaSO4 (ion coagulant) has been applied as a coagulant. Electrostatic charges are shielded by introducing Ca2+ leading to the reduction of the electrostatic repulsive forces and the formation of gel network. As divalent cation, calcium ions can further intensify protein aggregation by forming intermolecular calcium bridges [6].
SSPS is a dietary fiber extract from fibrous residue of soy products. As novel polysaccharides, it has attracted much attention from food researchers. SSPS has been classified as an

• Xiaofeng Xia is currently pursuing master degree program in Food Science in Jiangnan University, PR China. E-mail: victoriaxia1990@hotmail.com
• *He Qian is currently professor in Food Safety and Quality
Control in Jiangnan University, PR China. E-mail:
amtf168@126.com
acidic polysaccharide with covalently-attached peptides which
Maeda, & Matsumura, 2009). The structure of SSPS has homogalacturonan and rhamnogalacturonan as backbone with galactan and arabinan as branched chains [7]. The application of SSPS has not only served as dietary fiber added to fortified food but also as a stabilizer in oil-in water emulsions and protein-based acidic beverages. In emulsion system, the hydrophobic protein fraction linked to the high molecular weight fraction of SSPS attached to the oil/water interface acts as anchor for the SSPS chains. The hydrophilic carbohydrate moieties keep the emulsion particles from aggregating by steric repulsions [8]. At pH range 3 to 5.4, negatively charged SSPS adsorbs onto the positively charged soy proteins in solution due to electrostatic attraction. For acidic soya beverages, the sizes of protein particles are reduced because of the steric effects provided by the highly-branched sugar chain of SSPS [9]. However, the effect of SSPS addition on the gel behavior of SPI gels has not been reported yet. For this reason, the present study was conducted to identify the gel strength and microstructure of soy protein gels coagulated by CaSO4 and the effect of soybean soluble polysaccharide on the gel performance.
2 MATERIAL AND METHODS
2.1 Material
Low temperature defatted soy flour was purchased from Shandong Yuwang Industrial and commercial Co.Ltd. (Shandong, China). SSPS (CA-100) was kindly donated by Fuji Oil Ltd (Beijing, China) and commercial MTGase TG-B was provided by Yiming Biological Ltd (Taixing, Jiangsu, China) for free. All other chemicals of analytical grade were directly used with no further purification.
2.2 Preparation of SPI
SPI (soy protein isolate) was prepared according to methods described by Hua [10]. Resolved soy protein solution was freeze-dried with a freeze drier (model: Freezone 18L; Labconco, USA) and then grounded into powders, the protein
IJSER © 2015 http://www.ijser.org
International Journal of Scientific & Engineering Research, Volume 6, Issue 1, January-2015 118
ISSN 2229-5518
concentration of final product was 90.5% (determined by
Kjeldahl method, N×6.25).
2.3 Preparation of SPI gels
Solutions with 6% SPI concentration and different SSPS addition (0.00%, 0.25 %, 0.50%, 0.75%, 1.00%, 1.25%, w /w) were prepared as follows. The measured powders and water were added into a 250mL beaker and the mixture were stirred at room temperature for 2 hours, then the solutions were incubated at 4°C for overnight. The pH of all the solutions was adjusted to final pH 6.90 with 2M HCl before denaturation. The solution were incubated in 90°C water bath (Intelligent magnetic stirrer ZNCL-S, Yingyu equipment Co. Ltd, Gongyi, Henan, China) with stirring for 30min. Put the solution in ice water bath after denaturation till the temperature of which reached 20°C. CaSO4 (0.50%, w/w) was added as coagulants (optimum coagulants concentration were chosen according to previous experiments, results were not shown). They were mixed with the protein solution thoroughly with a magnetic stirrer (Meiyingpu equipment manufacturer Co. Ltd, Shanghai, China). The mixtures were incubated under 80°C for 30 min subsequently. After water bath, all the gels were moved to ice-bath till the temperature of which reached
the tangent of phase shift or phase angle (tan δ=G’’/G’) were also recorded.
Viscosity of SPI-SSPS solution were determined by using AR-G2 with a plate and cone geometry (cone diameter: 40mm, cone angle: 2°, gap: 54 micro meter, C2/40), the heat denatured solution were prepared following the instructions described in 2.3. The operation was handled under 25°C, a controlled shear rate ranging from 0 to 100(1/s) was selected [14].
2.6 Water holding capacity
Water holding capacity (WHC) was determined according to [14] with slight modification. Gels(40g per cup) with different treatments were measured into a 100mL centrifuge cup and centrifuged at 3000r/min for 30min at room temperature in Centrifuge 5804R (Eppendorf , Hamburg, Germany).The weight of cups with the gels were accurately measured before centrifugation. Followed by centrifugation, inverted the cup carefully to drain and removed the residual water with dry clean filter paper. The cups with gel samples were measured again with accuracy after this step and WHC was calculated according to the following equation:
= Wt − Wr ×
20°C.These gels were stored in 4°C refrigerator for 12 h before
working as samples for textual analysis, WHC measurement

WHC
Wt
100%
and SEM experiment.
2.4 Textual analysis
Gelatins test was conducted on TA-XT2 texture analyzer (Stable Micro Systems Co.Ltd., Godalming, Surrey, UK). Gels (30mm height, 40gram gel per beaker) were prepared according to the methods described in 2.3. Compression test were conducted using P/0.5 without moving the gels out of containers. The test speed, pre-test speed or post-test speed were 1.00mm/sec,10.00mm/sec, 10.00mm/sec respectively, and the penetration distance was 10mm (Liu, Chang, Li, & Tatsumi, 2004).The breaking strength and breaking time corresponding to the first peak were recorded, then Young’s modulus were calculated to characterize the gel strength: the higher the Young’s modulus, the higher the gel strength [12].
2.5 Rheology measurement
Gel formation was conducted by using AR-G2 (TA Instruments Ltd, New Castle, DE, USA) at a constant strain of
0.01 (within the linear viscos-elastic region) and an oscillation frequency of 1 Hz[13]. A parallel-plate geometry (diameter:
20mm, gap distance: 1000micro meter) was applied and a recirculating bath (Julaboza model ACW 100, Seelbath, Alemania) was connected to a Peltier plate working as a temperature control system. Protein solutions were prepared and denatured according to the method described at 2.3. Coagulants were mixed with denatured protein solvents
10secs before loading. The temperature cycles were programmed as follows. The temperature increased from 25
°C to 80 °C with a heating rate of 2 °C /min, and held on 80 °C for 15 min, then the temperature decreased from 80 to 25 °C at a cooling rate of 2 °C /min. Light silicone oil was used to cover the sample periphery during incubation to minimize moisture loss. The G’-G’’ crossover time (tgel ) was recorded and so did the gel temperature (T gel ). The maximum elastic modulus (G’max ), the maximum viscous modulus (G’’max ), and
Where Wt was total gram of water in gel sample and Wr was gram of water released.
2.7 SEM
Prepared soy protein gels were cut into small cubes (
1mm ×1mm × 3mm ) with a razor blade, fixed the cubes immediately by immersing them in freshly prepared 2.5%
(v/v) glutaraldehyde solution (prepared by 0.1M Phosphate Buffered Saline, pH7.2) under 4 °C for 12 hours. The samples were washed for four times subsequently with 0.1M Phosphate Buffered Saline (pH7.2) and every time for 10 min. Then dehydrated the samples by ethanol with increasing concentration(v/v)(30%,50%,70%,80%,90%,95%,100%,100%)
,10min for each concentration[15]. Samples were then transferred into 100% tertiary butanol, tertiary butanol was replaced three times and each duration for 10 min. Stored the samples immersing in 100% tertiary butanol under 4 °C for a few minutes until frozen, frozen samples were then removed to a freeze drier. After freeze drying, the samples were mounted on an aluminum sample plate with two sided carbon tabs and then coated the samples with a thin layer of gold (Noh, Park, Pak, Hong, & Yun, 2005). Specimens were analyzed by scanning electron microscope (model su1510; Hitachi Co., Japan). Magnification used for the test were 5000 for each samples.
2.8 Statistical analysis
All experiments except rheology test were made at least in triplicate for each sample. The experimental data were analyzed using the ANOVA and Duncan’s multiple range tests by the SPSS 20.0. Unless otherwise noted in the text, a P <
0.05 level was used where values were considered as being significantly different.
IJSER © 2015 http://www.ijser.org
International Journal of Scientific & Engineering Research, Volume 6, Issue 1, January-2015 119
ISSN 2229-5518
3 RESULTS AND DISCUSSION
3.1 Textual analysis
Table 1
Young’s modulus value, WHC value and rheological parameters for gels (SPI: 6%, w/w) coagulated by CaSO4 (0.5%, w/w) with various SSPS addition (0.00%, 0.25 %, 0.50%,
0.75%, 1.00%, 1.25%, w /w).
For Young’s modulus value and WHC value, data shown above are the average of three independent experiments with standard deviation. Within a column, different letters denote statistical difference at p<0.05.
Tables 1 gave a summary of the results obtained in this study on the Young’s modulus for gels coagulated by CaSO4 . The results showed that Young’s modulus decreased significantly (P<0.05) with increasing SSPS addition. The gels were weaker with higher SSPS addition, suggesting that the introduction of SSPS macromolecules may interrupt the formation of protein gel network. Furthermore, the gel strength decreased slowly from SSPS addition 0% to 0.75% and it decreased rapidly from
0.75% to 1.25%. When SSPS addition was 1.25%, the Young’s modulus value was 0.00 kPa. According to this result, perhaps when SSPS addition was 1% and 1.25%, micro-phase separation would have occurred in this system, leading to the barely formed gels.
Mixtures of 6% (w/w) SPI with 1.5% or 1.75% (w/w) SSPS
addition were also prepared according to the descriptions in
2.3, significant phase separation took place in both systems.
No gels could be formed with the treatment of CaSO4 (results not shown). Thus no further research was available for these treatments. The solutions with SSPS addition >1.25% showed
visible phase separation (the picture not shown) and could not form a gel. This means that 1.25% SSPS concentration was a critical concentration, and below this concentration SSPS-SPI can be co-soluble and behave like a monophasic dispersion while above this concentration visible phase separation occurred.
3.2 Rheology measurement
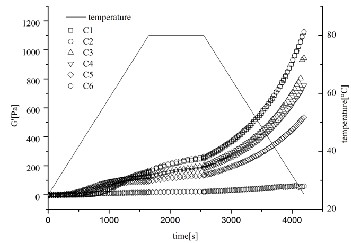
Fig. 1. Changes of elastic modulus (G’) and temperature of SPI-SSPS gels as a function of incubation time. CaSO4 (0.5%, w/w), SPI (6%, w/w), SSPS (0.00%, 0.25 %, 0.50%, 0.75%,
1.00%, 1.25%, w /w).
The gelation processes of samples treated by CaSO4 were shown in Fig. 1. G’ started to increase slowly after about 500s’
incubation and it increased sharply after nearly 2500s’ incubation. When the G’ value was sharply increasing during incubation, the gel network was under formation; when G’ value increased with increasing cooling time, then the gel network was under reinforcement [12]. When the G’ value of a material was higher, then a greater energy was needed to deform it, indicating that the material was harder [3].The results for G’max , G’’max , tan δ and tgel , T gel are shown in Table
1., G’max decreased as the SSPS addition increased from 0% to
1.25%, indicating that the gel hardness decreased in this
duration, which correlated with the results of Young’s
modulus. G’max decreased in a much smaller amount when SSPS addition increased from 0% to 0.75% than SSPS addition ranging from 0.75% to 1.25%. This also correlated with the results obtained in Young’s modulus. G’’max showed exactly
the same tendency with G’max . Tan δ decreased slowly from
SSPS addition 0% to 1.25%, demonstrating that the gel showed
less elastic character and more viscous character with higher
SSPS concentration. T gel and tgel decreased when SSPS addition increased from 0% to 1% and increased when SSPS addition
increased from 1% to 1.25%. As results shown in Fig. 2, the particle size of SPI-SSPS solution increased when SSPS addition increased from 0% to 1.25%, suggesting that bigger aggregates were formed with higher SSPS concentration. After adding coagulants, the aggregates were formed or grew; aggregates in SPI-SSPS solvents with higher SSPS concentration could be big enough to initiate a gel network within a shorter time leading to a lower tgel and T gel (Schuldt, Raak, Jaros, & Rohm, 2014).
IJSER © 2015 http://www.ijser.org
International Journal of Scientific & Engineering Research, Volume 6, Issue 1, January-2015 120
ISSN 2229-5518
3.3 Viscosity

Fig. 2 Viscosity of heat-denatured SPI-SSPS mixtures: SPI (6%, w/w), SSPS (0.00%, 0.25 %, 0.50%, 0.75%, 1.00%, 1.25%, w /w) The viscosity of solutions with different treatment was shown in Fig. 2.The viscosity of SPI-SSPS mixtures increased as the SSPS concentration increased. The occurrence of phase separation can contribute to the increased viscosity. When the SSPS addition in the mixtures exceeded a critical contents, a depletion effect resulted in a stronger attraction between the protein aggregations and a larger volume of protein microgel particles led to phase separation and thus increased the viscosity of the mixtures [18].
Pictures for each solutions were also displayed in Figure
2.The solution with no SSPS addition (Fig. 2(0%)) was
transparent and the solution with SSPS addition 1.25% (Fig.e
2(1.25%)) was totally opaque. It can also be clearly noticed that
solutions with higher SSPS addition were less translucent,
indicating that aggregates with larger sizes or bigger amount
were formed with increasing SSPS addition. This could be the
result of expanding protein aggregates and protein microgel particles size caused by increased SSPS addition described above. And the bigger particle size led to the increasing viscous of SPI-SSPS mixtures. According to Figure.2, SPI-SSPS
mixtures turned opaque when SSPS addition was 1% and became milky when SSPS concentration was 1.25%. Microphase separation might have occurred in these two concentrations, which can explain the significantly lower gel strength. On the other hand, SPI-SSPS aggregates with bigger sizes might expose less surface hydrophobic and free SH groups leading to the decrease of the extent of protein aggregation, i.e. a weaker gel [12]. This was in agreement with the results shown above: with increasing SSPS addition, the gel strength, G’max and tan δ of gels decreased. With less space-filling network formed by protein aggregates, the core sizes in the microstructure of gels with more SSPS addition increased (results shown in Fig.3) [15].
3.4 Water holding capacity (WHC)
WHC was important attribute of food products especially for gels. WHC is the ability to hold moisture and other juices in the food both before and after treatments. Results for WHC of gels were shown in Table 1. The lower WHC may be a result of increasing protein solubility with fewer proteins which took
part in gelation. Thus gels with a lower WHC usually showed a lower gel strength [12]. In general, WHC decreased with the increasing SSPS addition. The WHC dropped by 9.66% as SSPS addition increased from 0% to 0.75%.The WHC of gels dropped much more when SSPS addition increased from
0.75% to 1.25%, and the value was 11.458%. According to the results of WHC, for gels with more SSPS addition, less soy protein took part in the gel formation and weaker gels were formed. And much less soy proteins participate in the gelation process when SSPS concentration exceeded 0.75%, leading to fragile gels reported in 3.1 and 3.2. As shown in Figure 3, the gels with higher WHC had a smaller pore size and a more uniform gel structure. Especially for gels whose SSPS additions were 1% or 1.25%,their WHC were much lower than other treatments, and their pore size are also much bigger than other gels.
3.5 SEM
Fig.3. SEM images of SPI-SSPS gels coagulated by CaSO4 (0.5%, w/w) with SPI concentration 6% (w/w): a, SSPS: 0.00%, w /w; b, SSPS: 0.25 %, w /w; c, SSPS: 0.50%, w /w; d, SSPS:
0.75%, w /w; e, SSPS: 1.00%, w /w; f, SSPS: 1.25%, w /w.
Soy protein gels prepared by different treatment were
studied by SEM and the results are available in Fig. 3. Overall,
the pore sizes were bigger when the SSPS addition was higher.
Gels with dense and uniform microstructure can bind more
water resulting in a higher WHC [19]. These findings
correlated with the result of WHC very well.
Gels treated with CaSO4 showed uniform three-dimensional network when SSPS addition increased from 0% to 0.5% while the pore sizes increased with increasing SSPS concentration.
The pore size of the gel was much bigger when its SSPS addition was 0.75%, the gel network was not uniform with bigger aggregates. The gels whose SSPS addition was 1% showed the biggest pore size with large aggregates. Gels with SSPS concentration 1.25% were so fragile that we failed to prepare SEM sample for this treatment. Solutions with bigger particle size diameter would lead to gels with bigger aggregates and bigger holes in gel micro structure and also gels with lower WHC. Results got from 3.3 can explain the SEM image very well. Higher WHC and bigger core size of gels with higher SSPS addition suggested that more protein dissolving in water bounded in the holes while less protein took part in gelation, as a result the gel strength decreased[20]. This can explain why gels with higher SSPS addition got the less gel strength.
IJSER © 2015 http://www.ijser.org
International Journal of Scientific & Engineering Research, Volume 6, Issue 1, January-2015 121
ISSN 2229-5518
Additionally, proteins are dragging with them a part of the polysaccharide molecules for reason of electroneutrality; the ionic strength overcame electrostatic repulsion between proteins by creating a shield effect and favoring the co-solubility [18].Therefore, as SSPS addition increased, more SPI-SSPS aggregates dissolved in water leaving less SPI forming the gels, leading to a weaker gel. As a consequence, the introduction of SSPS can weaken SPI gels.
4 CONCLUSION:
In this study SSPS addition on the gel behavior of SPI gels coagulated CaSO4 was explored. For this purpose, textual analysis, rheology analysis, WHC measurement and SEM measurement were performed. By increasing SSPS addition, gels coagulated by CaSO4 showed lower gel strength with less elastic performance. The increasing SSPS addition led to bigger particle size in SPI-SSPS mixture, bigger aggregates causing less hydrophobic regions exposed in surface. Suggesting with increasing SSPS addition, less SPI aggregates were formed because of less hydrophobic regions, resulted in gels with less gel strength. Furthermore, the introduction of Ca2+ neutralized the protein molecular, leading to the formation of co-soluble SPI-SSPS aggregates. As SSPS addition improved, less soy protein took part in the gelation process and more SPI-SSPS co-solvents dissolved in water. As a result, the gels became weaker with lower WHC and looser gel structure.
6 REFERENCE
[1] Fukushima, D., 8 - Soy proteins, in Handbook of Food Proteins, G.O.
Phillips and P.A. Williams, Editors. 2011, Woodhead Publishing. p.
210-232.
[2] Cruz, N.S., et al., Soymilk treated by ultra high-pressure homogenization: Acid coagulation properties and characteristics of a soy-yogurt product. Food Hydrocolloids, 2009. 23(2): p. 490-496.
[3] Rinaldoni, A.N., et al., Soft cheese-like product development
enriched with soy protein concentrates. LWT - Food Science and
Technology, 2014. 55(1): p. 139-147.
[4] Nakamura, A., et al., Emulsifying properties of soybean soluble polysaccharide. Food Hydrocolloids, 2004. 18(5): p. 795-803.
[5] Nishinari, K., et al., Soy proteins: A review on composition, aggregation and emulsification. Food Hydrocolloids, 2014. 39(0): p.
301-318.
[6] Kohyama, K., Y. Sano, and E. Doi, Rheological Characteristics and Gelation Mechanism of Tofu (Soybean Curd). Journal of Agricultural and Food Chemistry, 1995. 43(7): p. 1808-1812.
[7] Nakamura, A., et al., Structural Studies by Stepwise Enzymatic Degradation of the Main Backbone of Soybean Soluble Polysaccharides Consisting of Galacturonan and Rhamnogalacturonan. Bioscience, Biotechnology, and Biochemistry,
2002. 66(6): p. 1301-1313.
[8] Tajik, S., et al., Soluble soybean polysaccharide: A new carbohydrate to make a biodegradable film for sustainable green packaging. Carbohydrate Polymers, 2013. 97(2): p. 817-824.
[9] Tran, T. and D. Rousseau, Stabilization of acidic soy protein-based dispersions and emulsions by soy soluble polysaccharides. Food
Hydrocolloids, 2013. 30(1): p. 382-392.
[10] Hua, Y., et al., Heat induced gelling properties of soy protein isolates prepared from different defatted soybean flours. Food Research International, 2005. 38(4): p. 377-385.
[11. Liu, Z.-S., et al., Effect of selective thermal denaturation of soybean proteins on soymilk viscosity and tofu's physical properties. Food Research International, 2004. 37(8): p. 815-822.
[12] Hu, H., et al., Acid-induced gelation behavior of soybean protein isolate with high intensity ultrasonic pre-treatments. Ultrasonics Sonochemistry, 2013. 20(1): p. 187-195.
[13] Ingrassia, R., et al., Application of a digital image procedure to evaluate microstructure of caseinate and soy protein acid gels. LWT - Food Science and Technology, 2013. 53(1): p. 120-127.
[14. Campbell, L.J., et al., Effects of heat treatment and glucono-δ
-lactone-induced acidification on characteristics of soy
protein isolate. Food Hydrocolloids, 2009. 23(2): p.
344-351.
[15] Qinghui, L., et al., Evaluation of the rheological, textural, microstructural and sensory properties of soy cheese spreads. Food & Bioproducts Processing: Transactions of the Institution of Chemical Engineers Part C, 2013. 91(4): p. 429-439.
[16] Noh, E.J., et al., Coagulation of soymilk and quality of tofu as affected by freeze treatment of soybeans. Food Chemistry, 2005.
91(4): p. 715-721.
[17] Schuldt, S., et al., Acid-induced formation of soy protein gels in the presence of NaCl. LWT - Food Science and Technology, 2014. 57(2): p. 634-639.
[18] Musampa, R.M., M.M. Alves, and J.M. Maia, Phase separation, rheology and microstructure of pea protein–kappa-carrageenan mixtures. Food Hydrocolloids, 2007. 21(1): p. 92-99.
[19] TODA, Y.O.T.O.K.N.K., Homogeneity and Microstructure of Tofu Depends on 11S/7S Globulin Ratio in Soymilk and Coagulant Concentration. Food Science and Technology Research, 2009. 15(3): p.
10.
[20] Ringgenberg, E., M. Alexander, and M. Corredig, Effect of concentration and incubation temperature on the acid induced aggregation of soymilk. Food Hydrocolloids, 2013. 30(1): p. 463-469.
IJSER © 2015 http://www.ijser.org