The research paper published by IJSER journal is about Superconducting Properties of Melt-Quenched Bi1.6 Pb0.4Sr2Can-1CunOy Superconductor 1
ISSN 2229-5518
Superconducting Properties of Melt-Quenched
Bi1.6 Pb0.4Sr2Can-1CunOy Superconductor
Shirley T. Palisoc and Ma. Cecilia A. del Mundo
Pb0.4Sr2Can-1CunOy ceramics are examined. The samples were fabricated via the melt quench method. The copper content with n=3.5 revealed to have the highest percentage of high Tc peaks. The low Tc phase was predominant in all samples. There is no observable trend on the effect of
variation in pelletizing pressure on both high Tc and low Tc phases of the samples .
—————————— ——————————
large variety of techniques have been developed and applied for the fabrication of high Tc Superconductors [1]. Among these are the alkoxide route, citrate gel process, coprecipitation technique, combustion method, freeze drying, floating zone method, solgel, solid state reaction method and the melt quench method. In the melt quench method, the raw materials are melted above the melting point and then rapidly quenched to room
temperature.
Of the various potentially useful materials only the
bismuth containing ones such as the Bi2Sr2Ca3Cu3Oy, and related compounds [2,3] can be prepared by quenching from the molten state, which typically requires the melt to be heated to 100 to 200°C above the melting point. One of the benefits of the melt quench technique is that the glass resulting from a high quenching rate is necessarily chemically homogeneous and it is possible to obtain different shapes and forms after melt quenching which may be useful to wire and tape production.
This paper presents the effects of varying the copper content and pelletizing pressure on the superconducting properties of Bi1.6 Pb0.4Sr2Can-1CunOy ceramics prepared by the melt quench method.
2 Procedure
The atomic ratio of Bi:Pb:Sr:Ca:Cu was controlled to
1:6:0.4:2:n-1:n, where n ranges from 2 to 4 with an interval of
0.5. Appropriate amounts of the raw materials of Bi2O3, PbO, SrCO3 CaCO3 and CuO were weighed to adjust the final composition. The weighed materials were mixed thoroughly in an agate mortar and pestle for 30 minutes. The mixture was melted in alundum crucibles. The approximate temperature in which melting was expected to occur is 1080°C. The liquefied material was removed from the furnace and was immediately poured on a stainless steel plate. After quenching, the sample was ground with an agate mortar and pestle. from the total quantity of the ground material, amounts of 4 grams were weighed and were pelletized. The pelletizing force was varied from 2 to 8 tons with an interval of 2 tons. Each pellet measured 2 cm in diameter and 0.25 cm in thickness. The pellets were then placed in alundum boats and were sintered for 24 hours at a constant temperature of
840°C. The samples were characterized by XRD.
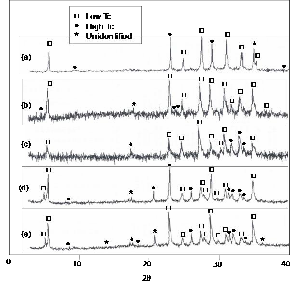
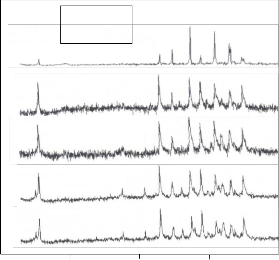
Figure 1 shows the XRD patterns of the samples subjected to a pelletizing force of 2 tons. It can be observed that the low Tc phase is predominant in all the samples. Figure 2 shows the graph of the percentage peaks versus copper content of the samples subjected to a pelletizing force of 2 tons. It can be observed that the sample with copper content n=3contains the highest low Tc percentage and the sample with copper content n=3.5 contains the highest high Tc percentage. The sample with copper content n=4 contains the highest percentage of unidentified peaks.
————————————————
Ma. Cecilia A. del Mundo is a graduate of De La Salle University, Manila.
IJSER © 2012
http://www.ijser.org
The research paper published by IJSER journal is about Superconducting Properties of Melt-Quenched Bi1.6 Pb0.4Sr2Can-1CunOy Superconductor 2
ISSN 2229-5518
Fig. 1 XRD patterns of samples subjected to pelletizing force of 2 tons and copper content (a) n=2, (b) n=2.5, (c) n=3, (d) n=3.5, and (e) n=4
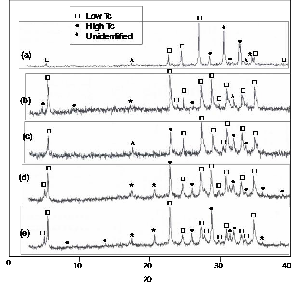
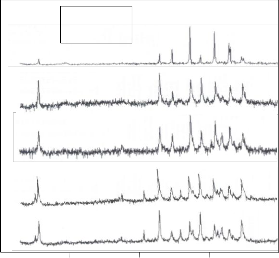
Fig. 3 XRD patterns of samples subjected to pelletizing force of 4 tons and copper content (a) n=2, (b) n=2.5, (c) n=3, (d) n=3.5, and (e) n=4
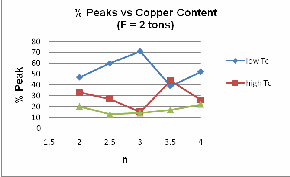
Fig 2. Graph of percentage peaks vs. copper content of samples subjected to a pelletizing force of 2 tons
Figures 3 and 4 show the XRD patterns and the graph of the percentage peaks versus the copper content, respectively, of the samples subjected to a pelletizing force of 4 tons. It can be seen from the graph that the sample with copper content n=2.5 contains the highest low Tc percentage and the sample with copper content n=3.5 contains the highest high Tc percentage. The samples with copper content n=2 and n=4 contain the highest percentage of unidentified peaks.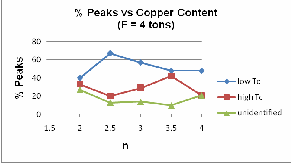
Fig 4. Graph of percentage peaks vs. copper content of samples subjected to a pelletizing force of 4 tons
Figures 5 and 6 show the xrd patterns and the graph of the percentage peaks versus copper content, rexpectively, of the samples subjected to a pelletizing force of 6 tons. The sample with copper content n=2.5 contains the highest low Tc percentage and the sample with copper content n=3.5 contains the highest high Tc percentage. The samples with copper content n=2 and n=4 contain the highest percentage of unidentified peaks.
IJSER © 2012
http://www.ijser.org
The research paper published by IJSER journal is about Superconducting Properties of Melt-Quenched Bi1.6 Pb0.4Sr2Can-1CunOy Superconductor 3
ISSN 2229-5518
Low Tc
High Tc
Low Tc
High Tc
Un iden tified
Un iden tified
(a)
(a)
(b)
(b)
(c)
(c)
(d)
(d)
(e)
(e)
0 10 20 30 40
2
0 10 20 30 40
2
Fig. 5 XRD patterns of samples subjected to pelletizing force of 8 tons and copper content (a) n=2, (b) n=2.5, (c) n=3, (d) n=3.5, and (e) n=4
Fig. 7 XRD patterns of samples subjected to pelletizing force of 8 tons and copper content (a) n=2, (b) n=2.5, (c) n=3, (d) n=3.5, and (e) n=4
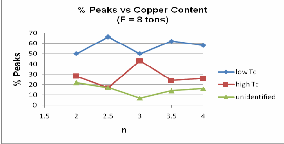
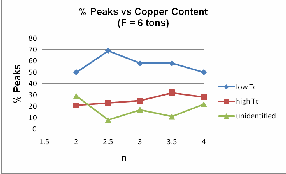
Fig 6. Graph of percentage peaks vs. copper content of samples subjected to a pelletizing force of 6 tons
Figures 7 and 8 show the XRD patterns and the graph of the percentage peaks versus copper content, respectively, of samples subjected to a pelletizing force of 8 tons. The sample with copper content n=2.5 contains the highest low Tc percentage while the sample with copper content n=3 contains the highest high Tc percentage. The sample with copper content n=2 contain the highest percentage of unidentified peaks.
Fig 8. Graph of percentage peaks vs. copper content of samples subjected to a pelletizing force of 8 tons
In summary, most of the samples with copper content n=3.5 obtained the highest percentage of high Tc peaks while most of the samples with copper content n=2.5 obtained the highest percentage of low Tc peaks.
The variation of the pelletizing force does not show any particular characteristic trend with regards to the amount of high Tc peaks in the samples. This may be due to the use of the melt quench method which already yields a dense material even without pressing.
The use of the melt quench method on the fabrication of Bi1.6 Pb0.4Sr2Can-1CunOy ceramics, yielded samples with both low Tc and high Tc peaks. The XRD patterns of the samples showed that the low Tc phase is predominant in all the samples. Most
IJSER © 2012
http://www.ijser.org
The research paper published by IJSER journal is about Superconducting Properties of Melt-Quenched Bi1.6 Pb0.4Sr2Can-1CunOy Superconductor 4
ISSN 2229-5518
of the samples with copper content n=2.5 contain the most number of low Tc peaks. Most of the sample with copper
content n=3.5 contain the highest percentage of high Tc peaks.
There is no observable trend, however, on the effect of variation in pelletizing pressure on the high Tc phase and low Tc phase of the samples.
[1] S. Jin and J.E. Graebner, Mater.Sci. Eng. B7, 243 (1991).
[2] H. Maeda, Y. Tanaka, M. Fukutomi, and T. Asano, Jpn. J. Appl.
Phys. 27, L209 (1988).
[3] J.L. Tallon, R.G. Buckley, P.W. Gilberd, M.R. Presland, I.W.M.
Brown, M.E. Bowden, L.A. Christian, and R. Goguel, Nature 333,
153 (1988).
IJSER © 2012
http://www.ijser.org