International Journal of Scientific & Engineering Research, Volume 4, Issue 9, September-2013 2112
ISSN 2229-5518
Sunspot Number and Severe
Thunderstorms of Kolkata,India
Himadri Chakrabarty and Anustup Chakraborty
Abstract- Severe thunderstorm is a mesoscale atmospheric event. Subsequent relations may be drawn between mesoscale thunderstorms and other terrestrial and extra-terrestrial parameters. In this article, our focus is to establish a possible connection between the average sunspot number and thunderstorm occurrences in Kolkata, North-East India. Pearson’s correlation coefficient method and hypothesis testing techniques have been applied in this research work.. Authenticated data have been collected and statistical operations were performed on them. The results were found to yield a very promising relation between the two variables with a high degree of articulation and accuracy.
Index Terms: Severe thunderstorm, Sunspot number, Correlation Coefficient, mesoscale, universal feature, hypothesis testing.
![]()
------------------------ ----- ----------------------------
The Sunspots are cooler and darker regions on the Sun's photosphere comparing to the surrounding regions, [1]. The number of sunspots that can be seen on the surface of the sun increases and decreases in a regular pattern known as a solar cycle with a maximum number of sunspots occurring every 11.5 years, [1].
Scientists track solar cycles by counting sunspots, [2]. The Wolf number (also known as the International sunspot number, or Zürich number) is a quantity that measures the number of sunspots and groups of sunspots present on the surface of the sun, [2]. Sunspots appear as dark spots on the surface of the sun, [2]. Temperatures in the dark centers of sunspots drop to about 3700 K (compared to 5700 K for the surrounding photosphere). They typically last for several days, although typically large ones may live for several weeks, [2].![]()
H. Chakrabarty is currently an Associate Professor in Dept. of Computer Science, Surendranath College, University of Calcutta, Kolkata, India, PH-919433355720, E-mail:hima.c@rediffmail.com
A. Chakraborty is currently a student of Electronics Engineering in West Bengal University of Technology, Kolkata, India, PH-9007864497, E-mail: anua.unique@gmail.com
Sunspots usually appear in pairs of spots, which are magnetic regions on the Sun with magnetic field strengths thousands of times stronger than the Earth's magnetic field, [2]. One spot of the pair will have positive or north magnetic field while the other spot will have negative or south magnetic field. The field is strongest in the darker parts of the sunspots - the umbra. The field is weaker and more horizontal in the lighter parts - the penumbra, [2].
A solar flare is a sudden brightening in an active region usually near a complex group of sunspots of the photosphere, which produces immediate increases in the ionospheric ionization of varying degrees at different heights, together called the Sudden Ionospheric Disturbances (SIDs) or the ionospheric solar flare effects, [2]. The disturbances have important effects on radio communications and navigations over the entire radio spectrum, [2]. The space weather changes are known to influence some of the tropospheric parameters, [3]. On the other hand, the tropospheric disturbances are known to influence the ionospheric parameters, [3]. Solar activities, in particular solar flares, have important influences on geophysics, including the middle atmosphere, thunderstorms, sudden ionospheric disturbances etc., [3]. Thunderstorms are associated with thunder, lightning, and high
IJSER © 2013 http://www.ijser.org
International Journal of Scientific & Engineering Research, Volume 4, Issue 9, September-2013 2113
ISSN 2229-5518
wind speed known as squall (speed of 45kmph or more having at least 1 minute duration).
Thunderstorms are also the phenomena of atmospheric electricity. In order to find out the physical mechanism of the correlations between solar activities and meteorological phenomena, one of the most possible ways is to study atmospheric electricity, [4]. The scenario seems to be that the high energy particles, UV and X-rays emitted by solar flares may be transported to the lower atmosphere of the Earth and may affect the environment of atmospheric electricity, whose properties may affect the formation of thunderstorms and then in turn affect the annual precipitation and other related meteorological phenomena, [4]. Some authors (Zhang and Lu, Middle Atmosphere Program, 29,179, 1989) have pointed out the obvious influence of solar flares on thunderstorms in China, [4]. But the evidence is still localized and isolated. So it is very necessary to carry out a comprehensive study about the effects of solar flares on the thunderstorms elsewhere on Earth, [4]. A small portion of that most interesting field of research was dealt with in [5]. It can be admitted that a connection between solar activity and thunderstorm phenomena exists, [5]. In the first place, so far as has been observed at present extent, it is quite impossible to find a distinct relation of time between prevalence of thunderstorms over our planet and solar periodicities. In the second place, thunderstorms have been classified, and much require further classification, [5].
Variations in solar irradiance are recognized as a fundamental forcing factor in the climate system, [6]. Neto et al., 2013 [7] has cited that although the solar irradiance varies by about 0.1% over the
11-year solar cycle, persistent claims have been made of 11-year signals in various meteorological time series, eg. sea surface temperature [8] and cloudiness over North America, [9]. Brooks, 1934, [10] and Rycroft et al.,
2000 [11] concluded that despite efforts since the beginning of the nineteenth century to establish a connection between solar activity and thunderstorm activity, this relationship has not been fully understood yet. Fritz (1878) [12] was one of the first scientists to investigate the long- term variability of thunder day data in association with solar activity. He used thunderstorm frequencies from Europe and North-America between 1755 and 1875 and
correlated them with relative sunspot numbers. The results were not conclusive. At some stations
he found a positive correlation, at others a negative one. Brooks, 1934, [10] made a very comprehensive study of the variation of the annual frequency of thunderstorms in relation to sunspots. Septer (1926), [13] made an analysis for Siberia and found a high (0.88) in-phase correlation of the thunderstorm variations and the relative sunspot number. After analyzing a large number of stations in many different places (almost all outside the tropics), Brooks, [10] found a large variation in the correlation of thunderstorm variations and relative sunspot number (R varying from −0.16 to 0.36) and of phase difference of thunderstorm activity and sunspots (in 72% of the cases there were an in- phase correlation and in 28% an anti-phase correlation). Neto et al., 2013, [7] has cited that Myrbach, [14] in 1935 used a 124-year series of annual thunder day observations in Austria to investigate the relationship of thunderstorm activity and solar activity. He concluded that they were anti-phase correlated with the maximum in the thunder day data occurring just after the solar minimum and its minimum coinciding with the solar maximum. After that, controversial results have been reported indicating in-phase or anti-phase correlations, although there is no basis to expect that the relationship between thunderstorms and solar activities would be identical for all regions, [15]. Kleymenova in 1967, [15] has reported a global analysis of the relationship between thunderstorm and solar activity at different locations, indicating that in some regions the thunderstorm activity varied in anti-phase with the solar activity, while in others it varied in phase. For example, he found that the thunderstorm activity in North America showed a pronounced anti-phase dependence on solar activity. All over Africa, there was also an anti- phase pattern. Only in China and Germany the number of thunder days varied in phase with the solar activity, although the periods under consideration for these countries were short (about one solar cycle). Kleymenova [15] also revised the results of Septer [13] for Siberia and found that his conclusion about the phase behavior was incorrect and concluded that, in general, there was an anti-phase relationship between thunderstorm and solar activities, in agreement with the conclusions obtained previously by Myrbach (1935), [14], Sen (1963),
IJSER © 2013 http://www.ijser.org
International Journal of Scientific & Engineering Research, Volume 4, Issue 9, September-2013 2114
ISSN 2229-5518
[16] and Egeland et al. (1965), [17]. Another interesting result was obtained by Aniol (1952),
[18], who studied the mean thunderstorm frequency in southern Germany between 1881 and 1950 and its relation to relative sunspot number. He found an insignificant correlation coefficient of −0.02 between both quantities for the whole record. However, when the thunder day data were analyzed for different periods, a change in the correlation sign was evident around 1920; for the years 1889–1913 the correlation coefficient was −0.55, while for the period 1923–1944 it was 0.74. This result suggests that the relationship between thunderstorm and solar activities may change with time. Stringfellow in 1974, [19] reported a significant positive correlation between an index for the mean lightning incidence in Britain and sunspot number between 1930 and 1973 with a correlation coefficient of 0.8, in contrast what was found by Brooks (1934) for the same location, also suggesting that the phase behaviour may change with time, [7]. Neto et al, [7] has cited that Schlegel et al. in 2001, [20] marked a difference in the correlation of lightning data obtained by lightning location systems with solar activity in Germany and Austria. Schlegel et al. (2001) concluded from previous studies that (i) an influence of solar activity on thunderstorms could not be convincingly established so far, (ii) the correlation coefficient between solar activity and thunderstorm/lightning frequency varies with the location of the observing station on Earth, and (iii) it may change its sign over time scales of a few decades. Additionally, Neto et al. [7] also cited that Girish and Eapen (2008), [21] found from a study of thunder/lightning observations in Trivandrum an inverse relation of the same with sunspot activity for selected years between 1853 and 2005. They suggested that lightning-associated modulation of the E- region dynamo currents in the equatorial ionosphere acts as a moderator to regulate electric potential gradient changes in the global electric circuit due to solar activity changes. Also, Singh et al. (2013) found an apparent inverse relation of the lightning data (obtained from TRMM satellite) with sunspot activity for the period from 1998 to 2010 in India, [22].
The month-wise data of the sunspot number for 41 years from 1969 to 2009 were obtained from NOAA website. The data of thunderstorms associated with squall for the same time period were collected from India Meteorological Department, Govt. of India. Here also, the monthly frequency of the severe local storms occurring in Kolkata, in the pre-monsoon season each year were procured. The pre-monsoon season consists of the months of March, April and May (MAM) in India. The weather station Kolkata is situated at 88.3°E/ 22.3°N near Bay of Bengal in North-East India.
The sunspot numbers for each of the months of March, April and May were taken for analysis in this work. The average sunspot numbers of these three months are calculated for each of the year within the period 1969 to 2009. The total number of severe storms occurring in Kolkata within the months of March, April and May during the same time period of
41 years from 1969 to 2009 are considered for analysis. Thus the correlation between sunspot number and total number of storm occurrences in each year within a period of 41 years ranging from 1969-
2009 have been calculated.
The tools used for the analysis of the correlation between thunderstorms and sunspot number are (a)correlation coefficient and (b)hypothesis testing.
It describes the relationship between two variables.Positive correlation generally indicates that if one variable increases(or decreases), the other also increases(or decreases).Negative correlation indicates that if one variable increases(or decreases), the other decreases(or increases).The value of correlation coefficient lies in between -1 and +1.Correlation of +1 indicates that the values of the two variables fall on a straight line with positive slope. Correlation -1 indicates that the values of the two variables fall on a straight line with negative slope.
IJSER © 2013 http://www.ijser.org
International Journal of Scientific & Engineering Research, Volume 4, Issue 9, September-2013 2115
ISSN 2229-5518
Let
( xi , yi ); i = 1,..., n be the given two
We have considered the level of significance
n α = 0.05 . The tabulated values of t distribution
dimensional data. Let
x = (∑ xi ) / n and
for degrees of freedom (n-2) and for the level of
i =1
significance
α = 0.05
are found from the
n statistical tables, [23]. If the tabulated value
y = (∑ yi ) / n . Then, the sample variance of X,
i =1
![]()
![]()
exceeds T then
H 0 is accepted, otherwise H 0
denoted by var(X), is defined as![]()
2
is rejected. If H 0 is rejected, then the population correlation coefficient is significantly different
var( X ) = (∑ ( xi − x)
) / n , sample variance
from 0, indicating relationship between the
of Y, denoted by var(Y), is defined as
respective variables. The relation then is referred
n as `significant positive’ (if
r > 0 ) or ‘significant
var(Y ) = (∑ ( yi − y)
i =1
) / n , and the sample
negative’ (if
r < 0 ). Alternatively, if
H 0 is
covariance, denoted by covar(X,Y), is defined as![]()
n
cov ar ( X , Y ) = (∑ ( xi − x)( yi − y)) / n .
i =1
Then the sample correlation coefficient, denoted
cov ar ( X ,Y )
accepted, then the phenomenon is referred as
‘insignificant positive’ (if r > 0 ) or ‘insignificant negative’ (if r < 0 ).
Problem 2: Let p be the proportion of occurrence of Head in n tosses in a coin tossing experiment.
by r, is defined as![]()
r = . Let,
var( X ) var(Y )
Let P be the probability of Head of that coin. We
for two random variables X and Y, mean of X be
µ x , and mean of Y be µ y . Then
would like to test the hypothesis
versus the alternative hypothesis
H 0 : P = 0.5
H1 : P ≠ 0.5
σ xx
= E ( X − µ x
) 2 , σ
= E (Y − µ y
) 2 ,
using p and n. The critical region has two parts
(Lehmann E.L. and J.P. Romano, 2006). We have
σ xy
= E ( X − µ x )(Y − µ y ) and hence the
given one part below for level of significance
population correlation coefficient
0.05. We will reject the null hypothesis if![]()
ρ = σ xy
σ xxσ yy
, where E denotes expectation.
p ≥ 0.5 + u0.975
x 2
0.25
![]()
n
where u0.975 is such that
The sample correlation coefficients are evaluated
by two-tailed t test for the level of significance α = 0.05 . Statistical tables, [23] are used for this purpose.
In this article we have faced two different statistical testing problems. Two problems as well as the respective solutions are given below. Problem 1: Let r be the correlation coefficient
calculated on the basis of n given two dimensional vectors. We would like to test the![]()
u0.975 exp(− )
![]()
2 dx = 0.975 . Here also, if H is
−∞ 2π
rejected then P is significantly different from 0.5.
The correlation coefficient between the year-wise data of the average sunspot number and the number of storm occurrences in Kolkata over the
hypothesis hypothesis
H 0 : ρ = 0 versus the alternative
H1 : ρ ≠ 0 where ρ is the
period of 41 years (from 1969 to 2009) have been
calculated, using the Pearson correlation statistical function. The value of correlation
correlation coefficient of the population. The test
statistic used in this regard (Lehmann, E.L. and
J.P. Romano, 2006) is denoted by T where T=
coefficient obtained is 0.36681, which is found to be greater than the standardized value of
correlation coefficient at the level of α=0.02, as![]()
r n − 2
1 − r 2
. Note that T follows t distribution
per RMM [23] statistical table.
with degrees of freedom (n-2).
IJSER © 2013 http://www.ijser.org
International Journal of Scientific & Engineering Research, Volume 4, Issue 9, September-2013 2116
ISSN 2229-5518
160
140
120
100
80
60
40
20
Average Sunspot
No.(MAM) Kolkata Storm
it can be clearly inferred from our observational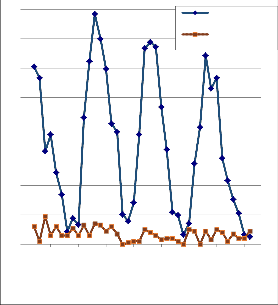
and statistical results that a relationship may exist between the two parameters. Although we have obtained strong corroboration from statistical analysis, any physical explanation regarding this possibility has not yet been put forward.
The authors are thankful to India Meteorological Department, Govt. of India for providing meteorological data for this research work.
0
1967 1972 1977 1982 1987 1992 1997 2002 2007
Year
Fig.1. Time series pattern of average sunspot no. and kolkata storm
The number of observations is 41(as the data of
41 years were considered in our analysis). The degrees of freedom here are 39.
A graph has been plotted with time along the X- axis and the number of corresponding events (or variables) along the Y-axis. As the correlation coefficient between the number of thunderstorms and the sunspot number is significantly positive, it indicates that the years when the number of storms increases (or decreases), the number of average sunspot number also increases (or decreases). This prediction about the nature and behaviour of the graph was also made from the customary theoretical results obtained by operating on the two sets of variables. This easily implies that a relation may exist between the two variables.
Solar activities and thunderstorms have been a subject of interest for scientists and researchers for a long time. A possible relation between the average sunspot number and thunderstorms may have a deep impact on satellite and radio communications. The sunspot number is a universal feature. On the other hand, severe storm is the mesoscale feature. Thunderstorms which are considered here are localized within of Kolkata (India) . Apparently there may not be any link between these two variables. However,
[1] Aswathy Mary Prince, Dr. Sanish Thomas, Er. Ravi Jon, and Dr. D.P Jayapandian, February,
2013, “A Study on Midrange Periodicity of
Sunspot Number during Solar Cycles 21, 22, 23 &
24”, International Journal of Scientific and Research Publications, Volume 3, Issue 2, pp.1-5, ISSN 2250-3153.
[2] J. Y. Liu, C. H. Lin, H. F. Tsai, and Y. A. Liou,
2004, “Ionospheric solar flare effects monitored by the ground-based GPS receivers: Theory and observation”, Journal of Geophysical Research, Vol.109, A01307, doi:10.1029/2003JA009931.
[3] Jagdish Rai, D. K. Sharma, Ramesh Chand, K. Suda & M. Israil, 2006, “Effect of active thunderstorms on ionospheric electron and ion temperatures as obtained by the SROSS-C2 satellite measurements”, 19th International Lightning Detection Conference, Tuscon, Arizona, USA.
[4] H.S.Yang, R.S.Reddy, and T.Moore, 1996, “Effects of solar flares on thunderstorm activities”, Bulletin of the Astronomical Society, Vol.28, No.3, p.1196, provided by NASA Astrophysics data system.
[5] W. Clement Ley, 05 April, 1894, Letters to Editor, “Sun-spot Phenomena and Thunderstorms”, Nature, 49, 531-531, doi:10.1038/049531b0.
[6] Kristjansson, J.E., Staple, A., Kristiansen, J.,
2002, “A new look at possible connections
IJSER © 2013 http://www.ijser.org
International Journal of Scientific & Engineering Research, Volume 4, Issue 9, September-2013 2117
ISSN 2229-5518
between solar activity, clouds and climate”, Geophysical Research Letters, 29, (23), 2107-2110.
[7] Osmar Pinto Neto, Iara R.C.A. Pinto, Osmar Pinto Jr., 2013, “The relationship between thunderstorm and solar activity for Brazil from
1951 to 2009”, Journal of Atmospheric and Solar- Terrestrial Physics, 98, 12-21.
[8] White, W.B., Lean, J., Cayan, D.R., Dettinger, M.D., 1997, “Response of global upper ocean temperature to changing solar irradiance”, Journal of Geophysical Research, 102, 3255-3266.
[9] Udelhofen, P.M., Cess, R.D., 2001, “Cloud cover variations over the United States: an influence of cosmic rays or solar variability”, Geophysical Research Letters, 28, (13), 2617-2620.
[10] Brooks, C.E.P., 1934, “The variation of the annual frequency of thunderstorms in relation to sunspots”,Quarterly Journal of the Royal Meteorological Society, 60, 153-166.
[11] Rycroft, M.J., Israelsson, S., Price, C., 2000, “The global atmospheric electric circuit, solar activity and climate change”, Journal of Atmospheric and Solar-Terrestrial Physics, 62, (17-18), 1563-1576.
[12] Fritz, H., 1878, “Die wichtigstenperiodischenErscheinungen der Meteorologie und Kosmologie”, In:NatuurkundigeVerhandelingen van de HollandscheMaatschappij der Wetenschappente Haarlem, Deel III, Harleem (In Germain).
[17] Egeland, A., Gustaffson, G., Olsen, S.,
Barrow W., Katz. A., 1965, “An investigation of the natural electromagnetic radiation between 10 c/s and 10 kc/s”, ArkivGeophysik, 4, 537-542.
[18] Aniol, R., 1952, Schwankungen der GewitterhRau6gkeit in Ruddeutschland.MeteorologischeRundschau,
3(4),55-56.
[19] Stringfellow, M.F., 1974, “Lightning incidence in Britain and the solar cycle”, Nature,
249, 332-333.
[20] Schlegel, K., Diendorfer, G., Thern, S., Schmidt, M., 2001, “Thunderstorms, lightning and solar activity- middle Europe, Journal of Atmospheric and Solar-Terrestrial Physics, 63,
1705-1713.
[21] Girish T.F., Eapen, P.E., 2008, “Geomagnetic and sunspot activity associations and ionospheric effects of lightning phenomena at Trivandrum near dip equator ”, Journal of Atmospheric and Solar-Terrestrial Physics, 70 (17), 2222-2232.
[22] Singh, D., Kumar, P.R., Kulkarni, M.N., Singh, R.P., Singh A.K., 2013, “Lightning convective rain and solar activity over the South/ Southeast Asia”, Atmospheric Research, 120-121,
99-111.
[23] Rao, C.R., Mitra S.K. and Mathai A., 1966: Formulae and Tables for Statistical Work, Statistical Publishing Society, Calcutta, India
[13] Septer, E., | 1926, | “Sunspots and |
thunderstorms | in | Siberia”, |
MeteorologischeZeitschrift, 43, 229-231.
[14] Myrbach, O., 1935, “Sonnenfleckenzyklus und Gewitterhaufigkeit in Wien Kiemsmunster und Bayern. Met. Ls., 52, 6-10.
[15] Kleymenova, E.P., 1967, “On the variation of the thunderstorm activity in the solar cycle”, Glav. Upirav. Gidromet. Scuzb., Met. Gidr., 8, 64-
68.
[16] Sen, A.K., 1963, “Integrated field intensity of atmospherics in relation to local thunderstorms”, Journal of Atmospheric and Solar-Terrestrial Physics, 25, 306-308.
IJSER © 2013 http://www.ijser.org