International Journal of Scientific & Engineering Research Volume 4, Issue 1, January-2013
ISSN 2229-5518
Studies on heavy metals contamination in
Vrishabhavathi river water and ground water of the surrounding river
Jayadev , E.T. Puttaih
The aim of this study is to assess the physicochemical parameters, extent of heavy metal content in Vrishabhavathi river water and its surrounding ground water. The perennial source of drinking water stream, today carrying large quantity of industrial, agricultural and domestic effluents (treated and untreated) from the western parts of Bangalore city. This polluted water used in agriculture due to easy availability in periurban areas causes various environmental issues in food chain contamination by heavy metals because of their potential accumulation and bioaccumulation by food chain in human health problems. Water samples of both Vrishabhavathi river and its surrounding ground water collected at selected sites are subjected to comprehensive physic chemical parameters and toxic heavy metal analysis using atomic absorption spectrophotometer. The results reveals that Vrishabhavathi river water is not potable for drinking when compared to the BIS standards. It is not suitable to use directly for irrigation also in the upper stream. The concentration of Heavy metals is higher in summer and minima during rainy season. The concentration decreases in the downstream of the river. Heavy metals Pb, Cr, Ni, Mn and Fe concentration is above permissible limit. Even though some of the pollutants level is below permissible limit, regular monitoring of pollutants in polluted water is essential to prevent excessive build up of these pollutants in soil and food chain where this polluted water is used in irrigation of land.
The problem of environmental pollution due to toxic metals has begun a big concern now in most of the major metropolis. Many of the rivers, lakes and oceans have been contaminated by pollutants. Some of these pollutants are directly discharged by industrial plants, municipal sewage treatment plants, and heavy increase in vehicles using petroleum fuel and polluted runoff in urban and agricultural areas. The areas where no alternative source of clean water exists, peoples will adopt urban waste water for irrigation of agricultural lands to increase the production of crops. It has been reported that sewage effluents from municipal origin contain appreciable amount of major essential plant nutrients, therefore the fertility levels of the soil is improved considerably under sewage irrigation of crop fields [1],[2],[3]. Treated sewage water, also contains variable amounts of heavy metals such as Pb, Ni, Cd, Cu,![]()
Jayadev, Research Scholar, Department of Environmental Science ,Kuvempu University, and SJBIT, Bangalore. Email- devbcv@gmail.com.
Dr. E.T. Puttaiah, Department of Environmental Science
,Kuvempu University, and Vice Chancellor, Gulbarga
University, Gulbarga. Email-profetputtaiah@rediffmail.com.
Hg, Zn and Cr [4]. The toxic heavy metals entering the ecosystem may lead to geoaccumulation, bioaccumulation and biomagnifications. The nature of effects can be toxic, neurotoxic, carcinogenic, mutagenic, teratogenic and becomes apparent only after several years of exposure, as there is no good mechanism for their elimination from the body [5],[6].
The Vrishabhavathi river once used as a major drinking water source to the populace living across the river. This source has been the victim of pollutants discharged by industrial, agricultural and domestic effluents. The river in present days carries sewage and industrial effluents from various industries across western part of Bangalore which is the largest watershed as well as most polluted. It receives treated and untreated effluents from treatment plants of Bangalore water supply and sewerage board, containing various organic contaminants, toxic heavy metals etc.[7]. In the recent years ground water pollution across Vrishabhavathi river has emerged as a severe environmental issue ,constraining its use drastically [8]. The polluted river water is extensively used for irrigating farm lands across the river on either side from Kengeri to Byramangala tank for about forty five kilometres away from the origin of the river. In this context, present study is under taken to quantify the level of heavy metals and the degree of pollution of the Vrishabhavathi river water and ground water near Bangalore city, where waste water is used for irrigation of agricultural fields.
IJSER © 2013 http://www.ijser.org
International Journal of Scientific & Engineering Research Volume 4, Issue 1, January-2013
ISSN 2229-5518
Bangalore is located at a latitude 12o.58’N and longitude of 77o.35’E at an altitude of 921 m above mean sea leve [9]. Vrishabhavathi river is one of the tributaries of the river Cauvery. It carries largest drainage watersheds out of other three viz., Vrishabhavathi, Bellandur and Nagavara watersheds of Bangalore. The main water shed of Bangalore, Vrishabhavathi watershed carries polluted effluents from two major industrial areas, Peenya and Rajajinagr, domestic sewage effluents of both treated and untreated water, directly discharged in to it from a large part of city. It also carries Industrial effluents along Bangalore-Mysore state highway factories and Bidadi Industrial area. The Vrishabhavathi river tributary of Cauvery, drains an aerial extent of 545 sq. km before it joins the Suvarnamukhi river at Bhadragundadoddi of Kanakapura taluk, Bangalore district.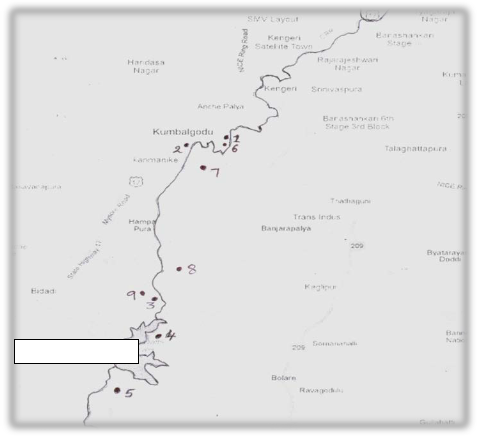
Nine water samples were collected, six sites of Vrishabhavathi river and three sites of its surrounding areas of ground water in the study area(Fig.1) during the year 2009 in five litre distilled water washed polythene bottles. The temperature, pH , turbidity, TDS, electrical conductivity, salinity and dissolved oxygen were measured in the field at the time of sample collection [10] using water analyzer 371 Systronics. There after 500 ml water samples collected acidified with analytical grade nitric acid to prevent the precipitation of metals. The samples were concentrated to tenfold on a water bath and analyzed for heavy metals using Atomic Absorption Spectrophotometer (GBC Avantra Version 1.31). The
rest of the water sample is stored at 4oC to determine the other physicochemical parameters as per the standard
methods for examination of Vrishabhavathi river and surrounding areas of ground water [11]. The results obtained were evaluated in accordance with the standards prescribed under Indian Standard Drinking water specification IS 10500:1991 of Bureau of Indian
Standards[12].
Byramangala Tank
Figure 1-Location map of Vrishabhavathi valley with selected sample sites
IJSER © 2013 http://www.ijser.org
International Journal of Scientific & Engineering Research Volume 4, Issue 1, January-2013
ISSN 2229-5518
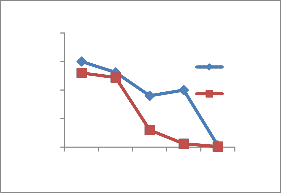
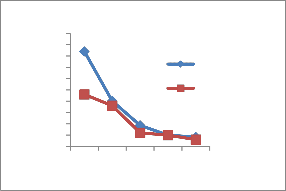
The experimental data of physicochemical parameters of water samples collected at different sites across Vrishabhavathi river water is presented in table 1 for summer season and table 2 for rainy season. Some of the parameters measured for ground water is tabulated in table 3. The heavy metal concentration in Vrishabhavathi river water is presented in figure -2 and figure- 3.
BOD, COD value is higher in Vrishabhavathi river water and other physicochemical are below permissible limits. The BOD value at site numbers 1,2,3,4 and 5 is in the order of 70,78,70,49,40 mg/lit. in summer and
40,43,41,25,23 mg/lit in rainy respectively and limit according to BIS standard is 3 mg/lit, the data in summer season shows higher value at all sites. COD value at site numbers 1,2,3,4 and 5 are 175,169,160,101,98 mg/lit. in summer and 125, 130, 132, 69,62 mg/lit respectively in rainy, the permissible limit is 10< mg/lit [13].
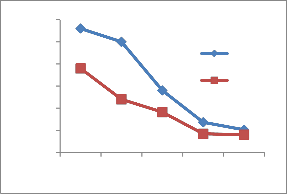
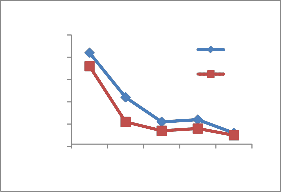
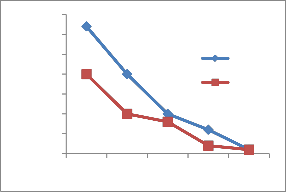
The heavy metal concentration are higher in summer and minima in rainy season [14] due to dilution of polluted water. The concentration of heavy metals decreases along the downstream of the river. The concentration is higher at site number 1 of upper stream. At site number 4, Pb,Ni,Cu and Cr is higher because of the addition of some more effluents from Bidadi industrial area [15].
During the present study, maximum concentration 0.15 mg/lit of Pb in site number 1,0.131 mg/lit in site 2 and
further decrease along sites 3 to 5 shows the concentration decreases in downstream. The concentration is above permissible limit at site numbers
1,2and 3 respectively during summer and during rainy at site number 1 and 2. The permissible limit as per BIS standards Pb concentration is 0.05 mg /lit. These sites are in the upper stream of the river. Cr is 0.15 mg/lit at site number 1 during summer and 0.10 mg/lit in rainy, permissible limit is 0.05 mg/lit. Fe concentration 2.8,
2.5,1.4 mg/lit.in summer and 1.9,1.2,0.91 mg/lit in rainy, it is higher as per BIS standards 1.0 mg/lit. The concentration of Mn at site numbers 1 and 2 is
0.401,0.306 mg/lit in summer , 0.381 at site number 1 in rainy is observed which is above permissible limit of
BIS standard 0.3 mg/lit.
The physicochemical characteristics tabulated in table-3 for Vrishabhavathi river valley surrounding ground water shows that the heavy metal concentration is below BIS standards except Cr and Fe at site number 1. Total hardness is higher at site numbers 7,8,9 , is 780,710,680 mg/lit above BIS standards 600 mg/lit. Heavy metal Mn and Fe is 0.351, 1.92 mg/lit which is above permissible limit. Ca is above BIS standard at site number 9.
The physicochemical parameters of Vrishabhavathi river water shows that , the water is not suitable for drinking at all sites and not suitable for irrigation in the upper stream. The pollutants present in Vrishbhavathi river water leach out in soil and contaminate ground water sources [16].
IJSER © 2013 http://www.ijser.org
International Journal of Scientific & Engineering Research Volume 4, Issue 1, January-2013
ISSN 2229-5518
Table 1 : Results of physicochemical analysis of Vrishabhavathi river water(March 2009, Summer)
Kambipura Site no. 1 | Kumbalgodu Site no. 2 | Shanmangala Site no. 3 | Byramangala Tank Site no. 4 | Byramangala Tank canal Site no. 5 | BIS Standards | |
Temperatureo C | 28.5 | 27.9 | 27.7 | 28.4 | 27.5 | - |
pH | 7.12 | 6.9 | 7.1 | 7.2 | 7.0 | 6.5-8.5 |
EC in µ mhos/cm | 1230 | 1320 | 1150 | 1120 | 1050 | - |
TDS mg/lt. | 610 | 665 | 545 | 675 | 590 | 2000 |
Salinity mg/lt. | 645 | 650 | 558 | 545 | 601 | - |
Total Hardness mg/lt. | 450 | 425 | 350 | 410 | 425 | 600 |
Total Alkalinity mg/lt. | 320 | 340 | 310 | 300 | 330 | 600 |
Cl- ppm | 140 | 130 | 110 | 110 | 100 | 1000 |
Na mg/lt. | 41 | 60 | 49 | 45 | 46 | - |
Ca mg/lt. | 39 | 68 | 61 | 62 | 54 | 200 |
K mg/lt. | 27 | 28 | 24 | 22 | 21 | - |
Mg mg/lt. | 16 | 18 | 19 | 15 | 12 | 30 |
Non carbonate hardness | 110 | 100 | 84 | 125 | 90 | - |
Dissolved oxygen | 0.8 | 1.0 | 1.1 | 1.3 | 1.5 | - |
Sulphate mg/lt. | 54 | 59 | 60.5 | 79 | 65 | 400 |
Nitrate mg/lt. | 6.5 | 7.1 | 9.0 | 10.1 | 9.5 | 100 |
COD mg/lt. | 175 | 169 | 160 | 101 | 98 | 10< |
BOD mg/lt. | 70 | 78 | 70 | 49 | 40 | 3 |
Pb mg/lt. | 0.15 | 0.131 | 0.09 | 0.01 | 0.003 | 0.05 |
Cd mg/lt. | nd | nd | nd | nd | nd | 0.01 |
Zn mg/lt. | 0.42 | 0.201 | 0.093 | 0.05 | 0.041 | 15 |
Ni mg/lt. | 0.041 | 0.021 | 0.01 | 0.011 | 0.005 | - |
Cu mg/lt. | 0.032 | 0.02 | 0.01 | 0.006 | 0.001 | 1.5 |
Cr mg/lt. | 0.15 | 0.02 | 0.001 | 0.01 | 0.001 | 0.05 |
Fe mg/lt. | 2.8 | 2.5 | 1.4 | 0.68 | 0.51 | 1.0 |
Mn mg/lt. | 0.401 | 0.306 | 0.241 | 0.156 | 0.095 | 0.3 |
Note: nd-not detected
Table 2 : Results of physicochemical analysis of Vrishabhavathi river water (September 2009, Rainy season)
IJSER © 2013 http://www.ijser.org
International Journal of Scientific & Engineering Research Volume 4, Issue 1, January-2013
ISSN 2229-5518
Kambipura Site no. 1 | Kumbalgodu Site no. 2 | Shanmangala Site no. 3 | Byramangala Tank Site no. 4 | Byramangala Tank canal Site no. 5 | BIS Standards | |
Temperature o C | 25 | 26.1 | 26.7 | 26.4 | 27.0 | - |
pH | 7.16 | 7.2 | 7.1 | 7.8 | 7.5 | 6.5-8.5 |
EC in µ mhos/cm | 1120 | 1100 | 1130 | 945 | 1010 | - |
TDS mg/lt. | 658 | 611 | 633 | 531 | 609 | 2000 |
Salinity mg/lt. | 723 | 823 | 626 | 533 | 623 | - |
Total Hardness mg/lt. | 420 | 405 | 310 | 400 | 415 | 600 |
Total Alkalinity mg/lt. | 300 | 310 | 280 | 270 | 280 | 600 |
Cl- ppm | 155 | 135 | 144 | 126 | 117 | 1000 |
Na mg/lt. | 45 | 45 | 46 | 43 | 41 | - |
Ca mg/lt. | 50 | 48 | 46 | 48 | 44 | 200 |
K mg/lt. | 24 | 22 | 22 | 20 | 20 | - |
Mg mg/lt. | 11 | 10 | 09 | 10 | 08 | 30 |
Non carbonate hardness | 20 | 18 | 16 | 21 | 20 | - |
Dissolved oxygen | 1.8 | 1.3 | 1.4 | 1.9 | 2.3 | - |
Sulphate mg/lt. | 81 | 83 | 79 | 80 | 74 | 400 |
Nitrate mg/lt. | 5.5 | 4.8 | 4.0 | 11.0 | 10.9 | 100 |
COD mg/lt. | 125 | 130 | 132 | 69 | 62 | 10< |
BOD mg/lt. | 40 | 43 | 41 | 25 | 23 | 3 |
Pb mg/lt. | 0.13 | 0.122 | 0.03 | 0.006 | 0.001 | 0.05 |
Cd mg/lt. | nd | nd | nd | nd | nd | 0.01 |
Zn mg/lt. | 0.23 | 0.18 | 0.06 | 0.051 | 0.031 | 15 |
Ni mg/lt. | 0.035 | 0.01 | 0.006 | 0.007 | 0.005 | - |
Cu mg/lt. | 0.020 | 0.01 | 0.008 | 0.002 | 0.001 | 1.5 |
Cr mg/lt. | 0.10 | 0.008 | 0.002 | 0.003 | 0.001 | 0.05 |
Fe mg/lt. | 1.9 | 1.2 | .91 | .42 | .40 | 1.0 |
Mn mg/lt. | 0.381 | 0.281 | 0.03 | 0.01 | 0.006 | 0.3 |
Note: nd-not detected
Table 3 : Results of physicochemical analysis of Ground water
IJSER © 2013 http://www.ijser.org
International Journal of Scientific & Engineering Research Volume 4, Issue 1, January-2013
ISSN 2229-5518
Kambipura Site no. 6 | Kumbalgodu Site no.7 | Parasinpalya Site no.8 | Shanmangala Site no.9 | BIS Standards | |
Temperature o C | 24.1 | 24.2 | 25.0 | 24.5 | - |
pH | 7.3 | 8.1 | 6.9 | 7.0 | 6.5-8.5 |
EC in µ mhos/cm | 457 | 625 | 730 | 350 | - |
TDS mg/lt. | 329 | 450 | 389 | 255 | 2000 |
Salinity mg/lt. | 250 | 275 | 235 | 240 | - |
Total Hardness mg/lt. | 510 | 780 | 710 | 680 | 600 |
Total Alkalinity mg/lt. | 350 | 360 | 500 | 510 | 600 |
Cl- ppm | 235 | 310 | 430 | 425 | 1000 |
Na mg/lt. | 175 | 138 | 340 | 320 | - |
Ca mg/lt. | 130 | 145 | 190 | 210 | 200 |
K mg/lt. | 2 | 9 | 3 | 2 | - |
Mg mg/lt. | 24 | 65 | 60 | 65 | - |
Non carbonate hardness | 220 | 375 | 245 | 246 | - |
Pb mg/lt. | nd | .001 | nd | nd | .05 |
Cd mg/lt. | nd | nd | nd | nd | .01 |
Zn mg/lt. | 0.09 | 0.061 | 0.006 | 0.05 | 15 |
Ni mg/lt. | nd | 0.012 | nd | 0.01 | - |
Cu mg/lt. | 0.006 | nd | nd | nd | 1.5 |
Cr mg/lt. | nd | nd | nd | nd | 0.05 |
Fe mg/lt. | 1.92 | 1.00 | 0.98 | 1.01 | 1.0 |
Mn mg/lt. | 0.351 | 0.201 | 0.003 | 0.151 | 0.3 |
Note: nd-not detected
It can be concluded that rapid population growth and industrialization have brought about resource degradation and a decline in environmental quality. The analysis of Vrishabhavathi river water samples reveals that the water is highly contaminated at selected points which are not suitable for drinking and irrigation. Pb, Cr, Mn and Fe concentration is above permissible limit. Even though the other metal concentration is below permissible limit, it is necessary to prevent excessive build up of these pollutants which are transferred to soil and finally food
chain. In irrigation tube well water can be used to dilute the heavy metal concentration of river water.
The authors thanks management and Principal of SJB Institute of Technology for the support in carrying out research work. We also thank Dr B Nagappa and H M Shivakumar of pollution control board and Dr B M Nagabhushan, MSRIT .
1. A.Mitra and L.K.Gupta , Effect of sewage water irrigation on essential plant nutrient and
IJSER © 2013 http://www.ijser.org
International Journal of Scientific & Engineering Research Volume 4, Issue 1, January-2013
ISSN 2229-5518
pollutant element status in a vegetable growing area around Calcutta, Journal of the Indian Society of Soil Science 47, 99-105, (1999).
2. K.P.Singh, D. Mohan, S. Sinha, & R.Dalwani, Impact assessment of treated / untreated wastewater toxicants discharged by sewage treatment plants on health, agricultural, and environmental quality in the wastewater disposal area. Chemosphere,
55, 227-255. (2004).
3. R.C.Tiwari , P.K.Saraswat and H.P.Agarwal , Changes in micronutrients status of soils irrigated with treated sewage water and tube well water, Journal of Indian society of soil science 51,150-155, (2003).
4. F.L.Kaushal , H.K. Parwana and S.P. Varma , Effect of waste water irrigation on soil properties, Indian journal of Environmental protection 13, 374-378(1993).
5. Amlan Kr. Ghosh , M. A. Bhatt · H. P. Agrawal, effect of long-term application of treated sewage water on heavy metal accumulation in vegetable grownin northern India, Environ Monit Assess
,184:1025-1036(2012).
6. N. Gupta , D. K. Khan , S. C. Santra , Heavy metal accumulation in vegetables grown in a long-term wastewater irrigated agricultural land of tropical India Environ Monit Assess ,
184:6673-6682(2012).
7. B.K.Praveen, Anand , N.Deepa , N.Latha, K.V.Raju , and H.L.Shashidhara , Drinking water in urban areas /; why and how is it getting worse? Proceedings of drinking water Supply of IWMI-TATA partners meet, Anand, Gujarat, February,24-26(2005).
8. B S Shankar, N Balasubramanya, M T Maruthesha Reddy, Hydrochemical assessment of the pollutants in Ground waters of Vrishabhavathi valley basin in Bangalore(India), Journal of Envirn.Science and Engg., Vol.50, No.2, P. 97-102, April 2008.
9. H. Lokeshwari and G.T. Chandrappa., Impact of heavy metal contamination of Bellandur Lake on soil and cultivated vegetation. Current Science, 91: 622 – 627, (2006).
10. B.K.Purandara and N. Varadarajan, Impacts on
ground water quality by Urbanization-A case study, Journal of Water Resources Society,23(4),
107-115(2003)
11. APHA (American Public Health Association).Standard methods for the examination of water and wastewater. 18th Edition APHA Washington, DC
12. BIS, Indian Standard Drinking Water
Specification, Manak Bhavan, New Delhi,
10500(1991)
13. M.V.Ahipathy ,E.T. Puttaiah , Toxicity of Vrishabhavathy river water and sediment to the growth of phaseolus vulgharis (french beans) J. Appl. Sci. Environ. Manage. Vol. 11 (1) 17 –
26( March, 2007)
14. M.V.Ahipathy ,E.T. Puttaiah , Ecological characteristics of Vrishabhavathi river in Bangalore(India), Environ Geol,49: 1217-1222, (2006).
15. Ram S. Lokhande, Praveen U.Singre,Deepali S. Pimple,Toxicity study of heavy metals pollutants in waste water effluent samples collected from Taloja Industrial Estate of Mumbai, India, Resources and Environment;1(1):13-19,(2011).
16. Manoj Kumar Meena, Subroto Dutta, Rashmi
Pradhan,EJEAF Che.9(4), 760-766,( 2010).
IJSER © 2013 http://www.ijser.org
International Journal of Scientific & Engineering Research Volume 4, Issue 1, January-2013
ISSN 2229-5518
0.2
0.15
0.1
0.05
0
1 2 3 4 5
Summer
Rainy
0.5
0.45
0.4
0.35
0.3
0.25
0.2
0.15
0.1
0.05
0
Summer
Rainy
1 2 3 4 5
0.049
0.039
0.029
0.019
0.009
-0.001
Summer
Rainy
0.035
0.03
0.025
0.02
0.015
0.01
0.005
0
Summer
Rainy
1 2 3 4 5
1 2 3 4 5
0.16
0.14
0.12
0.1
0.08
0.06
0.04
0.02
0
Summer
Rainy
3
2.5
2
1.5
1
0.5
0
Summer
Rainy
1 2 3 4 5
1 2 3 4 5
0.5
0.4
0.3
0.2
0.1
0
Summer
Rainy
1 2 3 4 5
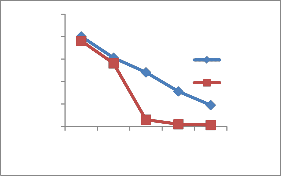
Figure 2-Heavy metal concentrations in Vrishabhavathi river water(Rainy& Summer season)
IJSER © 2013 http://www.ijser.org
International Journal of Scientific & Engineering Research Volume 4, Issue 1, January-2013
ISSN 2229-5518
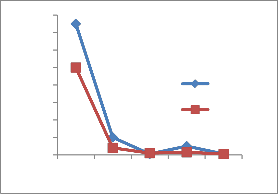
Av.heavy metal concentration in Vrishabhavathi river water
7
6
5
4
3
2
1
-0.08 0.12 0.32 0.52 0.72 0.92 1.12 1.32 1.52
Concentration in mg/lit
Rainy Summer
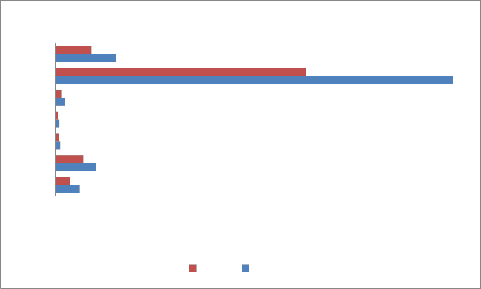
Figure 3-Average heavy metals concentration(1-Pb,2-Zn,3-Ni,4-Cu,5-Cr,6-Fe,7-Mn)
IJSER © 2013 http://www.ijser.org