International Journal of Scientific & Engineering Research, Volume 4, Issue 10, October-2013 627
ISSN 2229-5518
Stratigraphy and Petroleum Plays of the late to middle Oligocene Sediments in the “XY” Field, Onshore Niger Delta Basin, Nigeria
Samuel Okechukwu Onyekuru
Abstract— Nigeria’s search for increased oil and gas reserves requires the discovery of additional petroleum plays using more accurate exploration techniques like sequence stratigraphy. Sequence stratigraphic technique was applied to sediments in the “XY” Field, onshore Niger Delta by integrating six well logs and biostratigraphic data to subdivide the field’s stratigraphic column into sequences, systems tracts and profitable plays. The analysis delineated seven complete (SEQs 1 to 7) and two incomplete 3rd order sequences. The key surfaces used for correlation across the sequences in Wells 002,
003, 005 and 001 were the 11.5Ma, 12.8Ma and 15.0Ma MFSs, while the link between these four wells and Wells 007 and 006 was the 15.9Ma MFS. The other constrained surfaces between Wells 007 and 006 were the 17.4Ma, 19.4Ma and 20.7Ma MFSs. These surfaces were delineated at varying depths in the wells, suggesting the existence of faults in the well field. The most laterally continuous sandstone unit, however, is the faulted prograding wedge complex (PGC) sands of SEQ 4 which represented the main petroleum plays in the field. Cyclic alternation of Transgressive Systems Tracts (TST), High- stand Systems Tracts (HST) and Lowstand Systems Tracts (LST) in the well field is suggestive of a union of the elements of a petroleum system which constitute favourable conditions for the generation, migration and structural and stratigraphic entrapment of hydrocarbons.
—————————— ——————————
xploration and exploitation activities in Nigeria had been concentrated in the Tertiary Niger Delta sequences of Eo- cene to Pliocene age, until recently when exploration efforts are gradually being shifted to the offshore (Pliocene– Pleistocene) sections. These areas have accounted for the coun- try’s current oil reserves estimated at about 35 billion barrels and an average annual reserve addition of about 800 million barrels in the last ten years [1]. These reserves that were main- ly derived from the onshore, offshore and recently the deep offshore parts of the Niger Delta are presently intensely de-
veloped.
The Nigerian oil and gas industry is presently faced with the
challenge of achieving the national crude oil reserves target of
40 billion barrels and production of increased volumes of Liq-
uefied Natural Gas (LNG) in order to meet export and domes-
tic needs. The domestic need is bolstered by the current gov-
ernment policy thrust for additional gas turbines for power
generation and industrial projects [2]. Therefore, the future
reserve/production ratio for oil/gas in Nigeria will be a cause for serious concern based on the present available reserves data, if additional reserves are not discovered.
The search for additional oil and gas reservoirs in the region will, therefore, require more accurate techniques of strati-
————————————————
graphic analysis [3]. These techniques will assist in the discovery of hithertho hidden, deep and tight reservoirs which will give the required boost to the existing reserves. Sequence stratigraphy has become an indispensable tool in hydrocarbon exploration because of its ability to provide a chronostratigraphic framework for the analy- sis and correlation of lithic fills in basins that are deposited in re- sponse to sea level changes, tectonism and sediment supply. The search for additional reserves in the Niger Delta Baasin can be en- hanced by the use of this integrated approach for stratigraphic analy- sis and prediction [4], [5], [6], [7]. It will also give a better under- standing of the linkage between sedimentation patterns in different parts of the basin and location of reservoirs, their continuity and seal prone zones (traps) and perfectly predicts bypassed pay zones and step-out potentials in a basin [8].
Therefore, to realize optimal hydrocarbon exploration, recovery and production, the understanding of the depositional setting and location of play elements within the depositional setting is required for a real- istic or near realistic representation of the subsurface and paleoenvi- ronmental conditions within the basin.
The aim of the present study in the onshore, Niger Delta is to subdi-
vide the stratigraphic column of the “XY” well field into sequences and systems tracts based on the integration of well logs and high resolution biostratigraphic data for the delineation of reservoirs, their continuity and other elements of the petroleum system (source, traps, e.t.c) for the sustainable development of the resource in the region.
2 LOCATION OF STUDY
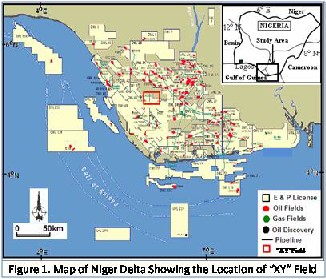
The “XY” Field (a designation used for propriety purposes) is locat- ed at the fringe of the Greater Ughelli Depobelt in the Niger Delta Basin (Fig. 1). The Niger Delta is situated in the Gulf of Guinea on the west coast of central Africa (Fig. 1). It lies on Latitudes 40001N and 60031N and Longitudes 40301E and 80301E. During the Tertiary, the delta built out into the Atlantic Ocean at the mouth of the Niger-
IJSER © 2013 http://www.ijser.org
International Journal of Scientific & Engineering Research, Volume 4, Issue 10, October-2013 628
ISSN 2229-5518
Benue system on an area of catchment more than a million square kilometers of predominantly savanna-covered lowlands. From the Eocene to the present, the delta has prograded southwestward, form- ing depobelts that represent the most active portions of the delta at each stage of its development [9]. These depobelts form one of the largest regressive deltas in the world with an area of some 300,000 km2 [10], a volume of 500,000 km3 [11] and a sediment thickness of over 10 km in the basin depocenter [12]. The Greater Ughelli Depobelt, however, overlies a relatively shallow basement with in- creased steepness seawards [9].
The onshore portion of the Niger Delta Province is delineated by the geology of southern Nigeria and southwestern Cameroon (Fig. 2). The northern boundary is the Benin flank- an east-northeast trending hinge line south of the West African Basement Massif. The north- eastern boundary is defined by outcrops of Cretaceous sediments on the Abakaliki High and further east-south-east by the Calabar flank-a hinge line bordering the adjacent Precambrian rocks. The offshore boundary of the province is defined by the Cameroon volcanic line to the east, the eastern boundary of the Dahomey basin (the eastern- most West African transform-fault passive margin) to the west, and the two-kilometer sediment thickness contour or the 4000-meter bathymetric contour in areas where sediment thickness is greater than two kilometers to the south and southwest (Fig. 2).
Sedimentary deposits in the basin have been divided into three large- scale lithostratigraphic units (Fig. 3): the basal Paleocene to Recent pro-delta facies of the Akata Formation, Eocene to Recent, paralic facies of the Agbada Formation, and Oligocene-Recent, fluvial facies of the Benin Formation [13], [14], [15]. These formations become progressively younger farther into the basin, recording the long-term progradation of depositional environments of the Niger Delta onto the Atlantic Ocean passive margin.
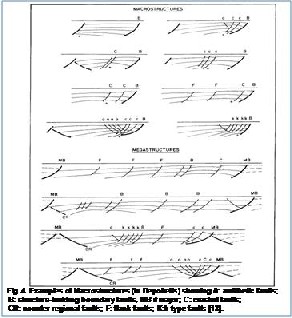
The stratigraphy of the study area is complicated by syndepositional collapse of clastic wedges as shales of the Akata Formation are mo- bilized under the load of prograding deltaic Agbada and fluvial Be- nin Formation deposits. A series of large-scale, basinward-dipping listric normal faults were formed as underlying shales diapired up- ward (Fig. 4). Blocks down-dropped across these faults and filled with growth strata, changed local depositional slopes and complicat-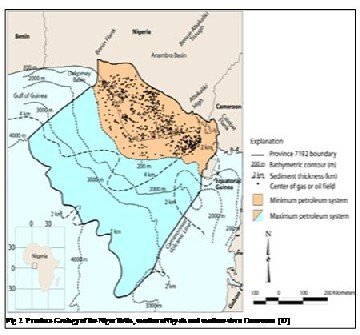
ed sediment transport paths into the basin. For any given depobelt in the Niger Delta province, gravity tectonics was completed before deposition of the Benin Formation, which are expressed in complex structures, including shale diapirs, roll-over anticlines, collapsed growth fault crests, back-to-back features and steeply dipping, close- ly spaced flank faults [13], [16]. These faults mostly offset different parts of the Agbada Formation and flatten into detachment planes near the top of the Akata Formation.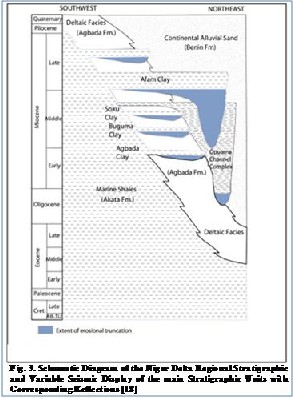
IJSER © 2013 http://www.ijser.org
International Journal of Scientific & Engineering Research, Volume 4, Issue 10, October-2013 629
ISSN 2229-5518
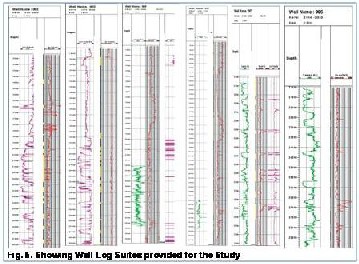
The data sets used for this study included 6 well log suites from the
‘XY” Field, Greater Ughelli depobelt, logged with gamma ray (GR) and resistivity logs (Fig. 5), biostratigraphic data (faunal zones and events) including palynological and foraminiferal information (Table
1) and the Niger Delta Chronostratigraphic Chart [19]. The data were acquired from Shell Producing and Development Company (SPDC), Port Harcourt, through the Directorate of Petroleum Resources (DPR), Nigeria. The non-availability of GR and SP logs at some sections of the studied intervals, however, affected interpretations at those depths.
Athough sequence stratigraphy was originally designed for seismic sections, its principles can readily be applied to outcrops, cores and well logs [3]. Sequence stratigraphic analysis of each of the six (6) well log suites from the “XY” Field in the Greater Ughelli depobelt, Niger Delta Basin was achieved by the integration of biostratigraphic information (stratigraphic markers) and lithological data distilled out from the wireline log suites using the approach of [5].
5.2. Determination of Lithology, Stacking Patterns and Deposi- tional Settings
The wireline logs were used to delineate lithofacies based on the physical criteria extracted from the electric logs’ responses. The gamma ray log records radioactivity of formations, hence shales (or clay-minerals) commonly have relatively high gamma radioactive responses and consequently taken as good measures of grain size. The log is thus used to infer depositional energy. Coarse-grained sand, which contains little mud, will have low gamma ray value, than mud with high gamma ray signal. Gamma ray values are measured in API (American Petroleum Institute) units and range from very few units (in anhydrite) to over 200 API units in shales.
IJSER © 2013 http://www.ijser.org
International Journal of Scientific & Engineering Research, Volume 4, Issue 10, October-2013 630
ISSN 2229-5518
Form Code | Depth (AH), Ft |
E5000 base | 8095 |
E5000 top | 8075 |
E6000 base | 8253 |
E6000 top | 8179 |
E8000 base | 8515 |
E8000 top | 8407 |
E9000 base | 8617 |
E9000 top | 8593 |
F1000 base | 8760 |
F1000 top | 8703 |
F1400 base | 8917 |
F1400 top | 8768 |
F2000 base | 9178 |
F2000 top | 9123 |
F2000_DLG_contact | 9155 |
F2100 base | 9229 |
F2100 top | 9202 |
F2100_DHO_contact | 9203 |
F2200 base | 9260 |
F2200 top | 9250 |
F2300 base | 9350 |
F2300 top | 9328 |
F3000 base | 9688 |
F3000 top | 9360 |
F3000_DHO_contact | 9362 |
F3000_HWC_contact | 9404 |
F3100 base | 9782 |
F3100 top | 9720 |
F4000 top | 10172 |
ZZC | 7464 |
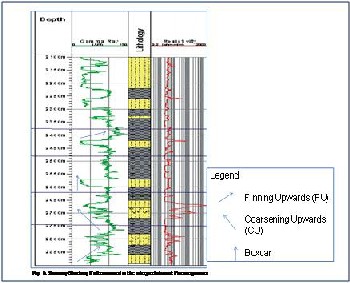
The intervals of progradation, retrogradation and aggradation were delineated from the succession patterns of strata expressed in the logs, which depict various parasequences and/or parasequence sets. These patterns which display vertical occurrences of repeated cycles of coarsening upwards (CU) or fining upwards (FU) sequences were inferred from the gamma ray log signatures.
The environment of deposition for the respective units was inferred from the gamma log expression of grain size [5] and depositional systems determination distilled from stacking patterns [3].
an upward increase in depositional energy with shallowing-upward and coarsening. In deep marine settings, this trend reflects an in- crease in the sand content of turbidite bodies [20].
5.3 Definition of Key Stratigraphic Sequences from Logs
The definition of key stratigraphic surfaces from well logs, which includes for example, Sequence Boundary (SB) and Maximum Flooding Surface (MFS) and their relative ages was done by identi- fying candidates and events of the surfaces in the following ways: Candidate SBs on log-motifs were marked by the sharp-based bot- tom of the basin floor thicks and incised-valley fills and in updip areas by the sharp-top of the uppermost prograding transgressive parasequence, low gamma, high resistivity and the use of the provid- ed stratigraphic markers [21]. Candidate SB was also identified from facies discontinuities in the logs. From the logs, a change from for- ward stepping to back stepping parasequence stacking pattern was looked out for in the gamma ray log. The trend of shale resistivity shows increased resistivity towards SB and a decrease away from SB. From the biofacies data, candidate SB was inferred using the provided stratigraphic markers. Facies expression of the SB depends on the paleogeographic location of the section in the basin and the Systems Tract.
MFS and condensed sections were identified from log trend bounda- ries and/or log character and the provided biostratigraphic data. Gamma ray logs have high values at MFS and condensed sections. Shale resistivity values decrease towards MFS and increase away from MFS [21]. Faunal/floral density trends display increased densi- ty towards flooding surface and decreased density away from the flooding surface.
5.7 Delineation of Systems Tracts
Delineation of systems tracts was done after the surfaces were identi- fied. Parasequence stacking patterns were used to identify the Lowstand Systems Tracts (LST), Transgressive Systems Tracts (TST) and Highstand Systems Tracts (HST), enveloped by the con- strained surfaces (MFS, TS and SB).
The enveloping Sequence Boundary (SB) of a sequence, or its down dip correlative conformity, lies between the Highstand Systems Tract (HST) and the Lowstand Systems Tract (LST) according to the se-
IJSER © 2013 http://www.ijser.org
International Journal of Scientific & Engineering Research, Volume 4, Issue 10, October-2013 631
ISSN 2229-5518
quence stratigraphic depositional model propounded by [3], (Fig. 7). Transgressive Surface (TS) lies between the Lowstand Systems Tract (LST) and the Transgressive Systems Tract (TST). The Maximum Flooding Surface (MFS) caps the TST (Fig. 8).
TST is characterized generally by an overall retrogradational/fining upward stacking pattern of a sequence (Fig. 6). The stacking pattern can also be aggradational.
The HST is usually delineated by progradational/coarsening upward stacking patterns of parasequences (Fig. 6). The HST is also some- times associated with blocky/serrated log motifs. However, the sedi- ment/particle size of HST sediments remains relatively coarser in a shallow or shoaling paleobathymetric setting. The HST is bounded below by the MFS and above by the SB [3], (Fig. 7).
LST (PGC) is characterized by progradational/coarsening upward parasequences. It can also be blocky (BFF/PGC) (Fig. 6). The LST is bounded below by an SB and above by a Tansgressive Surface (TS) (Fig. 8).
5.4 Dating of identified Surfaces
Dating of identified key stratigraphic surfaces (where possible) was achieved by correlation to the third order cycles chart of [19], (Fig.
9) in association with chronostratigraphically significant bio-events (Table 1), wherever they were recorded. The marker shales Bolivina sp, and Chiloguembelina sp, etc., identified from biostratigraphic data were used to assign geologic age to the inferred surfaces. Correlation of sequences, systems tracts, parasequence and/or para- sequence sets of the wells was done using Petrel and Strata bug softwares.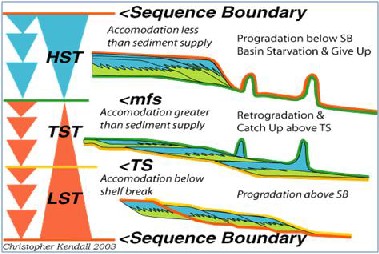
![]()
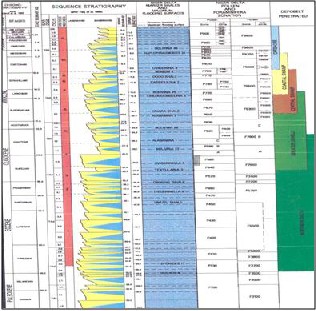
FIG. 9. NIGER DELTA CHRONOSTRATIGRAPHIC CHART [19]
IJSER © 2013 http://www.ijser.org
International Journal of Scientific & Engineering Research, Volume 4, Issue 10, October-2013 632
ISSN 2229-5518
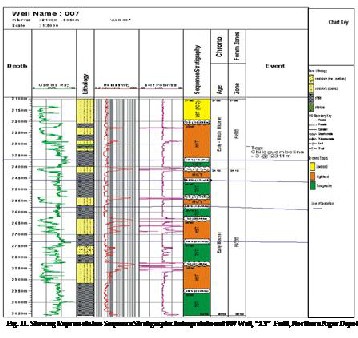
The wells in “XY” field were arranged and interpreted according to spatial distributions in the well field which arranged the wells ac- cording to affinity and not with respect to well numbers (Fig. 5). The wells were numbered (001, 002, 003, 005, 006 and 007) based on the time of drilling and completion.
The representative sequence stratigraphic interpretations in the “XY” field for Wells 006 and 007 are shown Figs. 10 and 11, respectively, while the comprehensive interpretations for the six wells are present- ed in tables 2, 3, 4, 5, 6, and 7 for Wells 002, 003, 005, 001, 007 and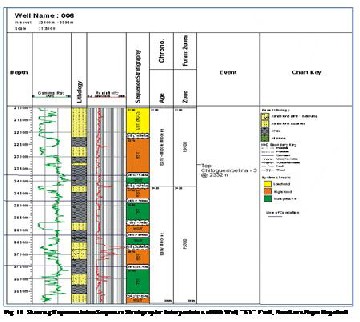
006, respectively.
Table 2. The summary of the sequence stratigraphic interpretation of Well 002 (2820-1218 m)
Interval (m) | Lithology | Stacki ng Pat- tern/Log Moti f | Systems Tract | Depth/type of Chrono- Surface | Date of Chrono- Surface (Ma; after Haq et al ., 1988)/Remarks |
2820-2755 | Sand/shale | Progradational (CU) – Blocky log motif | HST | 2755 -SB | 15.5 (Low SP and high Resistivity Values) |
2755-2700 | Sand/Shale | Retrogradational (FU) | TST | 2700 - MFS | 15.0 (High SP & low Resistivity logs values) |
2700-2460 | Shale/Sand | Progradational (CU) | HST | 2460 -SB | 13.1 (High resistivity & low Sp @ 2460 m) |
2460-1960 | Stacks of Sand/ Shale + Silt iontercalations | Progradation (CU): Blocky SP log Motif | LST (PGC) | 1960 - TS | Sudden deflection of SP log to the left (High SP) = renewed transgression |
1960-1915 | Sand/Shale | Retrogradation (FU) | TST (Short- lived) | 1915 -MFS | 12.8 (High SP, low resistivity and top ooccurrence of Uvigerina sp at the depth of 1866m) |
1915-1640 | Shale/Sand i.e. (Bar Deposits) | Generally Progradational (CU) | HST | 1640 -SB | 12.1 (Low SP & high resistivity) |
1640-1510 | Sand/Silt/Shale | Retrogradation (FU) | TST | 1510 -MFS | 11.5 (High SP and Low Resistivity value) |
1510-1460 | Sand (+ Shale Laminae) | Aggradational | HST | 1460 -SB | 10.6 (Low SP and high resistivity log values at that depth |
1460-1218 | Sand/Silt/Shale | Retrogradation (FU) | TST | Peak not seen | - |
Table 3. The summary of the sequence stratigraphic interpretation of Well 003 (2865-1107 m)
Interval (m) | Lithology | Stacki ng Pat- tern/Log Moti f | Systems Tract | Depth/type of Chrono- Surface | Date of Chrono- Surface (Ma; after Haq et al ., 1988)/Remarks |
2865-2800 | SandSilt//Shale | Retrogradational (FU) | TST | 2800 - MFS | 15.0 (retrogradational SP log motif and rich occurrence of Bolivina sp @ 2700m} |
2800-2400 | Sand/shale intercalations | Progradational (CU) – Blocky log motif | HST | 2400 -SB | 13.1 (Low SP Values) |
2400-1990 | Sand/Shale laminae | Blocky- Serrated | LST (PGC) | 1990 - TS | SP log showed a sudden deflection to the right (i.e. high SP) initiating another transgression |
1990-1960 | Sand/Shale | Retrogradation (FU) | TST (Short interval) | 1960 -MFS | 12.8 (High SP and top ooccurrence of Uvigerinassp at the depth 1920m) |
1960-1900 | Shale/Sand | Progradational (CU) | HST | 1900 -SB | 12.1 (High resistivity @ 1900m) |
1900-1550 | Sand/Silt/Shale | Retrogradation (FU) | TST | 1550 -MFS | 11.5 (High SP) |
1550-1260 | Shale + Sand) | Progradational (CU) | HST | 1260 -SB | 10.6 (Low SP & high resistivity) |
1260-1160 | Sand/Shale | Retrogradation (FU) | TST | 1160 -MFS | 11.5 (High SP and Low Resistivity value) |
1160-1107 | Shale/Silt | Aggradational (Toe section of HST) | HST | Peak not seen | (Late rise of sea level) |
The stratigraphic correlation of the six wells (002, 003, 005, 001,
007 and 006) was carried out using the interpreted Maximum Flood- ing Surfaces (MFSs). The wireline signatures of the genetic wells (002 and 003; 005 and 001 and 007and 006) also aided interpreta- tions between well pairs.
The key surfaces used for correlation between Wells 002, 003, 005 and 001 are the 11.5Ma, 12.8Ma and 15.0Ma MFSs; while the link between these wells and wells 007 and 006 is the 15.9Ma MFS. The other correlation surfaces between Wells 007 and 006 are the
17.4Ma, 19.4Ma and 20.7Ma MFSs (Fig. 12).
IJSER © 2013 http://www.ijser.org
International Journal of Scientific & Engineering Research, Volume 4, Issue 10, October-2013 633
ISSN 2229-5518
Table 4. The Summary of the sequence stratigraphic interpretation of Well 005 (2890-1113 m)
Table 7. The summary of the sequence stratigraphic interpretation of Well 006 (2895-2100 m)
Table 5.The summary of the sequence stratigraphic interpretation of Well 001 (3057-756 m)
Table 6. The summary of the sequence stratigraphic interpretation of Well 007 (3059-2100 m)
The result of the correlation across the well field also showed that Well 002 has three complete and one incomplete 3rd order sequence (SEQs 4 to 7), including a Low Stand Systems Tract (LST) of the prograding wedge or slope complex (PGC) in SEQ 4; Well 003 has two complete and two incomplete 3rd order sequences (SEQs 4 to 7), also with the LST (PGC) in SEQ 4; Well 005 has three complete 3rd order sequences (SEQs 5 to 7) and two incomplete sequences; Well
001 has five complete 3rd order sequences (SEQs 3 to 7) capped by a
PGC unit in SEQ 7. Wells 007 and 006 both have four complete 3rd
order sequences also capped by the PGC in SEQ 4 (Fig. 12).
The LST in SEQ 4 delineated in four wells (002, 003, 007 and 006)
was not observed in Wells 005 and 001. The unit may have been ed before the deposition of the overlyng TST.
IJSER © 2013 http://www.ijser.org
International Journal of Scientific & Engineering Research, Volume 4, Issue 10, October-2013 634
ISSN 2229-5518
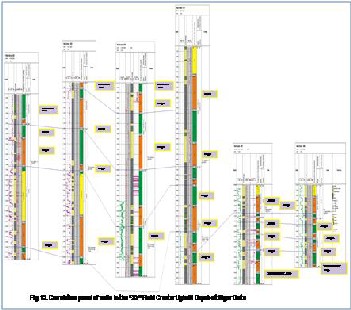
Another PGC (LST), delineated in SEQ 7 in the 001 well was not encountered in any of the other wells (Fig. 12). Well 001 has the most extensive log wherein the shallower units (3057-756 m) were logged. The continuity of this predominantly sandy systems tract in SEQ 7 could not be ascertained based on the available data as sec- tions that represent the upper sections/sequences (less that 750 m) in the well field were not provided.
The key surfaces used for correlation between Wells 003, 002, 005 and 001 (i.e. 11.5Ma, 12.8Ma and 15.0Ma MFSs) were delineated at different depths in the four wells (Table 8).
From the foregoing (Table 8), it can be established that the “XY” Field is faulted and/or have its accompanying clinoforms dipping in one direction. Normal (growth) fault regime is prevalent in the Ter- tiary Niger Delta of Nigeria, hence, displacements resulting from normal faults is inferred for the sequences in the “XY” field. Well
003 is on the downthrown side of Well 002 while Well 005 is on the downthrown side of Well 001 (Table 8). Similarly, the variation in depth of occurrence of the 15.9Ma chrono-surface in Wells 005, 007 and 006 and that for other surfaces linking Wells 007 and 006 shown in table 9 also highlight the inherent down-dropping of Well 006 relative to Well 007. The throw is relatively small (about 5m) com- pared to that between Wells 005 and 006 (385m). This discontinuity and the down-dropping of strata in the well field fingerprint the de- gree of compartmentalization in the “XY” well field.
The studied stratigraphic column in the “XY” field is comprised of a total of nine genetic sequences made up of seven complete 3rd order sequences (SEQ 1-7) and two incomplete sequences. Sequence dis- tribution in the field showed that Well 002 has three complete and one incomplete 3rd order sequence (SEQs 4 to 7), including a Low Stand Systems Tract (LST) of the prograding wedge or slope com- plex (PGC) in SEQ 4; Well 003 has two complete and two incom- plete 3rd order sequences (SEQs 4 to 7), also with the LST (PGC) in SEQ 4; Well 005 has three complete 3rd order sequences (SEQs 5 to
7) and two incomplete sequences; Well 001 has five complete 3rd order sequences (SEQs 3 to 7) capped by a PGC unit in SEQ 7. Wells 007 and 006 both have four complete 3rd order sequences also capped by the PGC in SEQ 4 (Fig. 12).
The other accompanying systems tracts in the sequences, however, formed distinct deltaic complexes consisting of a number of genet- ically linked retrogradational, progradational and aggradational sys- tems comprising of TST, HST and LST. The major architectural faci- es elements of the systems include: shoreface deposits, channel fills, prodelta shales and prograding slope complexes.
The overall similarity recorded in the organization and distribu- tion pattern of the sequences and systems tracts in the “XY” Field and the observed gradational migration and gentle sloping depositional systems in non-faulted blocks depict clinoforms that are laterally continuous and traceable in the subsurface. For example, the LST in SEQ 4 slopes gently from wells 006 to 002 (Table 10). Table 10. Showing trend of the LST in
Direction of Gentle Slope in the “XY” Field (?)
It is also noted that the absence of this depositional system (LST) in wells 005 and 001 is probably the due to subsidence and erosion, which corroborates the existence of episodic and asymmetrical subsidence in the Tertiary and Quaternary periods [23]. These structures are probably responsible for the displacements (faults) that have compartmentalized the “XY” Well field.
Hence, local tectonics affected the sedimentation pattern in the “XY” Well Field. Stratigraphic base level changes caused by eustacy also played a role in the development of the sequences since the delineated MFSs matched with major sea level rises recorded in the Chronostratigraphic Chart of [19].
A tectono-eustatic control is therefore, proposed for the devel- opment of stratigraphic sequences of the Tertiary strata in the Greater Ughelli Depobelt, Niger Delta.
The “XY” Field is compartmentalized into three major blocks by synthetic faults which are suggested to have formed as a result of subsidence. The weight of the ensuing sand accumulations in the sequences may also have triggered faulting in the well field [24]. The main compartments are: Block 1 comprising of Wells 002 and 003; 2
IJSER © 2013 http://www.ijser.org
International Journal of Scientific & Engineering Research, Volume 4, Issue 10, October-2013 635
ISSN 2229-5518
housing Wells 001 and 005 and Block 3 with Wells 007 and 006. The throw between Blocks 1 and 2 is relatively small comapared to that between Blocks 2 and 3. This trend is consistent with the growth fault pattern in the Niger Delta. The compartmentalization of the “XY” field as a result of rifted fault blocks would no doubt reduce the areal extent and continuity of the reservoirs in the “XY” Field for exploration and development.
The most laterally continuous sandstone unit in the well field, how- ever, is the Prograding Wedge Complex (LST) sands of SEQ 4 ob- serevd in Blocks 1 and 3 (Fig. 12). Despite the obvious truncations observed in Wells 5 and 1 of Block 2, SEQ 4 was also observed to be laterally significant in Wells 7 and 6.
The sands of this Lowstand Systems Tracts (LST) of the earliest sequences (SEQ 4), within each of the two blocks, therefore hold great potentials for hydrocarbon accumulation and can be targeted as the major petroleum plays in the “XY” Field. Accumulation of hy- drocarbons can occur in the structural traps provided by the de- formed LST reservoirs of SEQ 4, if the other elements of a petrole- um system (source rock, timing, seal rock) are present. It has been widely reported that growth fault-related structural traps form the dominant traps in the petroliferous Niger Delta [24].
However, part of the reasons why sequence stratigraphy was ad- vanced in the study area was to discover subtle stratigraphic traps that result from rapid facies changes occurring between successive systems tracts. The cyclic pattern of the alternating Transgressive Systems Tract (TST) and the Highstand Systems Tract (HST) in the studied wells is indicative of a good environment for organic matter accumulation and generation. The pelagic shales of the TST could form good source rocks and cap rocks for the underlying and overly- ing HST and LST given the right conditions.
Reservoir quality sands within the HST could also serve as good reservoirs while faults, active in this area, could serve as traps and/or conduits for migration of hydrocarbons. The distal shale toes of the prograding wedge and transgressive shales would form seals for (potential) stratigraphic traps in the study area. In fact the alternation of HST and TST sands and shales respectively, provides a union of reservoir and seal rocks that are essential for hydrocar- bon accumulation and stratigraphic trapping.
The sands within the prograding wedge complex have good reser- voir properties which are being sealed by the transgressive shales, thus also creating potential stratigraphic traps.
The task of achieving Nigeria’s crude oil reserves target of about 40 billion barrels and production of increased volumes of Liquefied Natural Gas (LNG) in order to meet increasesd export and domestic demands necitated the search for oil and gas with a more accurate technique in the Greater Ughelli Depobelt, Niger Delta.
Sequence stratigraphic technique was used to subdivide the strati-
graphic column of the “XY” well field into sequences and systems tracts based on the integration of well logs and biostratigraphic data. The technique also delineated quality petroleum plays (reservoirs), their continuity and other elements of the petroleum system (source, traps, e.t.c) for the sustainable development of the resource in the Niger Delta Basin.
The summary of the sequence stratigraphic interpretation of Wells
002 (2820-1218m), 003 (2865-1107 m), 005 (2890-1113 m), 001 (3057-756 m), 007 (3059-2800 m) and Well 006 (2895-2800 m) re- vealed a total of nine sequences comprising of seven complete and two incomplete 3rd order sequences.
The accompanying systems tracts in the sequences that formed dis- tinct deltaic complexes consisted of a number of genetically linked retrogradational, progradational and aggradational deltaic systems that recorded similar organization and spatial distribution depict- ing a number of clinoforms which would be traceable in the subsur- face.
The stratigraphic correlation of the six wells carried out using the interpreted Maximum Flooding Surfaces (MFSs) revealed the exist- ence of faults/discontinuities, which has compartmentalized the “XY” Well. The faults could form structural traps and conduits for migration of generated hydrocarbon if the other elements of a petro- leum system (source rock, timing, seal rock) are present.
The absence LST of SEQ 4 in wells 005 and 001 is attributed to sub- sidence and erosion, which corroborated the existence of episodic and asymmetrical subsidence in the Tertiary and Quaternary periods. Local tectonics therefore, affected the sedimentation pattern in the “XY” Well Field, while stratigraphic base level changes caused by eustacy also played a role in the develop- ment of the sequences.
The sands of the Lowstand Systems Tracts (LST) in SEQ 4, within each of the mini-basins hold great potentials for hydrocarbon accu- mulation and can be targeted as the main petroleum plays in the “XY” Field.
The cyclic alternation Transgressive Systems Tracts (TST) and the Highstand Systems Tracts (HST) in the studied wells is indicative of good environments for organic matter accumulation and generation. The pelagic shales of the TST could form good source rocks and cap rocks for the underlying and overlying reservoirs of the HST and LST given the right conditions.
I am particularly grateful to Dr. K.O. Ladipo and the man-
agement of Shell Petroleum and Development Company
(SPDC), Port Harcourt, the Directorate of Petroleum Resources
(DPR), Nigeria and Dr. Mammah of the University of Nigeria,
Nsukka, for graciously providing the data used for this re-
search.
[1] A. Avuru, “Structure and Operation of the Nigerian Petroleum Industry” - Oil and Gas Financing in Nigeria: Issues, Challeng- es and Prospects, Avuru A. (Ed.). Chartered Institute of Bankers of Nigeia: Ibadan-Nigeria, 2006.
[2] K.K. Nwozor, M.L. Omudu, B.M. Ozumba, C.J. Egbuachor, A.G. Onwuemesi and O.L. Anike, “Quantitative Evidence of Secondary Mechanisms of Overpressure Generation: Insights from Parts of Onshore Niger Delta”. Nigeria Petroleum Tech- nology Development Journal: Vol. 3, No.1, pp., 2013.
[3] J.C. Van Wagoner, R.M. Mitchum, K.M. Campion and V.D.
Rahamanian, “Siliciclastic Sequence Stratigraphy in Well logs, Cores and Outcrops: Concepts for High Resolution Correlation of time and facies.” AAPG Bull., Vol. 7, pp. 1-55, 1990.
IJSER © 2013 http://www.ijser.org
International Journal of Scientific & Engineering Research, Volume 4, Issue 10, October-2013 636
ISSN 2229-5518
[4] R.M. Mitchum Jr., P.R. Vail, and S. Thompson, “Seismic Se- quence and Global Changes of the Sea Level, Part 2: the Depo- sitional Sequence as a basic unit fro Stratigraphic Analysis”
:Payton, C.E., (Ed.), Seismic Stratigraphy- Application to Hy- drocarbon Exploration. Am. Assoc. Petrol. Geol. Mem., Vol. 26, pp.53-62, 1977.
[5] P.R. Vail and W.W. Wornadt, “Well Log Seismic Sequence Stra- tigraphy Course notes for SPDC Sequence Stratigraphy Course” Nov. 1992, Port Harcourt.
[6] D. Emery and K.J. Myers, “Sequence Stratigraphy”: Blackwell
Science Oxford: 297pp, 1996.
[7] C.E. Bassey and A.O. Ojesina, “Sequence Stratigraic Interpreta- tion of E-bock in western offshore, Niger Delta, Nigeria”. Glob- al J. Appl. Sci.: Vol 5, p227-233, 1999.
[8] J. Neal, D. Risch and P. Vail, “Sequence Stratigraphy—A Global
Theory for Local Success,” Oilfield Review, Vol. 2, No. 1, pp.
51-62, 1993.
[9] H. Doust and E. Omatsola, “Niger Delta”: J.D. Edwards, P.A. Santogrossi (Eds.), Divergent/Passive Margin Basins. American Association of Petroleum Geologists Memoir: Vol. 48, pp.201–238, 1990.
[10] H. Kulke, “Nigeria”: Kulke, H.,(ed.), Regional Petroleum Geol- ogy of the World. Part II: Africa, America, Australia and Ant- arctica: Berlin, Gebrüder Borntraeger, pp. 143-172, 1995.
[11] J. Hospers, “Gravity Field and Structure of the Niger Delta,
Nigeria, West Africa”. Geological Society of American Bulletin:
Vol. 76, pp. 407-422, 1965
[12] A. Kaplan, C.U. Lusser, and I.O. Norton, “Tectonic Map of the World, panel 10”: American Association of Petroleum Geolo- gists, Tulsa, scale 1:10,000,000. 1994.
[13] B.D. Evamy, J. Haremboure, P. Kamerling, W.A. Knaap, F.A.
Molloy, and P.H. Rowlands, “Hydrocarbon habitat of Ter- tiary Niger delta.” American Association of Petroleum Ge- ologists Bulletin: Vol. 62, pp.1–39, 1978.
[14] K.C. Short and A.J. Stauble, “Outline of geology of Niger Del- ta” AAPG, Bulletin: Vol. 51, No. 5, pp.761-779, 1967.
[15] A.J. Whiteman, “Nigeria: Its Petroleum Geology, Resources and
Potentil”. Graham and Trotman, London, 39pp, 1967
[16] H. Xiao and J. Suppe, “Origin of Rollover”: American Associa- tion of Petroleum Geologists Bulletin: Vol. 76, pp. 509-229,
1992.
[17] T.R. Klett, T.S. Ahlbrandt, J.W. oker Schm and J.L. Dolton, “Ranking of the world’s oil and gas provinces by known petro- leum volumes” U.S. Geological Survey Open-file Report, pp.
97–463, 1997.
[18] L.W. Tuttle, R.R Charpentier and M.E. Brownfield, “The Niger Delta Petroleum System: Niger Delta Province, Nigeria, Came- roon, and Equatorial Guinea, Africa” U.S. Geological Survey World Energy Project, Open-File Report: pp. 99-50-H, 1999.
[19] B.U. Haq, J. Hardenbol, and P.R. Vail, “Mesozoic and Ce- nozoic Chronostratigraphy and cycles of sea-level change”: Wilgus, C.K., Hastings, B.S., Kendall, C.G.St.C.. Posamen- tier, H.W., Ross, C.A., Van Wagoner, J.C. (Eds.), Sea-level Changes: An Integrated Approach. SEPM Special Publica- tion: Vol. 42, pp. 72–108, 1988.
[20] O. Catuneanu, “Sequence stratigraphy of clastic systems: con- cepts, merits, and pitfalls.” Geological Society of Africa Presi- dential Review No. 1. Journal of African Earth Sciences, Vol.
35, pp. 1–43, 2002.
[21] S.O. Onyekuru, E.C. Ibelegbu, C.J. Iwuagwu, G.E. Akan and C.Z. Akaolisa, “Sequence Stratigraphic Analysis of “XB Field”, Central Swamp Depobelt, Niger Delta Basin, Southern Nigeria”. International Journal of Geosciences: Vol. 3, No. 2, pp. 237-
257, 2012.
[22] G.C. Obi, and C.O. Okogbue, “Sedimentary response to tec- tonism in the Campanian-Maastrichtian succession, Anam- bra Basin, Southeastern Nigerian.” Journal Africa Earth Sciences, Vol. 38, pp. 99–108, 2004.
[23] J.P. Bhattacharya and H.W. Posamentier, “Sequence Stratigra- phy and Allostratigraphic Applications in the Alberta Foreland Basin” Geological Atlas of the Western Canada Sedimentary Basin, Chapter 25, 2012.
[24] T.J.A. Reijers, Stratigraphy and sedimentology of the Niger
Delta, Geologos, Vol. 17 (3): pp. 133–162, 2011,
IJSER © 2013 http://www.ijser.org