We make a plot both the variance of tweets score and close prices of apple over time. The plot is shown below:
International Journal of Scientific & Engineering Research, Volume 5, Issue 5, May-2014 44
ISSN 2229-5518
Stock Market Prediction Using Twitter Mood
Sandip Kumar Dey
Abstract--In the modern times of the information age, the magnitude of social media activity has reached unprecedented levels. Twitter is one such popular online social networking and micro-blogging service, which enables hundreds of millions of users share short messages in real time about events worth broad attention expressing public opinion. In this paper, we investigate the relationship between Twitter opinion and stock price movement. Specifically, we wish to see if, and how well sentiment information extracted from twitter can be used to predict future shifts in prices. Stock market forecasting is a popular and important topic in financial and academic studies. Time series analysis is the most common and fundamental method used to perform this task. Tweets related to selected company over the last three months are collected. The result of this experiment shows the significant correlation between the changes in daily stock price and changes in polarity of tweets computed using sentiment analysis of tweets.
Keywords—Apple, Stock Market Prediction, Twitter, Sentiment Analysis, Regression
—————————— ——————————
forecast stock price [4], [5].
Mining twitter data to forecast stock market behavior is a very recent research topic that appears to present
promising results [1], [2], [3]. There are two main thoughts
on the financial markets, Technical and fundamental
analysis. Fundamental analysis attempts to determine a
stock value by focusing on underlying factors like news
that affects a company’s business and its future Prospects. Technical analysis, on the other hand, looks at the price movement of a stock and uses this data to predict the future price movement.
In this study, both fundamental and technical data on selected stocks are collected from the Internet. Our selected company is Apple Inc. (AAPL). We choose the stock mainly because of it is popular and there is a large amount of information on twitter that are relevant to our research and can facilitate us in evaluating ambiguous news. Our fundamental data is in the form of opinions in twitter whereas our technical data is in the form of historical stock prices. Scholars and researchers have developed many techniques to evaluate news. The most popular technique is text mining.
We notice that tweets contain lots of information about economic activity and with the development of social media there is lots of economic news released every day. This news also has a high influence factor with stock price.
Therefore mining that news has great value. The news is in the form of unstructured text data and some researchers have shown that unstructured text data can be used to help
————————————————
Author : Sandip Kumar Dey
Master of technology in department of Computer Science And Engineering
Institute Of Engineering And Management
E-mail: iamsandip.kumar@gmail.com
In this study, we first apply the conventional ARMA time series analysis on the historical daily stock prices of apple and obtain forecasting result. Then we proposed an algorithm to evaluate polarity of tweets related to apple stock using information from twitter. We then regress the changes in daily stock price on the score of tweets every day. We aim to use the regression result to study the relationship between tweets polarity and stock price changes.
The basic theory regarding stock price forecasting is the Efficient Market hypothesis (EMH).It is an investment theory which asserts that financial markets are “ informationally efficient” that it is impossible to consistently predict future stock prices and to beat the market because prices already incorporate and reflect all relevant information that is known by all investors.Supporters of this model believe that it is pointless to search for undervalued stocks or try to predict trends in stock market through any technique from fundamental to technical analysis. However the degree of market efficiency is controversial and many believe that one can beat the market in a short period of time [6].
Time series analysis covers a large number of forecasting methods. Researchers have developed numerous modifications to the basis ARMA model and found considerable success in these methods. The modifications include clustering time series from ARMA models with clipped data [7], a fuzzy neural network approach [8], and support vector machine model [9]. Almost all the studies suggest that additional factors should be taken into account on top of the basic or unmodified model. The most common and important one of such factors is the online news information related to stock.
Many researchers attempt to use textual information in the public media to evaluate news. To perform this task,
IJSER © 2014 http://www.ijser.org
International Journal of Scientific & Engineering Research, Volume 5, Issue 5, May-2014 45
ISSN 2229-5518
various methods are developed, such as the AZFin text system [10], a matrix form text mining system [11] and named entity representation scheme [12]. All of these processes require complex algorithm that performs text extraction and evaluation from online source.
The stock price of apple from the first week of January 2014 to the first week of April 2014 are collected from Yahoo finance website [13]. This data set contains the open, high, low, close and adjusted closing prices of apple stock every day throughout three months. It also contains trading volume values on these days. To achieve consistency, the close prices are used as a general measure of stock price of apple.
We collected tweets related to apple from first week of January to the first week of April 2014 from twitter through the twitter search API [14] using data mining software R [15]. Every tweet is assigned a polarity value by using sentiment analysis in order to determine whether the tweet is positive or negative or neutral. Positive tweets are assigned a value of +1 or +2 or +3.Negative tweets are assigned a value of -1 or -2 or -3 and if the tweets are highly ambiguous than the tweet is assigned to zero.
The starting point of the Twitter data is set to earlier than the starting point of the stock data because we eventually want to study the relationship between news at one time and stock price at the later time.
Sentiment analysis refers to the use of natural language processing, text mining and computational linguistics identify and extract subjective information in the source materials. To score each tweet we apply the sentiment analysis using Hu and Liu lexicon, a list of positive and negative words [16]. The process is as follows:
First, each tweet is tokenized into word lists. The parsing algorithm separates the tweets using white space and punctuations, while accounting for common syntax found in tweets, such as URLs. We remove stop words, punctuations, URLs and compare each token with positive and negative words. To assign a numeric score to each tweet, we simply subtract the number of occurrences of negative words from the number of positive occurrences. Larger negative score will correspond to more negative expressions of sentiment, neutral tweets should set to zero and very positive tweets should score larger positive occurrences.
On any day within the past three months, the value of tweets on that date is the sum of all tweet scores on that date. We then calculate the difference between the score of
each day tweets. We also calculate the variance of daily close price of stock.
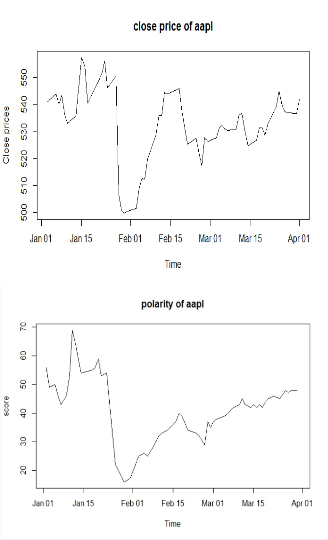
After computing the variance of score for every single day in the past three months we plot the scores over time to compare the variances of both the tweet score and close prices of stock.
We make a plot both the variance of tweets score and close prices of apple over time. The plot is shown below:
-
Figure 1. A comparison between daily close price of apple and polarity of apple tweets
These plots show that the tweet score and the price of the stock decreases on the last week of January and then increase in general over time. This observation implies that the correlation between stock price and tweet values are significant.
IJSER © 2014 http://www.ijser.org
International Journal of Scientific & Engineering Research, Volume 5, Issue 5, May-2014 46
ISSN 2229-5518
In order to study the relationship between tweets at a certain time and stock price at a later time, we regress the daily stock price changes on the tweet score. The result is shown below:
R-squared value | Regression Coefficient | Correlation Coefficient | P-value |
0.6789 | 1.32904 | 0.7955 | 6.192e-16 |
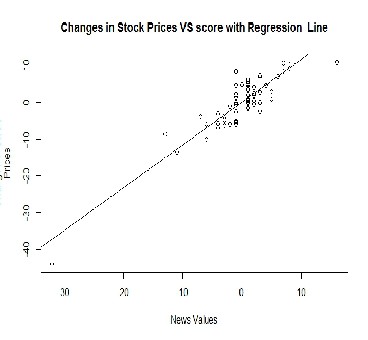
R-squared is a statistical measure of how close the data are to the fitted regression line. We notice that the R-squared value that shows the proportion of the variability in the daily stock price changes is good (0.6789)
Regression coefficients represent the mean change in the response variable for one unit of change in the predictor variable while holding other predictors in the model constant.The regression result shows that there seems to be a significant and positive correlation (1.32904) between the daily stock prices and the tweet score. That is one unit increase in tweet score change should result in a 1.329 unit increase in stock price change every day.
Correlation Coefficient is a measure of the strength of the linear association between two variables. The correlation will always between -1.0 and +1.0. If the correlation is positive, we have a positive relationship. If it is negative, the relationship is negative. Our result shows the correlation coefficient value is 0.7955 that means stock price and tweets polarity is positively linearly related.
Our p-value is much less than 0.05, so we reject the null hypothesis that β = 0. Hence there is a significant relationship between the stock price and tweet polarity in the linear regression model .
In order to further examine the regression data, we plot the daily stock price changes against the tweet scores with a regression line.
Figure 2. Daily stock price changes against the tweets score with a regression line
The judgment of whether a piece of the tweet is good or bad is depends upon the positive and negative words. People might have different and opposite interpretations of the same information. It is possible that some of these tweets are deemed negative in our analysis, but actually considered good news by popular opinion. It is hard to accurately and systematically determine whether tweets are good or bad in the opinion of the majority of the public when there is ambiguity. Our analysis shows significant correlation between tweet score and daily stock price changes. But it is likely that the result is dominated by a number of influential observations and is not reflective of the general trend. Improvement can be made to our data collection and analysis method. Further researches can be done with possible improvements such as more refined search data and more accurate algorithm to compute tweet score.
[1] J. Boleyn, H. Mao and X. Zeng. Twitter mood predicts the stock market. Journal of computational Science, 2(1):1-8,2011.
[2] T. Sprenger and I. Welpe. Tweets and trades: The information content of stock microblogs. Social Science, Research network Working Paper Series, pages1-89,2010
[3] Twitter mood predicts the stock market. Johan Bollen, Huina Mao, Xiao-Jun
Zeng
IJSER © 2014 http://www.ijser.org
International Journal of Scientific & Engineering Research, Volume 5, Issue 5, May-2014 47
ISSN 2229-5518
[4] B.Wiithrich, D.Permunetilleke, S.Leung, V.Cho, J.Zhang and W.lam. “Daily prediction of major stock indices from textual data” in KDD, 1998, pp. 364-368
[5] V. Cho and B. Wiithrich, “Combining forecast from multiple textual data sources” in PAKDD, Lecture Noted in Computer Science, N.Zhong and L.Zhou, Eds, vol. 1574,Springer, 1999,pp. 1855-1867, 2007.
[6] Gili Yen and Cheng-Few Lee, “Efficient Market Hypothesis (EMH): Past, Present and Future” in review of Pacific Basin Financial Markets and policies,vol11,Issue 2,2008
[7] A. J. Bagnall and G. Janacek, “Clustering Time Series from ARMA Models with Clipped data” Technical Report CMP-C04-01, School of Computing Sciences, University of East Anglia, 2004.
[8] D.Marcek, “stock Price Forecasting: statistical, Classical and Fuzzy Neural network Approach” in MDAI, V. Torra and Y.Narukawa, Eds , vol. 3131. Springer,2004
[9] “A Hybrid ARIMA and Support Vector Machines Model in stock Price Forecasting ” in Omega, The International Journal Of Management Sciences.Vol. 33, no. 3, 2005
[10 Schumaker, Robert p, and Hsinchun Chen. “Textual Analysis Of stock market prediction Using Breaking Financial News: The AZFin text system.” ACM Transactions on Information Systems (TOIS) 27.2 (2009)
[11] Deng, Shangkun,et al.”Combining Technical Analysis With Sentiment analysis for stock Price Prediction. ” Dependable, Autonomic and secure Computing(DASC),2011 IEEE Ninth International Conference on IEEE,2011
[12] Babu, m.Suresh, DRN Geethanjali, and V. Ratna Kumari, “Textual analysis of Stock Market Prediction Using Financial News Articles.” The technology World Quarterly Journal(2010).
[13] http://finance.yahoo.com/q/hp?s=AAPL+Historical+Prices
[14] https://dev.twitter.com/docs/using-search
[15] http://cran.r-project.org/
[16] http://www.cs.uic.edu/~liub/FBS/sentiment-analysis.html#lexicon
IJSER © 2014 http://www.ijser.org