International Journal of Scientific & Engineering Research, Volume 4, Issue 9, September-2013 93
ISSN 2229-5518
Spatio-Temporal Representation of
Disaster System
Ms. P. Vedavathi , Mr. T. Raghunatha Reddy , Dr. M. Nagabhushana Rao
Abstract— Modernization in information technology has enabled the collection and processing of vast amounts of spatial data. Spatial data mining extracts previously unknown , potentially useful patterns from huge amounts of spatial data. Spatial data are collected from the spatial objects. The col- lected data is preprocessed (for replacing the missing values) using the W EKA data mining tool. For the preprocessed data, association rule ( apriori algorithm) is applied for identifying the frequent item sets. Disaster affected areas were identified. Visualization of the spatial data on Geographical In- formation Systems (GIS) using different colored pinpoints per quarter of a year. From that area at high risk of disaster were analyzed , then the predicted spatial data will be forwarded to health organizations for conducting campaigns. Our focus is to predict the disaster , design the spatio-temporal trees per quarter of a year and to visualize the knowledge in GIS.
Index Terms— Collocation rule, Dengue Fever , Geographical Information Systems , Pre-processing , Spatial Data Mining , Spatio-temporal trees
1 INTRODUCTION
—————————— ——————————
patial data mining is an important extension that discov- ers the non-trivial and potentially useful datasets from large data sets. Extracting useful patterns from huge spa-
tial databases , which covers various technical overheads like, spatial data infrastructures, spatial relationships, spatial auto- correlation and some others related to spatial-geometry [1]. Temporal data mining is the extraction of data based on time- series [2]. Temporal data mining can be defined as the activity of looking for interesting correlations or patterns in large sets of temporal data accumulated for other purposes. Combining the semantic support from spatial data mining and temporal data mining, with a slender correlation, the concept of spatio - temporal mining helps us to give, the temporal meaning to the evolving and ever changing collocation rules [3]. However, the feature fuzzy or Boolean, the problem of collocation is wheth- er a static or a dynamic is difficult to many GIS application users. However, the rules are characterized as outdated, obso- lete which does not satisfy the decisive factors of GIS appre- hension, such are eliminated. And with the historical rules that describe the incident, which are mandatory, in addition to which are used to identify the state transformations in terms of size and shape of the elementary parts of the rules are of very important concern when related to spatial, many algo- rithms for mining the spatio-temporal inference encompasses much significance [4]. Most typically the potentiality of trans- formations occurred to the collocation, is to understand the time components related to the transformations and mining the temporal sequences that identify the series of transfor- mations.
2 HISTORY
Spatial data mining extracts potentially useful patterns from large databases [5]. The problem of discovering the collocation rules of spatial data is introduced by Shashi Shekhar et. Al. It was followed by successive refinement and improvement and given a discrete data model representation [6]. In the concep- tual notation for the collocation that is designed for non-
spatial features of the spatial objects have been discussed, supporting to that, a transformation has been deduced [7]. To support further experimental work the semantic representa- tion of the data structure to store the collocation has designed [8].
According to , the spatio-temporal mining will be the sub- jective principle that will establish the correlation between the time components and the spatial aspects [9]. But the experi- ment carried over in this work, is related to the time compo- nents that are defined as even with a broader intervals and the spatial knowledge than the spatial objects.
Examples of information stored in the GIS are: patients’ particulars, locations of Aedes breeding, larval densities, spe- cies of vectors, habitat types, premises types, and ovitrap loca- tions [10]. The GIS enables us to visualize at a glance “hot spots” where cases or breeding are concentrated so that early control operations can be implemented. We can also perform spatial and temporal analyses of the data for future planning, such as the review of dengue and cholera sensitive areas and for day-to-day operation planning such as the boundary of control operations in outbreak areas, the progression of an outbreak etc.
Dengue (pronounced den’ gee) the most prevalent Arthro- pod-borne viral (Arbor virus) belonging to the family Fla- viviridae. The major dengue vector in urban areas is Aedes aegypti but Aedes albopticus is also present. It breeds in pools of water [11]. Symptoms include severe and continuous pain in the abdomen, bleeding from the nose, mouth , high fever, severe headache , retro-orbital pain, severe joint pain , muscle pains , general weakness, vomiting , pale, cold skin. There is no specific treatment for dengue, but closely medical attention and clinical management saves the lives of many patients [12]. At present, the only method of controlling dengue is to com- bat the vector mosquito through chemical control and envi- ronmental management. The disease proceeds in possibly three stages:
(a) Invasion (b) Collapse (c) Reaction
IJSER © 2013 http://www.ijser.org
International Journal of Scientific & Engineering Research, Volume 4, Issue 9, September-2013 94
ISSN 2229-5518
2.1 Proposed System
Patient database is collected. The epidemic i.e dengue is iden- tified using spatial mining techniques. Then the predicted data is visualized on a map based on the time series for every quar- ter of a year for the disease predicted spatial data [13]. The total work is three fold, first step is to structure the inference that collocation with transformations , the second step is to predict the disease affected areas using apriori algorithm , the third step is to visualize the knowledge on spatial data [14].
3 COLLOCATION IDENTIFICATION
3.1 Detection of the Epidemic
Risk areas are identified by applying collocation rules to the symptoms [15]. The pattern of collocation for the problem in the nearby region with high probability is as follows
C: {cause of epidemic} → {causative agent, infection sources}
Where’ C’ is the collocation rule. By applying Collocation rules to the symptoms , the severity of the disease is identified [15]. The collocation rule is applied to the symptoms. High Fever, Severe Headache → Retro orbital , Severe Joint and Muscle Pains → General Weakness, Vomiting → Rashes, Damage of blood → Bleeding from the nose, gums, or under the skin Hemorrhagic fever → Dengue Death
4 ALGORITHM
Using the raw data the disaster is identified and represented in GIS [16]. The algorithm is as follows
1. From the spatial objects , raw data are collected
2. Noisy data is preprocessed using WEKA tool
3. Application of collocation rules
4. Application of the predicate of space i.e. nearby
5. The disaster affected area is identified
6. Visualization of knowledge in GIS
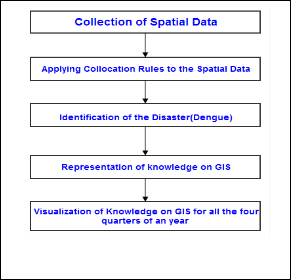
5 DATA FLOW DIAGRAM
Fig. 1.Flow chart of spatio-Temporal Representation of
Disaster System.
6 IDENTIFICATION OF DISASTER AFFECTED AREAS
6.1 Raw Data
Spatial data related to the spatial objects i.e. patients were col- lected. Dengue disease includes different symptoms like high fever, muscle pain , prostration , swollen lymph nodes , nau- sea , bleeding from nose etc. For presence of each symptom a binary value “1” is assigned and for absence of each symptom a binary value “0” is assigned. Some noisy data (missing val- ues) were found in the raw data. The collected raw data is as shown below in the TABLE 1
TABLE 1
RAW SPATIAL DATA
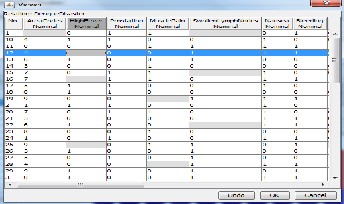
Each record refers to one patient . In the presence of each symptom a binary value “1” is read and in the absence of each symptom a binary value “0” reads in all the records.
6.2 Preprocessed Data
TABLE 2
PREPROCESSED SPATIAL DATA USING THE WEKA DM TOOL
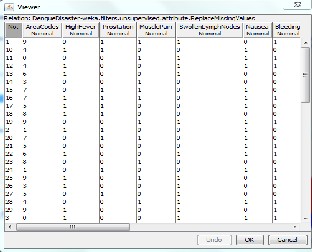
Noisy data (in the raw data) is preprocessed using the WEKA data mining tool.
IJSER © 2013 http://www.ijser.org
International Journal of Scientific & Engineering Research, Volume 4, Issue 9, September-2013 95
ISSN 2229-5518
The raw data is preprocessed using the WEKA data mining tool. Missing values are replaced by the mean values or by the highest occurred value. The noisy data is pre processed as shown above in the TABLE 2
6.3 Frequent Item Set generation
Collocation rule is applied to the data. Based on the apriori algorithm 1-item sets, 2-item sets and 3-item sets were gener- ated
Apriori Algorithm
Apriori algorithm was developed by Agrawal and Srikant
1994. Apriori algorithm is frequently used to operate on
transactional databases. It is an innovative way to find
association rules on a large scale, allowing implication
outcomes that consist of more than one item (based on the
minimum support threshold). Using apriori algorithm we can
perform frequent itemset mining and association rule
learning.
6.4 Report Generation
The report containing dengue affected areas is as shown below in the Fig. 2.
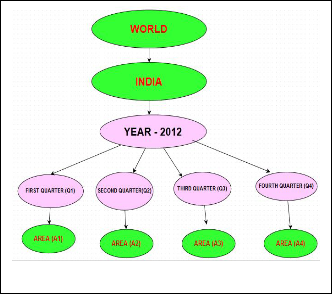
7.1 Spatio-Temporal Tree
Spatio-temporal tree is a tree consisting of spatial data and temporal data. Temporal data is a data related to time-series. The temporal series of four quarters of a year is considered for the spatial data. The spatio - temporal tree is as shown below in the Fig. 3.
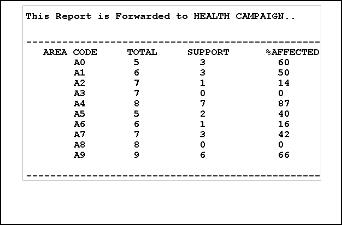
Fig. 3. Spatial tree for the spatial data is represented.
7.2 Results
Fig. 2. Disaster Report is sent to health organizations for conduct- ing campaigns in the areas at high risk.
7 VISUALIZATION OF SPATIAL DATA ON GIS
Spatio-temporal mining is an upcoming research field which
includes the development and practice of innovative tech- niques for the determination of large spatio-temporal data- bases [17]. Spatial mining is the extraction of previously un- known, hidden spatial data from large amounts of spatial and non-spatial data [18]. Temporal mining is the extraction of useful information from temporal data. Both temporal dimen- sions and spatial dimensions add complexity to data mining tasks [19]. Our focus is on spatio-temporal tree which de- scribes the spatial data at different time series [20]. Spatial data is a collection of spatial data. In this paper, temporal data in- clude information on spatial data for every quarterly time se- ries. The spatio - temporal tree is drawn for every quarter of a year. Therefore we can visualize the knowledge in GIS for eve-
ry quarter of a year [20].
First Quarter

All the states in India are visualized in GIS using colored pin points i.e. green , orange , pink , yellow. Green colored pin points indicate that the area is in safe zone , yellow colored pinpoints indicate that the area is in the least dangerous zone , pink colored pinpoints indicate that area is more dangerous zone and red colored pinpoints indicate that area is in the risk zone. Visualization of knowledge for Q1 of a year in GIS is as shown below in the Fig. 4.
Fig. 4. Visualization of knowledge for the I quarter of a year in GIS.
IJSER © 2013 http://www.ijser.org
International Journal of Scientific & Engineering Research, Volume 4, Issue 9, September-2013 96
ISSN 2229-5518
Second Quarter
The changes are observed in the knowledge from Q1 to Q2.
Andra Pradesh is changed from most dangerous zone to least
dangerous zone. The pinpoint color of Andhra Pradesh is
changed from red to yellow in GIS. Andaman & Nicobar is-
lands in GIS changed from most dangerous zone to more dan-
gerous zone. The pinpoint color of Andaman & Nicobar is-
lands is changed from red to pink in GIS. The changes from
Q1 to Q2 are as shown below in Fig. 5 with red colored ar-
rowed oval symbols.
Fourth Quarter
West Bengal (which is labelled ) is changed from most dan-
gerous zone to least dangerous zone. The pinpoint color of
West Bengal in GIS is changed from red to yellow. The chang-
es from Q3 to Q4 are as shown below in Fig. 7 with red col-
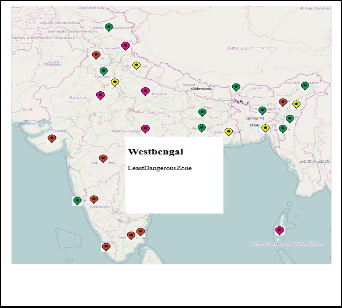
ored arrowed oval symbols.
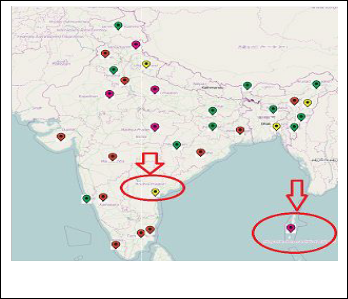
Fig. 7. Visualization of knowledge for the IV quarter of a year in
GIS.
Fig. 5. Visualization of knowledge for the II quarter of a year in GIS.
Third Quarter
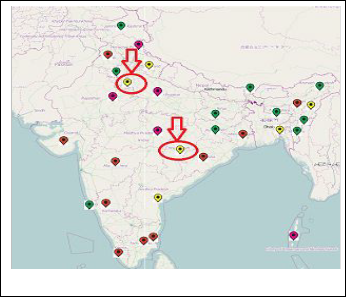
The changes are observed in the knowledge from Q2 to Q3. Chhattisgarh is changed from safe zone to least dangerous zone. The pinpoint color of Chhattisgarh is changed from green to yellow in GIS. Delhi is changed from most dangerous zone to least dangerous zone. The pinpoint color of Delhi is changed from red to yellow in GIS. The changes from Q2 to Q3 are as shown below in Fig. 6 with red colored arrowed oval symbols.
Fig. 6. Visualization of knowledge for the III quarter of a year.
8 CONCLUSION
An epidemic is the spread of a disease because of change in ecology. A collocation rule is applied to the symptoms of a disease to identify the epidemics. Identified epidemics are visualized on Geographical Information Systems for all the quarters of a year. A spatio - temporal tree is designed. Hence the spatio-temporal trees along with the visualized knowledge in GIS will be forwarded to the hospitals for conducting health campaigns in the areas at high risk.
ACKNOWLEDGMENT
I wish to thank Mr T. Raghunatha Reddy , Associate Professor and Dr M. Nagabhushana Rao , professor for their guidance in doing research on spatio-temporal representation of disas- ter system.
REFERENCES
[1] Hardy Pundt,"Evaluating the relevance of spatial data in time critical situations", University of Applied Sciences and Research, Faculty of Automatisation and Computer Science, Wernigerode (DE), pp 779–
788, 2005, [Online] Available: http://www.springer.com/3-540-
249988-5.
[2] M. Nagabhushana Rao , Mr. S. V. V. D. Venugopal, DISASTER MANAGEMENT SYSTEM FOR DENGUE, Deptarment of Cse, A. S. R. Engineering College
[3] Masaharu Yoshioka, Yasuhiro Shamoto, Tetsuo Tomiyama,"An Ap- plication of the Knowledge Intensive Engineering Framework to Ar-
chitectural Design", A research project
IJSER © 2013 http://www.ijser.org
International Journal of Scientific & Engineering Research, Volume 4, Issue 9, September-2013 97
ISSN 2229-5518
[4] Naresh Raheja, Ruby Ojha, Sunil R Mallik, Role of internet-based GIS in effective natural disaster management", R.M.S.I. [Online] Availa- ble: http://www.development.net/technology/ gis/
[5] Alan T.Murray, Ingrid McGuffog, John S.Western, Patrick
Mullins (2001),"Exploratory Spatial Data Analysis for Examining
Urban Crime", [Online] Available: www. gegraphy.hunter.cuny.edu [6] Shaw C. Feng, Y. Zhang,"Conceptual Process Planning - A Definition and Functional Decomposition", Manufacturing Engineering Labora-
tory, National Institute of Standards and Technology 1997
[7] Yan Huang, Hui Xiong, Shashi Shekhar, Jain Pei,“Mining Confident Collocation Rules without A support Threshold”, Symposium on ap- plied computing, proceeding of the 2003 ACM Symposium on Ap- plied Computing, Florida, pp. 497-501, 2003.
[8] Amiya Kumar Tripathy, J. Adinarayana and D. Sudharsan , Geospa-
tial Data Mining for Agriculture Pest Management - a framework , Centre of Studies in Resources Engineering , Indian Institute of Technology Bombay
[9] Anthony K. H. Tung Jean Hou Jiawei Han , Spatial Clustering in the
Presence of Obstacles , School of Computing Science , Simon Fraser
University , 1063-6382/01 $10.00 0 2001 IEEE , 359 – 367
[10] BIN-BIN HE I, *, TAO FANG*, DA-ZHI GUO , Proceedings of the
Third International Conference on Machine Leaming and Cybemet- ics, Shanghai, 26-29 August 2004, UNCERTAINTY IN SPATIAL DA- TA MINING School of Environment & Spatial Informatics, China University of Mining and Technology, Xuzhou, China, 221008 , Insti- tute of Image Processing &Pattern Recognition, Shanghai Jiao-Tong University, Shanghai , 0-7803-8403-2/04/$20.00 a004 IEEE , 1152 –
1156
[11] BIN-BIN HE I, *, TAO FANG*, DA-ZHI GUO , Proceedings of the Third International Conference on Machine Leaming and Cybemet- ics, Shanghai, 26-29 August 2004, UNCERTAINTY IN SPATIAL DA- TA MINING School of Environment & Spatial Informatics, China University of Mining and Technology, Xuzhou, China, 221008 , Insti- tute of Image Processing &Pattern Recognition, Shanghai Jiao-Tong University, Shanghai , 0-7803-8403-2/04/$20.00 a004 IEEE , 1152 –
1156
[12] Jianbo zhang1, 2, Jiping liu1 , 2010 International Conference on E-
Business and E-Government , Spatial cluster based on map algebra,
1Research Center of Government Geographic Information System,
Chinese Academy of Surveying and Mapping to School of Resource
and Environmental Science, 978-0-7695-3997-3/10 $26.00 © 2010 IEEE
, 2335 – 2338
[13] Khatereh Polous#1, Abbas Farshad*2, Manouchehr Zarinkafsh#3, Mohammad Hassan Roozitalab , Evaluation of the Spatio-Temporal of Soil Salinity Variation Using Data Mining Approach , Soil Science Department, Azad University Karaj , 978-1-4244-8351-8/11/$26.00
©2011 IEEE , 81-86
[14] Le Van Quoc Anh , Michael Gertz , 2012 IEEE 12th International Conference on Data Mining Workshops , Mining Spatio-temporal Patterns in the Presence of Concept Hierarchies , Institute of Com- puter ScienceHeidelberg University, Germany & Institute of Com- puter Science , 978-0-7695-4925-5/12 $26.00 © 2012 IEEE, 765-772
[15] Nagabhushana Rao, Ramesh Babu, Sangameswar, Spatial Knowledge Algorithm For epidemics Using Data Mining Tech- niques. International conference-ICSCI-2008, Hyderabad, Jan 2008
[16] Po-Ruey Lei , Ing-Jiunn Su , 2011 12th IEEE International Conference
on Mobile Data Management , Exploring Spatial-Temporal Trajectory Model for Location Prediction , Chung Cheng Institute of Technolo- gy , National Defense University , 978-0-7695-4436-6/11 $26.00 ©
2011 IEEE , 58 – 67
[17] Yang Jun , Spatial Data Storage Model Based on Map Calculus for
Online Map Generalization, Geography Information Science Centre
Southwest Jiaotong University, 978-1-4244-8351-8/11/$26.00 ©2011
IEEE , 204 – 207
[18] Feng#4, Xing Xie , 2009 Tenth International Conference on Mobile
Data Management: Systems, Services and Middleware , Mining Indi-
vidual Life Pattern , Based on Location History, Dept. Of Computer
Science and Technology, Tsinghua University , 978-0-7695-3650-7/09
$25.00 © 2009 IEEE , 1 – 10
[19] Yi Hongyan , Chen Suozhong , Design and implementation of road- way geological , sketch picture drawing system based on MapGIS , Archives, Soochow University & Key Laboratory of Virtual Geo- graphical Environment, Ministry of EducationNanjing Normal Uni- versity , 978-1-4244- 7618-3 /10/$26.00 ©2010 IEEE
[20] Dr. M Nagabhushana Rao,Dr. M Muralidhara Rao, Vedavathi P, Disaster Prediction System using IBM SPSS Data Mining Tool for Cholera, SCET College, 136-140,IJCST Vol.4 Issue.2 April-June 2013 , ISSN : 0976-8491 (Online) | ISSN : 2229-4333 (Print)
IJSER © 2013 http://www.ijser.org