International Journal of Scientific & Engineering Research Volume 2, Issue 9, September-2011 1
ISSN 2229-5518
Six Sigma an Excellent Tool for Process
Improvement – A Case Study
Sushil Kumar*, P.S. Satsangi and D.R. Prajapati
—————————— ——————————
formation of casting defects such as porosity, segregation,
HE global market is becoming more and more quality conscious. To compete in such an environment, companies need to adopt an efficient technique that can assess and take a diagnostic approach to meet customer needs and expectations. Nowadays, the industrial world has realized that the Six Sigma philosophy is certainly a viable solution to their shop floor problems and it has become one of the most important subjects of debate in quality management. Six Sigma is a well-structured methodology that can help a company to achieve expected goal through continuous improvement. For many companies, Sigma quality level is a measure of the process defect rate and thus can be used to measure the quality of the manufacturing process (i.e. a high Sigma level indicates that the process results in a lower defect rate, whereas a low Sigma level illustrates a higher defect rate). Sigma quality level also helps to set a realistic target for improvement of process quality during the Define, Measurement, Analyze, Improve, and Control (DMAIC) cycle (i.e. it can be used as a bench marking tool). Systematic and disciplined implementation of DMAIC cycle ensures to eliminate the causes of defects by focusing on process outcomes that are of critical importance to customers. By using DMAIC procedure, the variance, waste and errors that plague an operation can be rooted out. A problem is defined and quantified, measured data is then collected to confine and clarify the problem, analytic tools are deployed to trace the problem to a root cause, a solution for the root cause is identified and implemented, and the improved operations are finally subjected to ongoing
control to prevent recurrence of the problem.
Reducing process variations is the core objective of Six Sigma projects, as process variations result in higher quality loss. Casting is one of the most economical routes to produce metallic components in which the liquid metal is directly poured into the mould cavity of required size and shape. The major drawback of casting processes is the
hot tears, etc. Many foundries are interested to implement Six Sigma to improve the quality of their products. Indeed, the implementation of Six Sigma methodology into foundry has become globally popular. The main benefit of a Six Sigma program is the elimination of subjectivity in decision-making, by creating a system, where everyone in the organization collects, analyzes, and displays data in a consistent way.
In this paper, the prime focus is on minimizing the defects, developed in the cast iron (grade-25) differential housing cover castings manufactured by the green sand casting process. The case study is based upon a leading automobile foundry industry, located in north India. It is grey automotive captive foundry, producing grade-25 casting for well known tractors. The Case, carrier, gear box housings, trumpet housings, rear cover and differential housings are main products of this industry. We have implemented DMAIC (Define, Measurement, Analyze, Improve, and Control) based Six Sigma approach to optimize the green sand casting process parameters and have made the process more robust to quality variations. Analysis of various critical process parameters is carried out with the help of Taguchi’s method of experimental design.
For most of the companies, Sigma quality level is a measure of the process defect rate and thus, can be used to measure the quality of the manufacturing process. In order to accomplish the Six Sigma objectives, one of the most practiced methodologies is the DMAIC approach as suggested by Koning and Mast [11]. Maleyeff and Kaminsky [14] described that over the past few decades, Six Sigma has been espoused by many world-class companies and has a lot of successful cases. Rajagopalan et al. [19] stated that Six Sigma programs improve operational performance in order to enhance customers’ satisfaction
IJSER © 2011 http://www.ijser.org
International Journal of Scientific & Engineering Research Volume 2, Issue 9, September-2011 2
ISSN 2229-5518
with a company’s products and services. Kuei and Madu [12] stated that Current applications of the Six Sigma methodology emphasize the phases that are integrated in conducting a project, which include define-measure- analyze- improve-control. Harry and chroeder [10] explored that in Six Sigma initiative, although there are many criteria to judge the performance of Six Sigma projects, for instance, net cost savings, cost of poor quality, capacity and customer satisfaction. Snee [21] suggested that good Six Sigma projects must possess some characteristics that are connected to business priorities, major importance to the organization, reasonable scope, etc. Gijo and Rao [8] proposed that Six Sigma projects must be selected in line with the organization’s goal and objectives. Furthermore, selection of suitable belt projects plays a vital role in successful Six Sigma implementation.
Lee and Chang [13] explored that six-sigma based systems can promote the enterprise competitive ability, such as pursuing cost improvement, promoting quality, the customer's satisfaction and valid strategy performance. Natarajan and Morse [17] stated that in recent years, many organizations have used Six Sigma for process improvement. The success stories of Six Sigma applications are usually that of large organizations like General Electric and many of these successful applications have been in manufacturing. Deshmukh and Lakhe [6] stated that Six Sigma has helped many industries, small and big to achieve phenomenal success. Frings and Grant [7] stated that Six Sigma has the flexibility to be used as an operational strategy to reduce the number of defects or as a business strategy to improve business processes and evolve new business models. Shah and Ward [20] stated that applications of the Six Sigma project execution methodology have since expanded to include more explorative objectives, such as increasing customer satisfaction, or developing closer supplier relationships, and the use of softer practices. Cheng [4] investigated the influence of the organizational context on individual quality management practices by empirically examining the links between different culture types and different Six Sigma practices. Nonthaleerak and Hendry [18] identified three distinctive practices essential for applying Six Sigma principles and methods, which are Six Sigma role structure, Six Sigma structured improvement procedure and Six Sigma focus on metrics. McManus [15] stated that every organization should have a process improvement team approach in place that engages a high percentage of the work force. Such an approach is mandatory for sustained progress toward process excellence to improve the Sigma level. Xingxing et al. [24] reviewed both the traditional quality management and Six Sigma literatures, and identified three new practices that are critical for
implementing Six Sigma’s concept and method in an organization. These practices are referred to as: Six Sigma role structure, Six Sigma structured improvement procedure and Six Sigma focus on metrics. Zu et al. [25] studied the evolving theory of quality management and the role of Six Sigma.
A lot of research is carried out on green sand and its properties during 1960’s and 1970’s around the world. Most of the research work during that period was based on experimental and theoretical approaches. Hahn [9] stated that in order to maintain market position, foundries have to adapt the constantly increasing demands with regard to the quality and functioning of their products. Arita and McCann [2] stated that many foundries are interested to implement Six Sigma to improve the quality of their products. Indeed, the implementation of Six Sigma methodology into foundry has become globally popular. Barua et al. [3] used the Taguchi’s method to optimize the mechanical properties of the Vacuum (V) casting process. Their prime focus is on minimizing the casting defects, developed in components manufactured by the green sand casting process. The gradient search method, the FEM neural network method, and the Taguchi method are some prominent methods, generally used for casting system design. Antony and Banuelas [1] described that the casting process has a large number of parameters that may affect the quality of castings. Some of these parameters are controllable factors, while others are noise factors. They also indicated that linking Six Sigma to business strategy and customer needs is critical for successful implementation. Taguchi and Clausing [23] have introduced several new statistical tools and concepts of quality improvement that depend heavily on the statistical theory of experimental design. Ghani et al. [5] stated that Taguchi’s method of experimental design is a viable methodology, which not only provides the maximum amount of information with the minimum number of trials but also establishes functional relationships between the input and output variables. Muzammil et al. [16] made a study for the optimization of a gear blank casting process by using Taguchi’s robust design technique. Syrcos *22+ analyzed various significant process parameters of the die casting of aluminium alloy. An attempt was made to obtain optimal settings of the die casting parameters while achieving the optimum casting density of the aluminium alloy castings.
Six Sigma is a project-driven approach and by which the organization can achieve the strategic goal through
IJSER © 2011 http://www.ijser.org
International Journal of Scientific & Engineering Research Volume 2, Issue 9, September-2011 3
ISSN 2229-5518
effectively accomplishing projects. Deploying the organization’s strategic goal into feasibility, projects play an important role in achieving success of Six Sigma implementation. As per literature review there should not be too many factors in project selection. Instead, choosing the five to eight variables that are the most relevant criteria for the process would be sufficient. The DMAIC procedure is implemented for the green sand casting process as discussed in the following sections.
The first phase of DMAIC is to define and identify key issues and problems through both the voice of customer and the voice of business, as well as the analysis of casting processes. From the literature and views of experienced foundry personnel, casting defects is the most dissatisfaction area in this industry. The casting defects for the said foundry for year 2009 is found to be 4.72052%, which is accounted for Sigma value of 3.18. Therefore to increase the Sigma value of green sand casting process for differential housing castings, most influencing parameters are identified.
After intense brain storming, several influencing and controllable process parameters are identified and measured. The effective range of the parameters identified is studied for its effects on the Sigma performance of the process. Performance measures of the existing process are determined by collecting data from the foundry floor. The
most significant parameters in the current research are moisture, green strength, permeability and moulding sand temperature from sand shop, core sand temperature from core shop, pouring temperature from melt shop and mould hardness vertical and horizontal from mould shop.
The selected casting process parameters along with their ranges are given in Table 1. The castings of differential housing are made against the trial conditions, given in Tables 1. The relevant factors are assigned in each column of the L18 orthogonal array. Once the parameters are assigned to a particular column of the selected orthogonal array as given in Table 1, the factors at different levels are assigned for each trial.
A | B | C | D | E | F | G | H | |
Trial No | Moisture Content (%) | Green Strength (g/cm2) | Mould Hardness vertical (No.) | Permea- bility (No) | Mould Hardness horizontal (No.) | Pouring Temp. (OC) | Core sand temp. (OC) | Moulding sand Temp. (OC) |
1 | 4 | 1750 | 72 | 125 | 80 | 1370 | 25 | 40 |
2 | 4 | 1750 | 77 | 137 | 85 | 1390 | 35 | 55 |
3 | 4 | 1750 | 82 | 150 | 90 | 1410 | 45 | 70 |
4 | 4 | 1870 | 72 | 125 | 85 | 1390 | 45 | 70 |
5 | 4 | 1870 | 77 | 137 | 90 | 1410 | 25 | 40 |
6 | 4 | 1870 | 82 | 150 | 80 | 1370 | 35 | 55 |
7 | 4 | 1990 | 72 | 137 | 80 | 1410 | 35 | 70 |
8 | 4 | 1990 | 77 | 150 | 85 | 1370 | 45 | 40 |
9 | 4 | 1990 | 82 | 125 | 90 | 1390 | 25 | 55 |
10 | 4.7 | 1750 | 72 | 150 | 90 | 1390 | 35 | 40 |
11 | 4.7 | 1750 | 77 | 125 | 80 | 1410 | 45 | 55 |
12 | 4.7 | 1750 | 82 | 137 | 85 | 1370 | 25 | 70 |
13 | 4.7 | 1870 | 72 | 137 | 90 | 1370 | 45 | 55 |
14 | 4.7 | 1870 | 77 | 150 | 80 | 1390 | 25 | 70 |
IJSER © 2011 http://www.ijser.org
International Journal of Scientific & Engineering Research Volume 2, Issue 9, September-2011 4
ISSN 2229-5518
15 | 4.7 | 1870 | 82 | 125 | 85 | 1410 | 35 | 40 |
16 | 4.7 | 1990 | 72 | 150 | 85 | 1410 | 25 | 55 |
17 | 4.7 | 1990 | 77 | 125 | 90 | 1370 | 35 | 70 |
18 | 4.7 | 1990 | 82 | 137 | 80 | 1390 | 45 | 40 |
In this stage, considered process parameters, that influences the Critical to Quality (CTQs) are identified and measured in the foundry shop. The casting defects are also observed thrice for each trial condition as given in Table 2.
Percentage defects in experiment | ||||||
Trail No. | 1 | 2 | 3 | Total | Average percentage of defects | S/N ratio |
1 | 5.26 | 5.71 | 4 | 14.97 | 4.990 | -14.052 |
2 | 4.45 | 5.59 | 5.55 | 15.59 | 5.197 | -14.359 |
3 | 6.45 | 7.1 | 5.09 | 18.64 | 6.213 | -15.944 |
4 | 3.91 | 4.15 | 5.01 | 13.07 | 4.357 | -12.833 |
5 | 6.25 | 6.69 | 4.7 | 17.64 | 5.880 | -15.478 |
6 | 7.28 | 7.16 | 6.75 | 21.19 | 7.063 | -16.984 |
7 | 2.63 | 3.03 | 3.84 | 9.5 | 3.167 | -10.12 |
8 | 3.76 | 5.55 | 5.14 | 14.45 | 4.817 | -13.763 |
9 | 7.25 | 8.14 | 6.33 | 21.72 | 7.240 | -17.24 |
10 | 6.33 | 4.84 | 7.25 | 18.42 | 6.140 | -15.875 |
11 | 5.66 | 7.08 | 7.51 | 20.25 | 6.750 | -16.645 |
12 | 9.09 | 9.52 | 9.28 | 27.89 | 9.297 | -19.368 |
13 | 7.33 | 7.78 | 6.76 | 21.87 | 7.290 | -17.268 |
14 | 6.66 | 5.19 | 6.34 | 18.19 | 6.063 | -15.701 |
15 | 7.19 | 6.86 | 5.56 | 19.61 | 6.537 | -16.357 |
16 | 3.03 | 5.88 | 4.76 | 13.67 | 4.557 | -13.451 |
17 | 7.14 | 6.75 | 6.16 | 20.05 | 6.683 | -16.515 |
18 | 7.28 | 7.66 | 7.69 | 22.63 | 7.543 | -17.554 |
A valid relationship between the process parameters and their corresponding response variables is established to identify the critical parameters having a significant contribution in influencing the response functions. In this context, Taguchi’s method of experimental design is a viable methodology, which not only provides the maximum amount of information with the minimum number of trials but also establishes functional relationships between the input and output variables [Ghani et al., 5]. The idea is to identify the critical process
parameters, increase system robustness, reduce
experimental costs, and improve product quality. Further, Taguchi’s experimental design principle will be applied to identify the optimal parameter settings for the said process. The average percentage of defects and S/N ratio of the casting defects for melt shop process is determined for each trial condition as given above in Table 2.
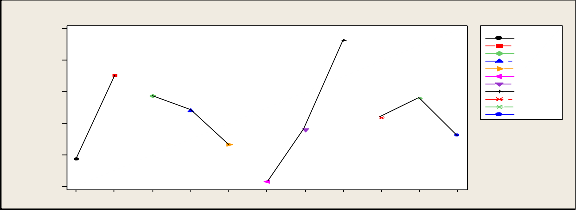
The mean response refers to the average value of the performance characteristic for each parameter at different levels. The average values of the casting defects for each parameter at different levels are calculated and given in Table 3.
IJSER © 2011 http://www.ijser.org
International Journal of Scientific & Engineering Research Volume 2, Issue 9, September-2011 5
ISSN 2229-5518
Factors | Level 1 | Level 2 | Level 3 | |||
Casting defects | S/N ratio | Casting defects | S/N ratio | Casting defects | S/N ratio | |
A | 5.43 | -14.53 | 6.76 | -16.526 | - | - |
B | 6.43 | -16.04 | 6.2 | -15.77 | 5.66 | -14.774 |
C | 5.08 | -13.933 | 5.9 | -15.41 | 7.31 | -17.241 |
D | 6.09 | -15.607 | 6.4 | -15.691 | 5.81 | -15.286 |
E | 5.93 | -15.76 | 5.8 | -15.022 | 6.57 | -16.387 |
F | 6.69 | -16.325 | 6.09 | -15.594 | 5.52 | -14.666 |
G | 6.34 | -15.882 | 5.8 | -15.035 | 6.16 | -15.668 |
H | 5.98 | -15.513 | 6.35 | -15.991 | 5.96 | -15.08 |
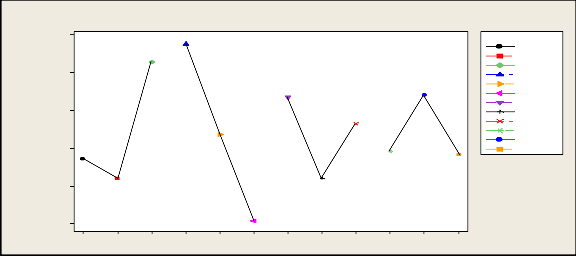
The average values of casting defects for each
parameter at different levels are plotted in Fig. 1 and 2.
7.5
7.0
6.5
6.0
5.5
F acto rs
A 1
A 2
B1
B2
B3
C 1
C 2
C 3
D1
D2
D3
5.0
A1
A2 V B1 ou B2 ar B3 et C1 a
C2 ev C3 D1
D2 D3
ari
s p am
ers
nd l
els
IJSER © 2011 http://www.ijser.org
International Journal of Scientific & Engineering Research Volume 2, Issue 9, September-2011 6
ISSN 2229-5518
6.75
6.50
6.25
6.00
5.75
F acto rs
E1
E2
E3
F 1
F 2
F 3
G1
G2
G3
H1
H2
H3
5.50
E1
E2 E3
F1 F2
F3 G1
G2 G3 H1 H2 H3
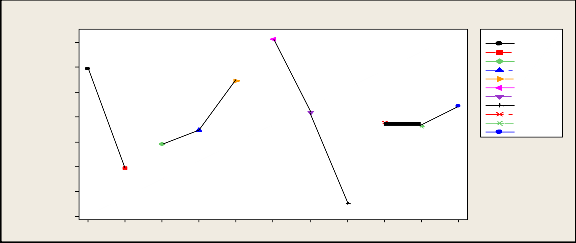
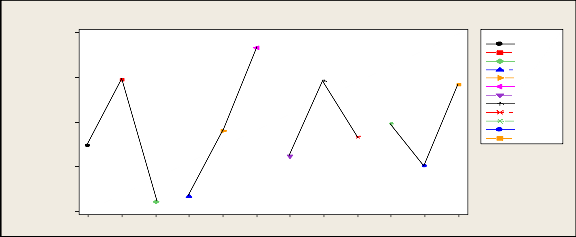
The average values of S/N ratio for each parameter at different levels are plotted in Fig. 3 and 4.
-14.0
-14.5
-15.0
-15.5
-16.0
-16.5
-17.0
F acto rs
A 1
A 2
B1
B2
B3
C 1
C 2
C 3
D1
D2
D3
-17.5
A1 A2 B1
B2 B3 C1
C2 C3
D1 D2 D3
IJSER © 2011 http://www.ijser.org
International Journal of Scientific & Engineering Research Volume 2, Issue 9, September-2011 7
ISSN 2229-5518
-14.5
-15.0
-15.5
-16.0
F acto rs
E1
E2
E3
F 1
F 2
F 3
G1
G2
G3
H1
H2
H3
-16.5
E1
E2 E3 F1
F2 F3
G1 G2
G3 H1
H2 H3
In order to find the significant parameters, three way analysis of variance (ANOVA) technique is used for casting defects. The results are shown in Table 4.
Source | Sum of square (SS) | Degree of freedom | Variance | F-ratio | |
A | 23.75 | 1 | 23.75 | 33.17 | Significant |
B | 5.51 | 2 | 2.755 | 3.85 | Significant |
C | 45.93 | 2 | 22.965 | 32.07 | Significant |
D | 3.1 | 2 | 1.55 | 2.16 | |
E | 6.27 | 2 | 3.135 | 4.38 | Significant |
F | 12.38 | 2 | 6.19 | 8.64 | Significant |
G | 2.73 | 2 | 1.365 | 1.9 | |
H | 1.7 | 2 | 0.85 | 1.18 | |
Error (e) | 27.2 | 38 | 0.716 | 1 | |
Total | 128.57 | 53 |
Critical value of F ratio for factor A is 4.098 at (1, 38) and 3.24 at (2, 38) for other factors (tabulated) at 95% confidence interval.
Taguchi method cannot judge and determine the effect
of individual parameters on entire process while percentage contribution of individual parameters can be determined, using (ANOVA) technique. ANOVA can be useful for determining influence of input parameter from a series of experimental results, using design of experiment.
For detailed analysis of experimental results, pooling
technique is used. The expected value of the sums of square (SS′) for each factor is computed by using the percent contribution (P) for each factor and is calculated for casting defects, as shown in Table 5.
IJSER © 2011 http://www.ijser.org
International Journal of Scientific & Engineering Research Volume 2, Issue 9, September-2011 8
ISSN 2229-5518
Source | Sum of square (SS) | Degree of freedom | Variance | F- ratio | Expected SS' | Percent contribution |
A | 23.75 | 1 | 23.75 | 30.06 | 22.96 | 17.86 |
B | 5.51 | 2 | 2.755 | 3.49 | 3.93 | 3.06 |
C | 45.93 | 2 | 22.965 | 29.07 | 44.35 | 34.49 |
D | pooled | pooled | pooled | pooled | pooled | pooled |
E | 6.27 | 2 | 3.135 | 3.97 | 4.69 | 3.65 |
F | 12.38 | 2 | 6.19 | 7.84 | 10.8 | 8.4 |
G | pooled | pooled | pooled | pooled | pooled | pooled |
H | pooled | pooled | pooled | pooled | pooled | pooled |
Error (e) | 34.73 | 44 | 0.79 | 1 | 41.84 | 32.54 |
Total | 128.57 | 53 | 128.57 | 100 |
In this stage the results obtained from the DOE analysis are further considered for augmentation. The purpose of the improvement phase is to identify and implement changes so that the overall casting processes performance can be improved and the common-cause variations in the casting
processes can be reduced. Therefore confirmation experiments are used to verify the factors and levels chosen from an experiment, cause a product or process to behave
in a certain manner. Twenty numbers of confirmation experiments are conducted at the optimum settings of the process, as given in Table 6.
Trial Nos. | Moisture Content (%) | Green Strength (g/cm2) | Mould Hardness (V) (No.) | Mould Hardness (H) (No.) | Pouring Temp. (OC) | Average casting defects | |
1 | 4 | 1990 | 72 | 85 | 1410 | 3.33 | |
2 | 4 | 1990 | 72 | 85 | 1410 | 3.12 | |
3 | 4 | 1990 | 72 | 85 | 1410 | 2.63 | |
4 | 4 | 1990 | 72 | 85 | 1410 | 3.22 | |
5 | 4 | 1990 | 72 | 85 | 1410 | 2.85 | |
6 | 4 | 1990 | 72 | 85 | 1410 | 3.12 | |
7 | 4 | 1990 | 72 | 85 | 1410 | 3.44 | |
8 | 4 | 1990 | 72 | 85 | 1410 | 3.12 | |
9 | 4 | 1990 | 72 | 85 | 1410 | 3.03 | |
10 | 4 | 1990 | 72 | 85 | 1410 | 3.33 | |
11 | 4 | 1990 | 72 | 85 | 1410 | 2.85 | |
12 | 4 | 1990 | 72 | 85 | 1410 | 3.84 | |
13 | 4 | 1990 | 72 | 85 | 1410 | 3.45 | |
14 | 4 | 1990 | 72 | 85 | 1410 | 3.12 | |
15 | 4 | 1990 | 72 | 85 | 1410 | 2.77 | |
16 | 4 | 1990 | 72 | 85 | 1410 | 3.57 | |
17 | 4 | 1990 | 72 | 85 | 1410 | 3.13 | |
18 | 4 | 1990 | 72 | 85 | 1410 | 3.85 |
IJSER © 2011 http://www.ijser.org
International Journal of Scientific & Engineering Research Volume 2, Issue 9, September-2011 9
ISSN 2229-5518
19 | 4 | 1990 | 72 | 85 | 1410 | 3.33 |
20 | 4 | 1990 | 72 | 85 | 1410 | 2.94 |
The average of the respondents casting defects in each
experiment is found to be 3.002%, which is accounted for
Sigma value of 3.39.
The last phase is control phase and the purpose of this phase is to sustain the benefits of the new process and to ensure that previous problems do not resurface. For complete success of Six Sigma, proper documentation of the process is recommended. The critical process parameters are continuously monitored and documented to update the information.
In this case study, DMAIC based Six Sigma approach implemented to optimize the processes parameters of a foundry. The Taguchi method of experimental design is used to analyze the optimum levels of individual process parameters. Table 4 shows the results obtained from factorial design and provides an insight into the process parameters, affecting the casting process. Thus, from the ANOVA analysis, it can be concluded that the process parameters such as moisture content (%), green compressive strength (g/cm2), pouring temperature (0C) and mould hardness are the significant parameters taken into account when designing further experiments.
This paper deals with the fact that the efficiency and performance level of the casting process can be improved by adopting a Six Sigma approach. It is concluded from the analysis that, the quality can be improved by Six Sigma i.e. (DMAIC) approach of parameters at the lowest possible cost. It is also possible to identify the optimum levels of signal factors at which, the noise factors effect on the response parameters is less. The outcome of this case study is to optimize the process parameters of the green sand castings process, which contributes to minimize the casting defects. The optimized parameter levels for green sand casting process are moisture content (4.0%), green strength (1990 g/cm2), pouring temperature (14100C) and mould hardness number vertical & horizontal (72 & 85) respectively. The experiments also give a clear picture of each factor’s contribution to the variation in the quality of casting process without much investment.
1. J. Antony, and R. Banuelas, “Key ingredients for the effective implementation of Six Sigma program”, Measuring Business Excellence, vol. 6 (4), pp. 20–27, 2002.
2. T. Arita, and P. McCann, “Regular monthly income by wearing your shorts at the comfort of your”, Journal of International Management, vol. 8, pp. 121–139, 2002.
3. P.B. Barua, P. Kumar, and J.L. Gaindhar, “Surface roughness optimization of V process castings through Taguchi’s method”, AFS Transactions, vol. 45, pp. 763–
768, 1997.
4. J. Cheng, “Six Sigma business strategy in Taiwan: an empirical study”, International Journal of Six Sigma and Competitive Advantage, vol. 3 (1), pp. 1–12, 2007.
5. J.A. Ghani, I.A. Choudhury, and H.H. Hasan, “Application of Taguchi method in the optimization of end milling parameters”, Journal of Materials Processing Technology, vol. 145, pp. 84–92, 2004.
6. S.V. Deshmukh, and R.R. Lakhe, “Six Sigma awareness in Central Indian SMEs”, International Journal of Productivity and Quality Management, vol. 5(2), pp. 200 –
212, 2010.
7. G.W. Frings, and L. Grant, “Who moved my Sigmay effective implementation of the Six Sigma methodology to hospitals”, International journal of Quality & Reliability Engineering, vol. 21, pp. 311-328, 2005.
8. E.V. Gijo, and T. S. Rao, “Six Sigma implementation- Hurdles and more Hurdles”, Total Quality Management, vol. 16(6), pp. 721-725, 2005.
9. O. Hahn, “Influence of the coating on the mould filling mechanisms in the lost foam casting of aluminium”, International journal of Casting Plant and Technology, vol.
15, pp. 9-14, 1999.
10. M. Harry, and R. Schroeder, “Six Sigma: The breakthrough management strategy revolutionizing the world’s top corporations Currency”, 2000.
11. H.D. Koning, and J. Mast, “A rational reconstruction of
Six Sigma’s breakthrough cookbook, optimizing six sigma strategies to improve your bottom line”, First International Conference on Six Sigma, Glasgow, Scotland, December 16-17, 2004.
12. C.H. Kuei, and C.N. Madu, “Customer-centric six
sigma quality and reliability management”, The
IJSER © 2011 http://www.ijser.org
International Journal of Scientific & Engineering Research Volume 2, Issue 9, September-2011 10
ISSN 2229-5518
International Journal of Quality & Reliability Management, vol. 20, pp. 954-964, 2003.
13. M.C. Lee, and T. Chang, “Developing a lean design for Six Sigma through supply chain methodology”, International Journal of Productivity and Quality Management, vol. 6(4), pp. 407-434, 2010.
14. J. Maleyeff, and F.C. Kaminsky, “Six Sigma and introductory statistics education”, Education. & Training, vol. 44, pp. 82-89, 2002.
15. K. McManus, “The trouble with teams”, Industrial
Engineering, vol. 39 (10), pp. 20-22, 2007.
16. M. Muzammil, P.P. Singh, and F. Talib, “Optimization of gear blank casting process by using Taguchi’s robust design technique”, Journal of Quality Engineering, vol.
15, pp. 351-359, 2003.
17. R.N. Natarajan, and J. Morse, “Six Sigma in services – challenges and opportunities”, International Journal of Productivity and Quality Management, vol. 4(5/6), pp. 658-675, 2009.
18. P. Nonthaleerak, And L. Hendry, “Exploring the Six Sigma phenomenon using multiple case study evidence”, International Journal of Operations and Production Management, vol. 28 (3), pp. 279-303, 2008.
19. R. Rajagopalan, M. Francis, and W. Suarez, “Developing novel catalysts with Six Sigma. Research- Technol”, Management, vol. 47, pp. 13-16, 2004.
20. R. Shah, And P.T. Ward, “Defining and developing measures of lean production”, Journal of Operations Management, vol. 25 (4), pp. 785-805, 2007.
21. R.D. Snee, “Dealing with the Achilles’ heel of Six Sigma
initiatives – project selection is key to success”, Quality
Progress, vol. 34(3), pp. 66-69, 2002.
22. G.P. Syrcos, “Die casting process optimization using Taguchi methods”, Journal of materials processing technology, vol. 135, pp. 68-74, 2002.
23. G. Taguchi, and D. Clausing, “Robust quality”, Harvard
Business Review, pp. 65–75 (January–February), 1990.
24. Z. Xingxing, T.L. Robbins, and L.D. Fredendall, “Mapping the critical links between organizational culture and TQM/Six Sigma practices”, International Journal of Production Economics, Vol. 123 (1), pp. 86-106,
2010.
25. X. Zu, L.D. Fredendall, and T.J. Douglas, “The evolving theory of quality management: The role of Six Sigma”, Journal of Operations Management, vol. 26(5), Pp. 630-
650, 2008.
1. Research scholar, PEC University of Technology,
Chandigarh, India. Ph +919417423519, Email: - sushilt6512@gmail.com
2. Associate Professor, Mechanical Engineering
Department, PEC University of Technology, Chandigarh, India. . Ph +919814798963, Email: - pssatsangi@yahoo.com
3. Assistant Professor, Mechanical Engineering Department, PEC University of Technology, Chandigarh, India. . Ph +919876166331, Email: - praja_3000@yahoo.com
Corresponding author: Sushil Kumar
E-mail: sushilt6512@gmail.com
Tel.: +919417423519
IJSER © 2011 http://www.ijser.org