
Inte rnatio nal Jo urnal o f Sc ie ntific & Eng inee ring Re se arc h Vo lume 3, Issue 2 , Fe bruary -2012 1
ISSN 2229-5518
Simulation of methanol synthesis from synthesis gas in fixed bed catalytic reactor using mathematical modeling and neural networks
Parvaneh Nakhostin Panahi, Seyed Mahdi Mousavi, Aligholi Niaei, Ali Farzi, Dariush Salari
Abstract— Recently, methanol synthesis w ith CO2-rich f eed has draw n a lot of attention and research is currently aimed at f inding a suitable catalyst f or such a task. A pseudo-homogeneous model w as developed f or f ixed bed catalytic methanol reactor based on the reaction mechanisms and mass and energy balance equations. The model utilizes the kinetic equation proposed by Vanden Bussche and Froment in 1996. With the proposed mathematical model, the prof ile of methanol molar f low rate, H2 and CO2 conversion, methanol yield, and temperature w ere achieved through the length of catalytic bed reactor. Good agreement w as f ound betw een model results and industrial data. The proposed model used f or calculating of reactor output against variation of the inlet mo lar f low H2/ CO2 in the
f eed then modeling of the methanol unit by use of artif icial neural netw orks w as done w ith obtained results f rom mathematical model.
Inde x Te rms— methanol synthesis, mathematical modeling, artif icial neural netw ork
—————————— ——————————
odels are mathematical representations of processes describing the underlying process as precisely as possi- ble. With models, the output variables of the process
can be predicted based on the set of input variables and the set
of model parameters. Process models can be applied to many
fields of chemical engineering such as research and develop- ment, process design and plant operation. Models extend the knowledge about a process behavior and are useful in process optimization. Steady-state or dynamic behavior of a process can be studied with different kinds of models. Steady-state models do not tell us about the evolution of the process with time. They provide information about the future steady-state values given the set of input variables. Dynamic models d e- scribe the process behavior over time [1].
Methanol synthesis is a widely studied process but still there is no mutual agreement about the reactions occurring within the process. Nowadays, the interest is in the production of methanol from CO2-rich feed gas, instead of the traditional CO-rich feed. The economic operation of methanol synthesis from CO2 requires an efficient catalyst allowing high enough methanol yields. The kinetics of methanol synthesis has also been studied widely. Many different kinds of kinetic equations have been derived based on different assumptions about the limiting phenomena. Maybe the most profound model is d e- rived by Vanden Bussche and Froment (1996). Vanden Bussche and Froment (1996) and Setinc and Levec (2001) have reviewed some of the proposed kinetic equations in their ar-
2 METHANO L S YNTHESES
Methanol is very commonly used as a feedstock in the chemical industries. It is also used as a fuel and as a solvent. It is produced commercially from synthesis gas (CO/CO2/H2) under high pressure and temperature. The used catalyst is mainly the copper/zinc based oxide catalyst. Used oxide addi- tives include, for example, Al2O3, Cr2O3 and ZrO2 [4,5] . Me- thanol is used when producing for example formaldehyde, acetic acid, and methyl tertiary butyl ether (MTBE) [1]. The use of CO2 as a feedstock in methanol synthesis has gained a lot of attention and nowadays is widely s tudied. The research has focused mainly on the search for the most suitable cata- lyst, as the performance of the process is highly dependent on used catalyst. In methanol synthesis, either CO or CO2 or both hydrogenate to methanol. The reactions together with the wa- ter-gas shift reaction are[6,7].
CO + 2H2 ↔ CH3OH ∆H°298= - 90.55 kJ.mol-1 (1) CO2 + 3H2 ↔ CH3OH + H2O ∆H°298= - 49.43 kJ.mol-1 (2) CO2 + H2 ↔ CO + H2O ∆H°298= 41.12 kJ.mol-1 (3)
In this study, the kinetic equation pr oposed by Vanden Bussche and Fr oment )1996( is used. The equation is based on equation (2) and (3) and thus the r eaction rate r 1 is neglected. The kinetic equation is:
P P
ticles [2,3].
k1 PCO 2 PH 2 1 3
K P P
(4)
CH 3OH
eq
H 2O
rCH 3OH
2
CO 2
H 2
3
————————————
![]()
k P
Parvaneh Nakhostin Panahi is a PhD student of Applied Chemistry in Uni-
1 3 H 2O
k 4 PH 2
k5
PH 2O
versity of Tabriz, Tabriz, Iran, 00984113340191,
Seyed Mahdi Mousavi is PhD student of Applied Chemistry and member of
Young Researchers club, Tabriz Branch, Islamic Azad University, Ta briz,
PH 2
P
P
Iran,
k 2 PCO 2
1 K eq H 2O CO
(5)
Aligholi Niaei,is a prof of Chemical Engineering in University of Tabriz,
r PCO PH
Tabriz, Iran,
RWGS
2 2
![]()
k3 PH 2O
Dariush salari is a prof of Applied Chemistry in University of Tabriz, Tabriz, Iran,
Ali Farzi is a prof of Chemical Engineering in University of Tabriz, Tabriz,
1
![]()
PH 2
k 4 PH 2 k5 PH 2O
Iran,
IJSER © 2012
Inte rnatio nal Jo urnal o f Sc ie ntific & Eng inee ring Re se arc h Vo lume 3, Issue 2 , Fe bruary -2012 2
ISSN 2229-5518
All the constants (kj ) in the above equation follow the general Arrhenius equation and equilibr ium constants wer e obtained fr om analyses that ar e listed in table 1 [8].
activity is consider ed constant because of the lack of available data, even though it var ies with both time and r eactor length. Steady state conditions is consider ed. In this model, r eactor is consider ed single phase. Since in multi-phase r eactor , molar flow s of components ar e used, mass balance equations ar e written based on molar flow of components. balance equations
of components ar e expr essed as follow :![]()
kj Aj exp Bj RT
![]()
(6) dF
TABLE 1
i r A
dl c i
(7)
Frequency Factors of Kinetic Equation[8]
wher e i is the molar flow of component i, c density of catalyst,
r i the rate of r eaction i and A is cr oss-sectional ar ea of r eactor. Ener gy balance equation is given by equation 8.![]()
2
![]()
![]()
dT i H i c A ri
dl
Fi C
(8)
i Pi
Wher e ΔHi is heat of r eaction, c density of catalyst, A cr oss- sectional ar ea of r eactor , r i the rat e of r eaction i, Fij the molar flow rate of component i and Cpi is molar heat capacity of i. Relationship of partial pr essur e and molar flow of components the assuming ideal gas is given by equation 9.![]()
Pi P Fi ,
Ft
Ft i Fi
(9)
The Khar k petr ochemical methanol unit has two r eactors of
methanol synthesis. These r eactor s ar e of shell and tube type.
The r eactor tubes have synthesis catalysts and water flow s in the shell of r eactor s. Because methanol synthesis r eaction is exothermic, r eleased heat is used to pr oduce steam. The cha-
racter istics of the industr ial r eactor ar e given in Table 2.
Wher e Pi is partial pr essur e of component i, P total pr essur e, Fi the molar flow r ate of component i and Ft is total molar flow rate.
Molar heat capacity of the components in the r eactor is found
fr om the following equation and the information of table 3.
Fr esh feed of the unit consists of H2 , CO, CO2 (that forms the synthesis gas) and also CH4 and N2 that participate in metha-![]()
CP Ai BiT CiT 2 DiT 2
R
(10)
nol synthesis’s r eactions [9].
TABLE 2
Industrial Reactor Specification, Catalyst Properties and Feed
Conditions
Wher e Cp is molar heat capacity, R gase constant and Ai, Bi, Ci
and Di ar e constants.
Using equation (11) enthalpy change of r eactions is calculated and used in modeling of the r eactor.
T
H T H 298
298
CP dT
(11)
Also Cp is calculated using equation 12
CP CP products CP reactonts
TABLE 3
Frequency Factors of Enthalpy Equaction
(12)
2.1 Development of Model Equations
For modeling of methanol r eactor , a plug flow r eactor model
was assumed. Heat and mass transfer as w ell as diffusion in the catalyst pellet wer e lumped in the rate constants. Catalyst
IJSER © 2012
Inte rnatio nal Jo urnal o f Sc ie ntific & Eng inee ring Re se arc h Vo lume 3, Issue 2 , Fe bruary -2012 3
ISSN 2229-5518
3 RESULTS AND D ISC USSIO N
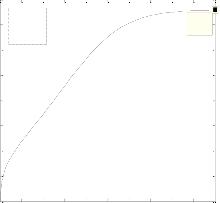
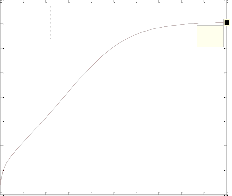
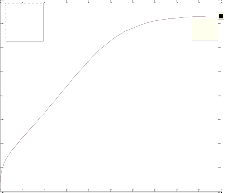
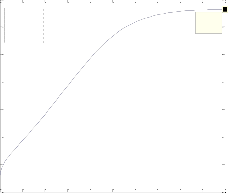
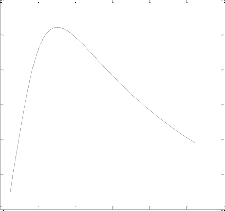
The differ ential Equations of the r eactor model wer e n u- mer ically solved by MATLAB w ith Runge-Kutta-Ver ner fourth and fifth or der method with automatic step size to ensur e a c- cur acy. Fig. 1 shows the pr ofile of methanol molar flow r ate, H2 and CO2 conver sion, methanol yield, and temperatur e through the length of the r eactor.
adequate for descr ibing r eactor dynamics. To pr edict some of the outputs against var ation of some input parameters such as the molar ratio of H2 to CO2 in the feed (H2 /CO2 ), w e proposed an alter native hybr id model. This model is composed of pr o- posed pseudo-homogeneous mathematical model and a neur- al networ k model.
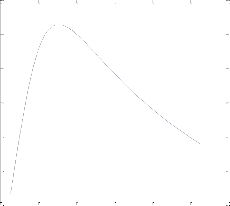
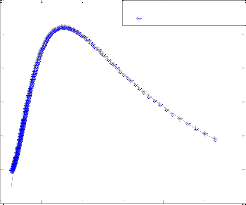
Fig. 2 shows the r esults of pr oposed mathematical model for![]()
F F
(13)
var iation of H2 /CO2 in the feed on molar flow r ate of methanol
X CO2
CO2
CO2
CO2
and Yield CH3 O H(H2 ). Accor ding to Fig. 2 it can be seen w ith in-
cr easing of H2 /CO2 in the feed, molar flow r ate of methanol![]()
F F
and Yield CH3O H(H2 ) with r espect to H2 incr eases at first w ith
X H 2 H 2 H 2
H 2
![]()
Yield F
(14)
(15)
shar p slope and finally in the ratio of 3 is maximum then de- cr ease.
Accor ding to the r eaction stoichiometr ic, equation (1), it can be
observed that the modeling r esults ar e consistent with r eaction
Yield
CH 3OH H 2
F
CH 3OH
H 2
100
(16)
stoichiometr ic so that the maximum production of methanol in the r atio 3 to 1 of H2 to CO2 accor ding to r eaction stoichi- ometr ic equation (1) pr edicted. Because the r eaction is an equi-
CH 3OH C
![]()
CH 3OH
CO
CO2
100
libr ium r eaction, higher feed concentration goes to the pr oduct
Wher e F0 CO 2 , F0 H2 , F0 CO ar e molar flow rate at the r eactor inlet, FCO 2 and FH2 molar flow rate at the r eactor outlet, XCO 2 conver- sion of CO 2 , XH2 conversion of H2 , Yield CH3 O H(H2 ) methanol yield against H2 existent in synthesis gas and Yield CH3O H(C) is metha- nol yield against carbon existent in synthesis gas.
Yield CH3 O H(H2 ) shows that 7 per cent H2 existent in synthesis gas
convert to methanol and Yield CH3 O H(C) also shows that 73.17 percent carbon existent in synthesis gas conver t to methanol. The r esults of Pseudo- homogeneous model and industr ial r eactor at Khar k petr o- chemical methanol unit ar e compar ed in Table 4. According to this table it is concluded that r esults of the model ar e close to the values of the industr ial r eactor , and the err or is negligible.
TABLE 4
Compertion of the Results of the Model and Industrial Reactor
3.1 Study of the effect of operating parameters
Ther e have been many pr evious attempts to impr ove the
pr oductivity of the methanol r eactor system. Ear ly r esearchers wer e inter ested in the r eaction mechanisms of methanol pr od- uct of synthesis gas and mathematical modeling of industr ial methanol. Pr ediction of r eactor dynamics and variation of some output against var iation of some inlet parameters in in- dustr ial sites is very difficult because observation of r eactor var iables is limited, so try -err or tests r equir e a lot of time and cost. Ther efor e mathematical models using plant data ar e in-
but it should be noticed that high concentration of H2 (high
molar ratio of H2 to CO2 ) can r educe CO2 slight pr essur e and subsequently methanol pr oduction decr ease. In addition, side r eaction (2) also takes place. Ther efor e if H2 to CO2 ratio in syn- thesis gas was 3, methanol pr oduction will be maximum.
3.2 Simulati on of reactor with neural network
In r ecent years, the concept of neural networ ks has gained wide popularity in many ar eas of chemical engineer ing such as modeling of chemical pr ocesses [ 10], design of catalysts [11], estimation of catalyst deactivation [1 2], modeling of chemical r eactor s [13, 14] and modeling of the complex chem i- cal pr ocesses [15]. In this r esearch, in or der to simulatie m e- thanol r eactor and to pr edict the output of the r eactor against changes of oper ation condition such as H2 /CO2 in the feed, the arr ays of the appr opr iate two-layer neural networ ks have been designed w ith the differ ence in the number of hidden layer neur ons and networ k training algor ithm. This networ k in- cludes an input layer which pr ovides input data to the net- wor k, a hidden layer and an output lay er that r epr esents the networ k r esponse. A sigmoid transfer function used for the hidden layer and output tr ansfer function was a linear fun c- tion.
Training of designed ANN was per formed w ith the r esults of
pr oposed mathematical model with changes of H2 /CO2 in feed.
Since activation function used in the hidden layer is sigmoid, we scaled all input vectors in the interval [0, 1]. The data wer e split in to thr ee subsets: training, validation and test set. Split- ting of samples plays an impor tant r ole in evaluat ion of an ANN per formance. The training set is used to estimate the model par ameters and the test set is used to check the genera- lization ability of the model. In this wor k, 400 data w er e pr e- par ed w ith changing of H2 /CO2 in feed using mathematical mode. The tr aining, validation and test sets include 200 data (50 % of total data), 100 data (25% of total data) and 100 data (25% of total data), r espectively.
It is r ecognized that the selection of neur ons in the hidden
layer and training algorithm can have a significant effect on networ k per formance. In this paper, w e tr ied two steps to ob-
IJSER © 2012
Inte rnatio nal Jo urnal o f Sc ie ntific & Eng inee ring Re se arc h Vo lume 3, Issue 2 , Fe bruary -2012 4
ISSN 2229-5518
tain the optimum model of ANN. In first step, w e tested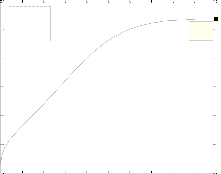
3000
(a)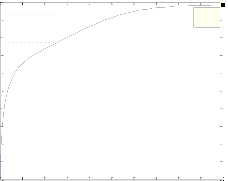
50
45
(b)
40
X: 10
Y: 49.15
2500
X: 10
Y: 2674 35
2000 30
25
1500
20
15
1000
10
500 5
0
0 1 2 3 4 5 6 7 8 9 10
Length(m)
0
0 1 2 3 4 5 6 7 8 9 10
Length(m)
16
14 (c)
X: 10
Y: 15.17
8
7 a (d)
X: 10
Y: 7.052
6
12
5
10
4
8
3
6
2
4
1
2
0
0 1 2 3 4 5 6 7 8 9 10
Length(m)
0
530
0 1 2 3 4 5 6 7 8 9 10
Length(m)
80
70 (e)
60
X: 10
Y: 73.17
525
520
(f)
X: 10
Y: 528.2
515
50
40 510
30 505
20 500
10
0
0 1 2 3 4 5 6 7 8 9 10
Length(m)
495
0 1 2 3 4 5 6 7 8 9 10
Length(m)
Fig. 1. a) Molar f low rate of methanol, b) H2 conversion, c) CO2 conversion, d) Yield CH3OH(H2), e) Yield CH3OH(C) and f) temperature prof iles along the length of the reactor
IJSER © 2012
Inte rnatio nal Jo urnal o f Sc ie ntific & Eng inee ring Re se arc h Vo lume 3, Issue 2 , Fe bruary -2012 5
ISSN 2229-5518
1100
(a)
1050
1000
950
900
850
800
0 2 4 6 8 10 12
H2/CO2
2.00E-05
1.80E-05
1.60E-05
1.40E-05
1.20E-05
1.00E-05
8.00E-06
6.00E-06
4.00E-06
2.00E-06
0.00E+00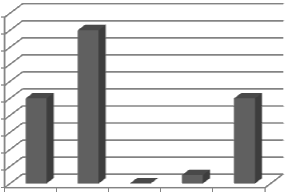
2 3 4 5 6
Number of Neurons in Hidden Layer
10.5
(b)
10
9.5
9
8.5
8
7.5
0 2 4 6 8 10 12
H2/CO2
Fig. 2. a) molare f low rate of CH3OH and
Fig.3. perf ormance Comparison of netw ork w ith diff erent neurons in hid- den layer
In the second step, an ANN with four neur ons in hidden layer was consider ed for the var iation of training algor ithms. Fig.4 shows the per formance (MSE for training sets) of designed networ k with differ ent tr aining algor ithms. It was found that a networ k w ith the Levenber g-Mar quar dt backpr opagation a l- gor ithm has MSE less tha n other trained networ ks. The MSE was 3.48e-10 for training set and 4.63e-8 for test set.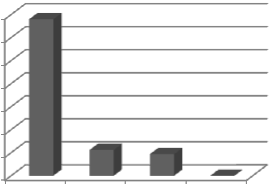
3.50E-04
3.00E-04
2.50E-04
b) Yield CH3OH(H2) prof iles against H2 to CO2 ratio
differ ent number of neur ons in the hidden layer and then, the best design of the ANN was consider ed for the var iation of training algorithms such as gr adient descent backpr opagation (gd), gr adient descent w ith adaptive lear ning r ule backpr opa- gation (gda), gradient descent with momentum backpr opaga- tion (gdm) and Levenber g-Mar quardt backpr opagation (lm). The mean squar ed err or (MSE) for test set was used as the er- r or function.
In first step, many networ ks with differ ent neur ons in hidden
2.00E-04
1.50E-04
1.00E-04
5.00E-05
0.00E+00
gd gda gdm lm
layer wer e trained with Levenber g-Mar quar dt backpr opaga-
tion algorithm. Fig.3 shows the per formance (MSE for training sets) of designed networ k with differ ent neur ons in hidden layer. It was found that the netw or k with four neur ons in hi d- den layer has MSE less than other tr ained networ ks. The MSE was 3.48e-10 for training set and 4.63e-8 for test set.
Fig. 4. perf ormance Comparison of netw ork w ith diff erent training algo- rithm
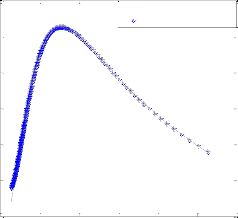
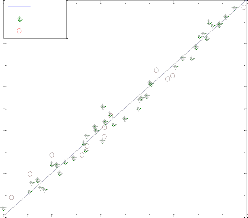
To test the pr ecision of the ANN model, a compar ison is made betw een r esults of mathematical model and ANN. Fig. 5 shows a compar ison between mathematical model r esults and pr edicted values of the outputs using optimum neur al net- wor k model with four neur ons in the hidden layer and Leven- ber g-Mar quar dt backpr opagation algorithm . These r esults confirm that the neur al networ k model can pr edict adequately the molar flow rate of methanol and Yield CH3 O H(H2 ) in the r eac- tor under differ ent feed conditions.
IJSER © 2012
Inte rnatio nal Jo urnal o f Sc ie ntific & Eng inee ring Re se arc h Vo lume 3, Issue 2 , Fe bruary -2012 6
ISSN 2229-5518
1100
1050
1000
950
900
850
Mathematical model results
ANN model results
4 Conclusions
The Pseudo-homogeneous model of methanol r eactor was
formulated and numer ically solved w ith Runge-Kutta-Verner fourth and fifth order method by MATLAB. The pr ofile of var- iation of some important parameters in this r eactor was found by pseudo-homogeneous mathematical model. The r esults of the pr oposed model compar ed to an industr ial r eactor that was very similar. The pr oposed mathematical model was used for calculation output of the r eactor against var iation of H2 /CO2 in the feed. Accor ding to the r esults of the proposed model, Yield CH3 O H(H2 ) has an optimal value in H2 /CO2 = 3. THEN a thr ee layer per ceptr on neural networ k, with four neurons in hidden layer and Levenber g–Mar quar dt training algorithm, was developed for simulation of the effect of feed composition on molar flow rate of methanol and Yield CH3 O H(H2 ). These r e-
800
0 2 4 6 8 10 12
H2/CO2
10
y=x
9 train data test data
8
7
6
5
4
3
2
sults confirm that the designed neur al networ k model is able
to pr edict molar flow rate of methanol and Yield CH3 O H(H2 ) in
the methanol r eactor under differ ent feed conditions.
Ri: ith r eaction rate
k: r eaction rate constant (kmol.kg-1 h-1 bar n )
Pi: partial pr essur e (bar )
P: total pr essur e (bar )
Fi: molar flow r ate of ith component (kmol.h -1 )
Ft: total molar flow rate (kmol.h-1 )
ρc: catalyst density (kg.m-3 )
Cpi: Molar heat capacity of ith component [kJ kmol -1 K -1 ]
A: cr oss-sectional ar ea of r eactor (m2 )
ΔHi: heat of r eaction (kJ.kmol-1 )
1
0
10.5
10
9.5
9
8.5
8
7.5
0 1 2 3 4 5 6 7 8 9 10
Measured Values
Mathematical model results
ANN model results
0 2 4 6 8 10 12
H2/CO2
[1] S hahro khi M, Bag hmishe h G R. " Mo de ling, simulatio n and co ntro l
o f a me thano l sy nthesis fixe d be d re ac to r”. Chemica l Engineering
[2] Løv ik I. “Mo de lling , estimatio n and o ptimizatio n o f the me thano l sy nthe sis with c atalyst de ac tiv atio n”. Doc to ral thesis, No rweg ian Univ e rsity o f Scie nce and Tec hno logy. 127p. 2001.
[3] Vande n Bussc he1. K. M., Fro me nt. G. F., “A S te ady -S tate Kine tic
Mo de l fo r Me thano l Synthe sis and the Wate r Gas Shift Re ac tio n o n a Co mme rc ial Cu/ZnO/Al2O3 Cataly st”. Journa l of Ca ta lysis ,vo l. 161, pp. 1–10, 1996.
[4] Raudasko ski R., Nie me lä M. and Ke iski R.L. “The e ffec t o f age ing time o n co -prec ipitate d Cu/ZnO/ZrO2 c atalysts use d in me thano l sy nthe sis fro m CO2 and H2”. Topics in Ca ta lysis ,vo l. 45, pp. 57-60,
2007.
[5] Yang R., Yu X., Zhang Y., Li W. and Tsubaki N. “A ne w me tho d o f
lo w-te mpe rature me thano l sy nthesis o n Cu/ZnO/Al2O3 c atalysts
Fig. 5. compression of mathematical model and neural netw ork
fro m CO/CO2/H2”. Fuel, Vo l. 87, pp. 443-450, 2008.
[6] Klie r K. “Me thano l sy nthesis”. Adva nces in Ca ta lysis, Vol. 31, pp. 243-
313, 1982.
[7] S krzy pek J., Lac ho wska M., Grze sik M., S łoczy ński J. and Nov ak P. “The rmo dy namics and kine tic s o f lo w pre ssure me thano l sy nthe sis”. The Chemica l Engineering Journal, vol. 58, pp. 101-108, 1995.
[8] S inadinov ic -fise r S .V, Jankov ic M. R and Radicev ic R. Z. “simulatio n
IJSER © 2012
Inte rnatio nal Jo urnal o f Sc ie ntific & Eng inee ring Re se arc h Vo lume 3, Issue 2 , Fe bruary -2012 7
ISSN 2229-5518
o f the fixe d - be d re ac to r fo r me thano l sy nthe sis”. Petroleum a nd coal, vo l. 43, pp. 31-34, 2001.
[9] Fate mi S h, Hosse ini A. “Mo de ling and simulatio n o f me thano l sy n- the sis fro m sy nthesis g as base d o n kine tic mo de l e ffec t o f CO2 in fixec be d c atalyst Cu/ZnO/Al2O3 ” The 10th Ira nin na tiona l chemical engineer- ing congress, Nove mbe r 2005, Zahe dan, Iran.
[10] S alari D, Niae i A , Ag hazade h F and Ho sse ini S.A . “Pre paratio n and
c harac te rizatio n o f hig h pe rfo rmance (Co , Cu)/Pt/γ-Al2O3 bime tallic c atalysts fo r o xidatio n o f 2 -pro pano l : Expe rime nts and ANN mo de l- ling ” The Ca nadian Journa l of Chemical Engineering, Vol. 9999, pp. 1-10,
2011.
[11] Omata K, Nukai N, Yamada M, “Artific ial Ne ural Ne two rk Aide d De sig n o f a S table Co−MgO Catalyst o f Hig h-Pre ssure Dry Re fo rm- ing o f Me thane ”, Ind. Eng. Chem. Res, Vo l. 44, pp. 296, 2005.
[12] Kito S , Ishikura T, Niwa M, Murakami Y, H atto ri T, “Applic atio n o f
ne ural ne two rk to e stimatio n o f c ataly st de ac tiv atio n in me thano l
co nve rsio n”, Ca ta l. Today, vo l. 97 ,pp. 41, 2004.
[13] Nabav i R, Niae i A, S alari D, To wfig hi J. “Mo de ling o f the rmal c rac k- ing o f LPG: Applic atio n o f artific ial ne ural”. J. Ana l. Appl. Pyrolysis , vo l. 80 ,pp. 175–181, 2007.
[14] Mo usav i S M, Nakhostin Panahi P, Niae i A, Farzi A, S alari D.” Mo d- e ling and S imulatio n o f S ty re ne Mo no me r Re ac to r: Mathe matic al and Artific ial Ne ural Ne two rk Mo de l” Interna tiona l Journa l of Scientific & Engineering Resea rch, Vo l. 3, Issue 2, 2012.
[15] Papado ko nstantakis S , Mac he fe r S, Sc hnitzle ni K, Lyge ro s A.I, “V a-
riable se lec tio n and data pre -pro ce ssing in NN mo de lling o f co mple x
c he mic al processes”, Comput.Chem. Eng, vo l. 29, pp. 1647, 2005.
IJSER © 2012