International Journal of Scientific & Engineering Research, Volume 6, Issue 3, March-2015 171
ISSN 2229-5518
STUDY ON WATER RESOURCE ACTION FOR MELUKOTE SUBWATERSHED –USING
REMOTE SENSING AND GIS
Dr.K.J.SURESHA, DR.L.PRASANNAKUMAR, DR.PRAKASH NARASHIMA, K.N AND APOORVA KIRAN
1.Department of civil Engineering , ATME college, mysore-28. 2. Department of Civil Engineering, PES engineering College,Mandya, 3. Department of Earth Science, University of Mysore, Manasagangotri, Mysore-09, 4. Department of Civil Engineering , ATME college, mysore-28.
Abstract— Karnataka being predominantly a dry farming state, Irrigation development in the state as compared to other states and the country as a whole is low. Drought is a serious problem in the state. The development of watershed area adopting integrated approach is only the key answer and is no more a secret. The Melukote sub-watershed divided into two mini and twelve micro watersheds based on the origin and flow direction of water drains / streams. Water harvesting and drainage line treatment structures were located based on the analysis of both topo-sheet and imagery of the area and taking other factors into consideration (Soil, slope and type, land use / cover, waste lands, hydro-morphology, population (labors / SC & ST population), forest cover, command area, etc.) Micro-watershed prioritization plays key role in identifying the micro-watershed, which needs immediate attention these can be taken for development with available resources, an attempt has been made for prioritization of micro-watershed based on several criteria and the total weightage of marks given was 100. Data pertaining to these criteria were generated by remote sensing and GIS and other resources. The study also proves that remote sensing and GIS when synergistically used, provide ample scope for the integration of spatial and non-spatial data which can be successfully adopted to prioritize the micro-watershed in more scientific and un biased manner.
Index Terms— Study on water Resource Action for Melukote Sub Watershed –Using RS and GIS
—————————— ——————————
Introduction
Water is the very basis of life and is the foundation for human survival and development. Sustainable and equitable use of water over millennia has been ensured by cultural adaptation to water availability through water conservation technologies, agricultural systems and cropping patterns adopted to different climatic zones, and conservation-based life styles. But in the last few decades the consequences of population growth, industrialization and urbanization, and the associated consumerist culture, have interfered with the natural hydrological cycle of rainfall, soil moisture, groundwater, surface water and storage of all sizes. This has led to overuse, abuse and pollution of our vital water resources and has disturbed the quality and the natural cleansing capacity of water. Watershed development is an important component of rural development and natural resource management strategies in many countries. A watershed is a special kind of common pool resource. An area defined by hydrological
linkages, where optimal management requires coordinated
use of natural resources by all users. The resource considerations for implementation of watershed management programs [1] or various other reasons pertaining to administration or even political considerations may limit the implementation to a few watersheds. Even otherwise, it is always better to start management measures from the highest priority micro-watershed available. Watershed prioritization is the ranking of different micro-watersheds of a watershed according to the order in which they have to be taken up for treatment and soil conservation measures [2]. These resource development programmes are applied generally on a watershed basis and thus prioritization is essential for proper planning and management of natural resource for sustainable development. The utilization of watershed resource with or without any proper vision which is observed in developing countries, in order to combat and address these problems, sustainable development is no doubt the appropriate policy \
strategy Drainage, catchment and sub catchment are the
IJSER © 2015 http://www.ijser.org
International Journal of Scientific & Engineering Research, Volume 6, Issue 3, March-2015 172
ISSN 2229-5518
fundamental units of the management of land and water, identified as planning units for fundamental units for administrative purposes to conserve natural resource. [3], [4]. The watershed management concept recognizes the inter- relationship among the linkages between the upper land and lower land use, geomorphology, slope and soil [5].
The people in the present area are facing water problems, especially in recent years due to poor replenishment of ground water. Obviously the present study focuses on the problem of water resource and how it can be handled in a better way through integrated studies. The study mainly aims at deriving strategies for augmentation of surface water resources and also to enhance the ground water potential in the area. In this regard, the techniques of remote sensing and GIS have come handy in planning the efficient usage of available water re sources, besides taking measures to augment it.
STUDY AREA AND STRUCTURES RECOMMENDED
The geographical location of Melukote sub watershed is located in the Pandavapura taluk, Mandya district of Karnataka state Fig.1. The sub watershed lies between
14O24’19.75” to 14O 32’25.08” towards North and 75o38’24.61”
to 75o40’02.41” towards East. The average MSL of the area is
637.50 Mts The area is a cluster of twelve micro-watersheds with (4B3C7D1a, 4B3C7D1b, 4B3C7D1c, 4B3C7D1d,
4B3C7D1e, 4B3C7D3a, 4B3C7D3b, 4B3C7D3c, 4B3C7D2a,
4B3C7D2b, 4B3C7D2c, 4B3C7D2d) being their respective codes. The nearest town is Mandya, which is around 20 Km from the farthest village under the study area. There is only mettle road facility. There is no state or national highways passing through the area. The study area falls under agriculture zone-III. Area receives majority of the precipitation from north-east monsoon. Drought is common in the project area usually is once in every 3-4 years. Average annual rainfall
of the area is 438.00 mm. Agriculture is the main source of
livelihood followed by the animal husbandry and allied activities. Landless and weaker sections of people depend on agriculture land and its allied activities like agriculture labore, etc.
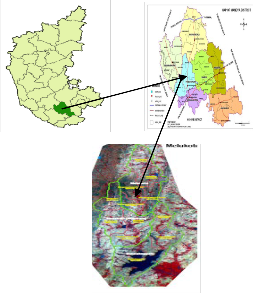
Fig.1.Location map melukote sub watershed
DATA USED AND METHODOLOGY
The area of interest lie in the watershed 4B3C as codified by the National Institute for Soil Survey and Land Use Planning (NISS&LUP) and further classified as sub, mini and micro watersheds. The drainage layers were digitized (auto caad2000, Erdas8.5 and arc map 8.12) using SOI topo-sheets (1976) and were updated/corrected using LISS III + PAN merged imagery of 1:12,500 scale (Dec.2000). the Water harvesting and drainage line treatment structures were located based on the analysis of both topo-sheet and imagery of the area and taking other factors in to consideration (Soil slope and type, land use / cover, waste lands, hydro- morphology, population ( labors population / SC & ST), forest cover, command area, etc.).
IJSER © 2015 http://www.ijser.org
International Journal of Scientific & Engineering Research, Volume 6, Issue 3, March-2015 173
ISSN 2229-5518
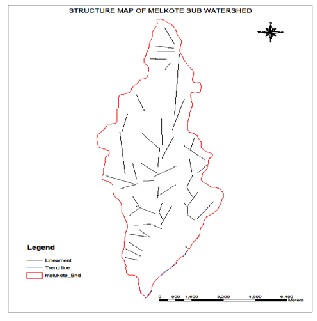
MELUKOTE SUB WATERSHED:-
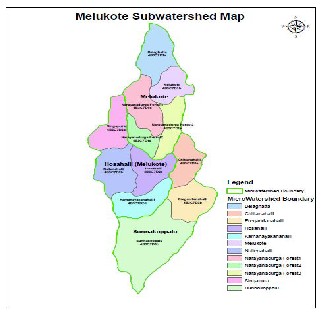
Fig.2. Micro watershed falling under Melukote Sub watershed
The Melukote sub watershed fall under southern region of Karnataka, Melukote sub watershed lies in the water resource region of the Bay of Bengal region -4 drained by Cauvery basin (4b) and includes the catchments Krisnarajasagar (4B4) and Stanley Reservoir (4B3). It is further delineated into one sub catchments and average rainfall of the area is 66mm per a month. The average ground water level of the area in the month is important and scare natural resources in the region Which needs to be used efficiently and judiciously. In addition erratic distribution and high intensity rainfall results in runoff leading to soil erosion which cause for proper water resource plan for the region based on the watershed principles and to check the runoff / soil erosion and improve the overall resources, its productivity and there by improvements liveli hood standards of people for area.
MELUKOTE DRAIN:-
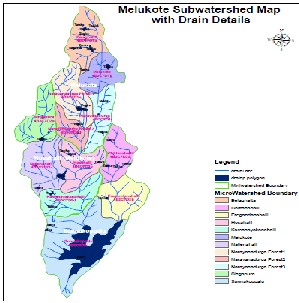
Fig.3.Drainage map of Melukote sub watershed
Drain is natural depression of the land surface. Its vertical, horizontal and the length of depression depends on bed rocks, topography, geological structure and the nature of the soil etc. many other factors like slope, rainfall and vegetation etc. also contribute for the development of a drain. The study area is represented by dendrite to sub dendrite type of drainage pattern. The dendrite drainage pattern is the most common drainage pattern characterized by branching or tree like drainage pattern. Drainage network in the present study was prepared by toposheet and Pan+liss merged data, in which the special resolution of the data is 5.8m, for this interpretation keys like tone, texture, pattern and association were used.
LITHILOGY OF MELUKOTE
IJSER © 2015 http://www.ijser.org
International Journal of Scientific & Engineering Research, Volume 6, Issue 3, March-2015 174
ISSN 2229-5518
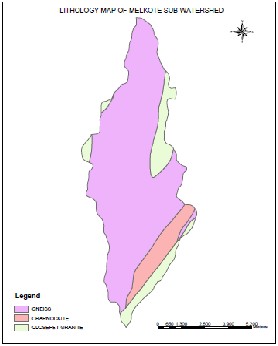
Fig.4. Lithology map of Melukote sub watershed
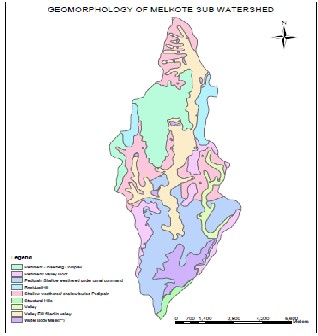
It is mainly made up of gneisses, amphibolite; and closepet granite and some places granitic rocks are intruded into the gneisses. Among the different rock types , the gneisses are predominant in the southern part of Karnataka. GEOMORPHOLOGY:- The majour geomorphological feature found in the study area are Pediments, pedeplain , valley fills … etc.,
PEDIMENTS :-Gently sloping smooth surfaces of eroded bedrocks between hills and plains with veneer of detritus lithologies like granodiorite, tonalities and migmatitic, gneisses constitute pediments. Fractures have played important role in their formation. The pediments are gently sloping, smooth rocky surfaces exposed between hill and plain with thin covering of soil. They are characterized by rugged or undulated topography. Undulated plains with small hills and mounts, which have survived the denudational process form pediment inselberg complex region of the total area. The ground water prospect in this unit is poor. They are isolated, low relief hills surrounded by gently sloping smooth
bedrocks.
Fig.5 Geomorphology map of Melukote sub watershed
As the dominant lithology in the area is granitoids, these pediments inselberg complex is also encompassed of granodiorite, tonalitic and migmatitic gneisses. These are controlled by structures like joints, fracture and lineaments. The only difference between the pediment inselberg complex and pediment inselberg is that in case of pediment inselberg, it is a single isolated low relief but in case of pediment inselberg complex it is moreThan one isolated low relief hill but occurring closely. The large area covered by hill (SH) and residual hill (SH) are observed in the study area.
PEDEPLAIN SHALLOW:-They are formed by coalescence of buried pediments, where a thick overburden of weathered materials accumulates. Varying thickness of shallow overburden can be observed in such areas. Weathering of bedrocks has been intiated by fractures, joints and minor lineaments.
PEDIPLAIN MODERATE:-Flat and smooth buried pediplain and pediment with moderately thick overburden are called pediplain moderate. Thickness of weathered materials is high
IJSER © 2015 http://www.ijser.org
International Journal of Scientific & Engineering Research, Volume 6, Issue 3, March-2015 175
ISSN 2229-5518
compared to pediplain shallow. The weathered materials is gently undulating plain of large area dotted with the several pediments, based on the depth, the pediments of the study area classified as moderat pediplain.
VALLEY FILLS:-The valley fills are shallow and mainly composed of sands, sills, clays and rock fragments. They are very limited to lateral spread in the terrain.
SLOPE MAP
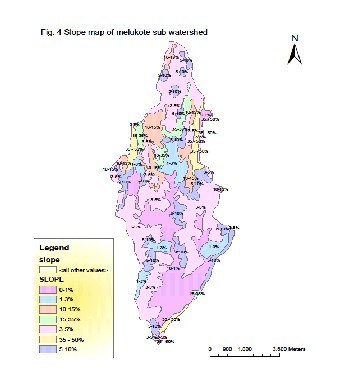
Fig.6. Slope map of Melukote Sub watershed
Slope aspect and altitude map is a very important terrain parameter from land utilization point of view. For evaluating
Table.1 Slope category of Contour spacing on 1: 50,000 (IMSD tech. guideline 1995)
various ground features of a basin and to prepare different thematic maps slope analysis is important. In the present
study slope map has been prepared on 1:50000 maps based on
the guidelines of All India Soil and Land use Survey (AIS & LUS, 1995) on slope categories (Table ). The general classification of slope following the above guidelines, the
Slope categor y | Lower and upper limit of slope percentage | Lower and upper Limit of contour Spacing |
1. | 0-1 % | More than 4 cm |
2. | More than 1% upto 3% | More than 1.33 cm and upto 4cm |
3. | More than 3% upto 5% | More than 0.8 cm and upto 1.33 cm |
4. | More than 5% upto 10% | More than 0.4 cm and upto 0.8 cm |
5. | More than 10% upto 15% | More than 0.26 cm and upto 0.4 cm |
6. | More than 15% upto 35% | More than 0.11 cm and upto 0.26 cm |
7. | More than 35% | 0.11cm and less |
survey of India topo sheet in 1:50,000 scale has been used which gives 20 meter contour interval. The closely spaced contour indicate higher order slope. The slope categories are given below.
Slope area of the study area in sq. km
Table.1a
Slope code | Slope area/in sq km | Slope area/in percentage |
1 | 212.07 | 85.21 |
2 | 19.06 | 7.66 |
3 | 2.29 | 0.92 |
4 | 3.97 | 1.59 |
5 | 2.33 | 0.94 |
6 | 3.78 | 1.52 |
7 | 5.37 | 2.16 |
SLOPE MAP:-
IJSER © 2015 http://www.ijser.org
International Journal of Scientific & Engineering Research, Volume 6, Issue 3, March-2015 176
ISSN 2229-5518
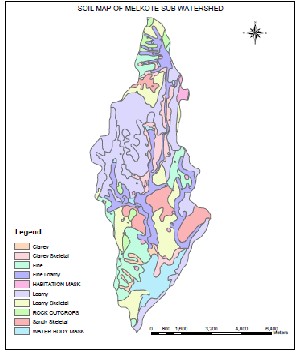
Fig.6. Soil Map of Melukote sub watershed
The soils on any map unit differ from place to place in their characteristic and management. The brief description of soil series and phases mapped are given. The soil map can be used for identifying the suitable areas for specific uses, viz., agriculture, articulture, sericulture, agro foresty, etc, the standard soil map has been interpreted for various themes like soil availability water capacity, soil depth , surface gravel, soil erosion, slope, land capability, land irrigability, soil salinity, land suitability etc. The soil information from the study area were classified into several type, like clayey, clayey skeletal, fine, fine loamy, loamy, loamy skeletal, sandy skeletal. The erosion of top soil decrease the productivity of land and leads to failure of crops
GROUND WATER PROSPECT
Hydro geomorphology of the study area is represented in fig. Geomorphic unit-wise ground water prospect zones their subsurfaces phenomenon, its identification and location are
based on indirect analysis of some directly observable terrain
features like geological structures, geomorphologic features and their hydrologic characters.
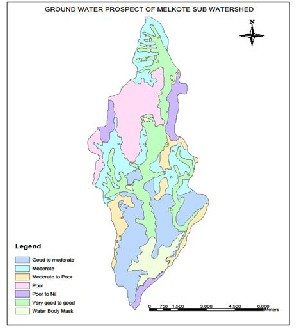
Fig.7 Ground water prospect map of Melukote sub watershed
Remote sensing has also helped for better observation and
more systematic analysis of various geomorphologic units. RECHARGE GEOMORPHIC UNIT OF THE STUDY AREA: Residual hill(RH), pediment(PD) pediment inselberg (PI) and pediment inselberg complex (PIC) are the regions of medium to high slope gradient (slope category 4-7). In these regions infiltration is less and obviously runoff is more. water gets recharged here, but moves towards pediplain shallow (PPS), pediplain moderate (PPM), pediplain shallow command (PPSC) and pediplain moderate command (PPMC) regions.
LINEAMENT MAP:
IJSER © 2015 http://www.ijser.org
International Journal of Scientific & Engineering Research, Volume 6, Issue 3, March-2015 177
ISSN 2229-5518
since it involves an integrated approach. an attempt was made to prioritization micro-watershed was done based on several criteria like rainfall, slope, wasteland, forest cover, irrigated area, soil type, SC / ST population and geo-morphology of the area and the total weigtage of marks given in table. PRITIZATION MAP OF MELUKOTE SUB WATERSHED
Fig.8, Lineament map of Melukote Sub watershed
Structurally, the area displays shears, joints, faults and lineaments which appear to be moderate; they too have played some role in ground water percolation. As joints, factures and shears are smaller and localized; they could not be quantified through remote sensing data. However linear features like lineaments have been quantified. The most of the drainage is controlled by lineament in the study area. Many structural features like folds axis, faults and shears, besides dyke bodies normally appear on remote sensing data products as lineaments. Often the lineaments develop in a systematic way and hence a methodical statistical analysis of a lineament pattern provides information regarding their technique and relevance to ground water movement.
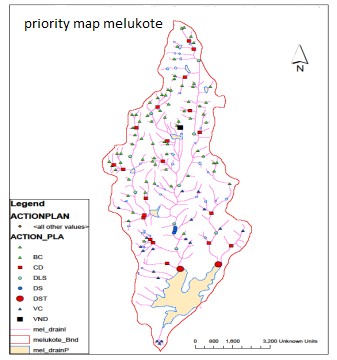
MICRO WATER PRIORITY MAP
Prioritization of micro-watershed plays key role in identifying the micro-watershed, which need immediate attention or action plan those can be taken of development with available resources, which is also facilitate addressing the problematic areas to arrive at suitable solutions. The resources based
approach is found to be realistic for watershed prioritization
Fig. 9.Micro water prioritization of Melukote sub watershed Data pertaining to these criteria were generated by remote sensing and GIS and other resource. Based on this analysis, we found the scores (Table.2
IJSER © 2015 http://www.ijser.org
International Journal of Scientific & Engineering Research, Volume 6, Issue 3, March-2015 178
ISSN 2229-5518
TABLE.2.Water Harvesting Structures Recommended for Melukote Sub-Watershed
Mwsd- name | VC | BC | DS | VD | C D | DST | DLS |
Belaghata | - | 9 | - | - | 3 | - | - |
Melukote | - | 8 | - | - | 1 | - | 1 |
Narayana durga Forest 1 | - | 14 | - | - | 1 | - | 1 |
Narayana durga Forest2 | - | 6 | - | - | 1 | - | - |
Narayana durga Forest 3 | - | 5 | - | - | 1 | - | 1 |
Singapura | - | 14 | - | - | 3 | - | - |
Nallenahal li | 1 | 6 | - | - | 3 | - | 1 |
Hosahalli | 2 | 2 | - | - | - | - | - |
Kamanaya kanahalli | 6 | 2 | 3 | - | 2 | - | - |
Chitanahal i | 4 | - | - | - | 1 | - | - |
Eregondan ahalli | 2 | - | - | - | 2 | - | - |
Sunnakop palu | 2 | - | - | 4 | - | 2 | - |
(VC= VEGETATIVE CHECKS, BC= BOULDER CHECK,DS=DROP STRUCTURE,VD=VENTED DAMS, CD=CHECK DAM, DST= DESILTATION TANK, DLS=DRAINAGELINE STABILAZATION)
TABLE.3 PRIRITY TABLE
TABLE 3. Prority table of melukote sub watershed
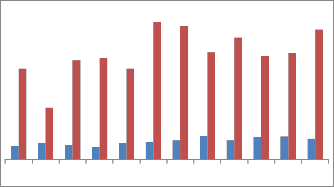
Rain fall data of study area
IJSER © 2015 http://www.ijser.org
International Journal of Scientific & Engineering Research, Volume 6, Issue 3, March-2015 179
ISSN 2229-5518
52.1150.52
46.16
49.24
moderate slopes to check velocity of runoff and further erosion of soil.
34.39
37.5238.46
34.45
40.53
39.1840.32
Boulder Checks: The BCs are located to 1st order drains running through lands having little or no top soil to check
19.67
5 6.3 5.4 4.7 6.3 6.5 7.2 8.9 7.3 8.6 8.7 7.9
JAN FEB MAR APR MAY JUN JUL AUG SEP OCT NOV DEC
Fig. Melukote rain fall data
STRUCTURE RECOMMENNDED
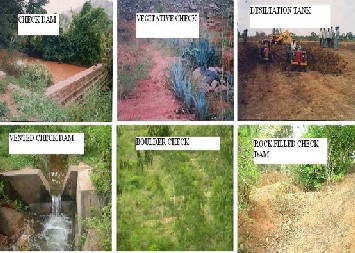
Check Dam: The CDs are located for 2nd and 3rd order drains to chick runoff velocity and provide more time for water to infiltrate and reduce soil movement further down.
Vented Check: The VCs are recommended to streams which are originating from and running through large forest catchment area at the point of joining plains / agriculture lands to slow down
the running water force.
Vegetative Checks: The VCs are located for the 1st order drains running through agriculture lands having gentle to
runoff velocity and prevent the damage to drains downstream.
Vegetative Boulder Checks: To check the velocity of runoff and conserve soil, VBCs were recommended to streams running through lands having soil with low infiltration rate and high runoff.
De-siltation of tank: De-siltation of tanks is recommended to those tanks which are losing their carrying capacity due to encroachment by scrubsbut, have more number of water feeding streams to rejuvenate the tank life and productivity and improve ground water potential
.
Drainage Line Stabilization / Nala Revetment: The DLSs and NRs were recommended to 2nd and 3rd order drains at the point of sharp curves to prevent damage to stream bunds. Stony masonry work / vegetation cover is given to prevent bank erosion.
All the above suggested water harvesting structures with respect to the specific sites is based on remote sensing data interpretation aided by field checks.
Prioritization and Conclusion
Prioritization of micro watershed plays key role in identifying the micro watershed, which need immediate attention for development with available resources, an attempt was made to prioritization of micro watershed using criteria like different thematic layers and SC/ST population and geomorphology of the area and the total weightage of marks given was 15
The present work was taken up in order to appraise the area
IJSER © 2015 http://www.ijser.org
International Journal of Scientific & Engineering Research, Volume 6, Issue 3, March-2015 180
ISSN 2229-5518
hydrologically by employing remote sensing and GIS techniques, as these techniques would provide quicker, more precise and holistic view of any basin. The important objectives of the study have been
1 Mapping of lineament, drainage network, soil, land use/land cover, Geomorphology units and their interpretation for surface flow and groundwater accumulation.
2 Preparation of drainage map using topomap and updating with the missing drainage using Pan+Liss merged data
3 Preparation of slope map, gradient study with respect to surface water dynamics and groundwater infiltration.
4 Categorization of micro watersheds within the main
watershed for water resource management planning.
5 To suggest water harvesting structures at suitable locations to improve Ground water, besides and to prevent soil erosion.
At the same time all the surface water sources are not
harnessed to the full potential which still put great stress on ground water for domestic and agricultureneeds. Hence a concentrated effort is necessary for the proper planning and management of the available water resources like, geomorphology, geological, hydrogeological study, ground water fluctuation.
Selection of potential zones of ground water exploration in gneiss and schistose terrain requires detailed hydrological study. Water resources in such terrain depend on the network of fractions and thickness of the soil cover apart from other parameters like rainfall and climate. Ground water exploration method includes: Geomorphologic analysis, Assessment of hydro meterological elements, geological and structural mapping, remote sensing and image interpretation, soil cover and land use pattern, Hydro geological
investigation etc. The integrated approach can be decipher the
probable potential zone of ground water exploration in area to generate level of success.
References
1) Reddy,P.R. and Bhattacharya, A.(1992) Prognostic model in groundwater exploration, NRSA report (unpublished)51p.
2) Tomlin, C.D., and Berry.,J.K.,(1979) A Mathematical structure for cartographic modelling in environmental analysis, proceedings of the Americal congress on surveying and mapping. Falls church VA. American congress on surveying and mapping
3) Tomlin, C.D.(1991) Cartogrpahic modelling ; In D.J.
Maguire.M.F.Good child and D.W.Rhind (eds) geographical information system: principles and application, Harlow,Long man.
4) Berry, J.K. (1982) Cartographic modelling procedures for extending the utility of Remotely sensed data: In B.F. Richason(ed) remote sensing ; An input to geographic information system systems in the 1980’s proceeding of the pecoras symposium
5) Krishnamurthy. J., Venkatesha Kumar, N., Jayaraman, V. and Manivel, M. (1996) an approach to demorcate groundwater potential zones through remete sensing and a geographical information system.Intl.Jour.Rem.Sen.v.17(10), pp.1867-1884.
6) Krishnamurthy, J. (1991) Comparative evaluation of Indian remote sensing satellite and Landsat Thematic mapper data for geological and geomorpnological application, Jr. Geocarto International, v.6 (3),pp.39-
52.
ACKNOWLEDGEMENT : The first author Dr.k.j Suresh is
IJSER © 2015 http://www.ijser.org
International Journal of Scientific & Engineering Research, Volume 6, Issue 3, March-2015 181
ISSN 2229-5518
expresses their heartfelt thanks to the beloved Chairman Sri.L.Arunkumar, ATME, College of Engineering for all supports and encouragement for carrying out this study and extend thanks to Shiva Shankar Vice chairman and Veeresh for support, and also extended my thanks to principal Dr.L.Basavaraju, ATME, College of engineering, finally extended thanks to Prof. K..N. Prakash Narashima, Dept. of Earth Science, University of Mysore, Mysore for
moral support
IJSER © 2015 http://www.ijser.org