International Journal of Scientific & Engineering Research, Volume 5, Issue 1, January-2014 1624
ISSN 2229-5518
STUDY OF SERUM IRON,TIBC & SERUM FERRITIN LEVELS IN RURAL WOMEN SUFFERING FROM IRON DEFICIENCY ANEMIA
Ms.Shaik.Haseena, Dr.Zahida Nasreen, Dr.Mohammed Siddique Ahmed Khan, Dr.N.V.S Choudhary, Dr. Ghouse M. Ali.
IJSER
1 INTRODUCTION
Iron deficiency anaemia is a most common disorder which occurs mostly in women of pre-menopausal age. It occurs mostly in women of rural areas who are suffering from poverty. Most of them are suffering from malnutrition, which is a primary cause of development of iron deficiency anaemia. The secondary cause of iron deficiency anaemia is excess blood loss during menstrual cycle. Most of the women in rural areas are working as farmers,factory workers, tailors, their earning is low and the family members are more so they depend on cheaper foods which are of less nutritive value.
Iron is essential to life to serve as both electron donor and electron acceptor. Iron deficiency anaemia is one of the most wide spread diseases all over the world.
In India 5-6% of general population suffers from this disease. It is prevalent in 3% among men & 10-14% among women.In specific groups like slum dwellers, plantation labourers& pregnant women the prevalence rate is 30-50% or even more.
A low serum iron & ferritin with an elevated TIBC are diagnostic of iron deficiency. While a low serum ferritin is virtually diagnostic of iron deficiency, a normal serum ferritin
can be seen in patients who are deficient in iron & have co existent diseases (Hepatitis, anaemia of chronic disorders).The test findings are useful in distinguishing iron deficiency from other microcytic anaemia’s.
1. Shaik.Haseena ,Tutor, Department of Biochemistry, DR.V.R.K. Women’s Medical College, Teaching Hospital
&Research Centre, Aziz Nagar, R.R District ,Hyderabad-
500075,AP,India.
2.Dr.ZahidaNasreen,Professor, Department of Biochemistry, DR. V.R.K. Women’s Medical College ,Teaching Hospital
&Research Centre, Aziz Nagar,R.R District,Hyderabad-
500075,AP,India.
3. Dr.MohammedSiddique Ahmed Khan ,Associate Professor, Department of Biochemistry,Shadan Institute Of Medical Sciences, Teaching Hospital & Research Centre,Hyderabad-
500075,AP,India
4.Dr.NVSChoudhary, Head of the department, Department of Biochemistry, Principal, NRI Medical college &General Hospital,Guntur District,AP,India.
5. Dr. Ghouse M. Ali, Professor Emeritus, Department of
Biochemistry, Dr. V.R.K. Women’s Medical College,
IJSER © 2014 http://www.ijser.org
International Journal of Scientific & Engineering Research, Volume 5, Issue 1, January-2014 1625
ISSN 2229-5518
Teaching Hospital &Research Centre, Aziz Nagar,R.R District,Hyderabad-500075,AP,India.
2 AIMS AND OBJECTIVES
a. To assess the cause of iron deficiency anaemia in reproductive age group women of rural areas.
b. To determine the Haemoglobin levels of blood & also to determine the changes of serum iron, TIBC, serum Ferritin in reproductive age group women of rural areas who are suffering from iron deficiency anaemia.
3 MATERIALS AND METHODS
The study was a hospital based study conducted at NRI Medical College& General Hospital Guntur District,AndhraPradesh
A case control type study was done on patients who attended
Haemoglobin is determined by Aperture Impedence method.
Principle: The number of pulsar is eqvivalent to the no. of cells passing through the orifice during the period
3.4 DETERMINATION OF SERUM IRON
PHOTOMETRIC COLORIMETRIC TEST FOR IRON WITH LIPID CLEARING FACTOR (LCF) BY CHROMOAZURAL B (CAB) METHOD
AIM: To determine the amount of iron present in the serum by chromoazural b method.
PRINCIPLE: Iron III reacts with chromoazural b (CAB)
&cetyltrimethyl ammonium bromide (CTMA) to form a coloured ternary complex with an absorbance maximum at
623 nm. The intensity of the colour produced is directly proportional to the concentration of iron in the sample.
The test can also be used in combination with the TIBC kit
(ref 10670)
the out patient departmentsinIthis hosJpital. SER
3.1 SOURCES OF DATA
a. INCLUSION CRITERIA
1) 50 women of rural areas & are of age group 15-45 years who are suffering from iron deficiency anaemia (microcytic hypochromic) with Hb<10 gms are selected for this study.as cases.
2) 50 women of same age who are not suffering from iron deficiency anaemia (Hb>10gm%) are selected as controls for this study.
3) Only rural areas women of reproductive age are selected for this study because of prevalence of iron deficiency anaemia is more in them when compared to urban population.
b. EXCLUSION CRITERIA
1) Women who are suffering from liver diseases & pregnant women are excluded from this study.
3.2 SPECIMEN COLLECTION:
Blood samples were collected from cases & controls & the samples are centrifuged for the estimation of serum iron,
TIBC, ferritin levels.
CONTENTS:
TABLE-1
3.3 HAEMOGLOBIN DETERMINATION
IJSER © 2014 http://www.ijser.org
International Journal of Scientific & Engineering Research, Volume 5, Issue 1, January-2014 1626
ISSN 2229-5518
REAGENT STABILITY:
RGT is stable even after opening up to the stated expiry date when stored at 2….25˚c
Contamination of the reagents is absolutely avoided.
SPECIMEN:
Serum or heparinisedplasma.
Do not use EDTA plasma, CITRATE plasma or haemolytic sera.
NOTE:
Lipemic specimens usually generate turbidity of the sample reagent mixture which leads to false high results.
ASSAY: Wavelength: 623nm,Hg 623nm.
CALCULATION OF THE IRON CONCENTRATION WITH STANDARD:
If a different wavelength (620nm-640nm)is to be used for measurement the standard provided with the kit has to be employed for the calculation.
∆ A Sample
![]()
C = 10 x ∆A STD µg/dl.
∆A sample
![]()
C = 17.9 X ∆A STD µ mol/l
This test is linear up to an iron concentration of 500µg/dl or
89.5µmol/l.
Optical path: 1 cm
Temperature: 20-25˚c
REFERENCE VALUES:
MALE: 59-148 µg/dl or 10.6-28.3µ mol/l. FEMALE: 37-145µg/dl or 6.6µ mol/l.
Measurement: Against reagent blank (Rb).
Only one reagent blank per series is required.
PIPETTING SCHEME: TABLE-2
STANDARDIZATION:
Standard provided in the kit is used.
Standard 1:1 dilution = STD50ml + water 50 ml→50µl
=25µg.
3.5 TOTAL IRON BINDING CAPACITY
AIM: To determine the Total iron binding capacity. PRINCIPLE: The iron binding protein transferrin in serum is
saturated upon treatment with excess of FE(III)ions.
Unbound (excess) iron is adsorbed onto aluminium oxide and precipitated .The transferrin bound iron (TIBC) in the supernatant is then determined.
CONTENTS: TABLE-3
FE | 1 X 100 ml iron solution |
Iron III-CHLORIDE | 0.09mmol/l |
IJSER © 2014 http://www.ijser.org
International Journal of Scientific & Engineering Research, Volume 5, Issue 1, January-2014 1627
ISSN 2229-5518
ALOX 2 X 25 g aluminium oxide
Measuring spoon for aluminium oxide is used![]()
PROCEDURE:
Pipette into reaction tube Fe 1.0ml Sample 0.5ml
mix well after 3-5 min add one level measuring spoonful of aluminium oxide ALOX (approximately 0.25-.35g).Cap and place on a rotator or roller mixer for 10min.
Remove tubes and allow standing for 3min upright or centrifuge for 1 min at 5,000rpm.![]()
CALCULATION OF IRON CONCENTRATION: C = 100 X ∆A sample µg/dl
SAMPLE CENTRE:
Sample and all AXSYM Ferritin reagents required for one test are pipetted by the sampling probe into various wells of a reaction vessel (RV).
Sample is pipetted into one well of the RV.
Anti-Ferritin coated micro particles, Anti ferritin Alkaline phosphatase conjugate, specimen diluent and tris buffer are pipetted into another well of RV.
The RV is immediately transferred into the processing centre. Further pipetting is done in the processing centre with the
processing probe.
PROCESSING CENTRE:
A n aliquot of the specimen diluent,conjugate,micro particles
&Tris buffer mixture is pipetted and mixed with the sample
.The ferritin enzyme labelled antibody and micro particles bind forming an antibody –antigen-antibody complex.![]()
![]()
∆A STD C = 17.9 X ∆A sample
Complex bound to the micro particles is transferred to the
matrix cell. The matrix cell is washed to remove unbound materials.
The substrate,4-methyl umbelliferyl phosphate ,is added to the
∆A STD µmol/l
CALCULATION FOR TIBC:
To calculate the TIBC multiply the result of the iron determination in the supernatant by the diluent factor 3.
TIBC = C (IRON) X 3. REFERENCE VALUES: TIBC: 274-385µg/dl.
3.6 DETERMINATION OF SERUM FERRITIN BY MEIA METHOD:
AIM: To determine serum ferritin by Ax SYM micro particle enzymes (MEIA) assay technology.
BIOLOGICAL PRINCIPLES OF THE PROCEDURE: AxSYM Ferritin is based on micro particle enzyme (MEIA)
technology.
Sample and all AxSYM Ferritin reagents required for one test are pipetted in the following sequence.
matrix cell and the fluorescent product is measured by the
MEIA optical assembly.
4. RESULTS
The present study was carried out to determine the levels of blood Haemoglobin,levels of serum iron, TIBC, serum Ferritin in reproductive age group women of rural areas suffering from iron deficiency anaemia, and to assess the causes of iron deficiency anaemia.
The Haemoglobin values of the cases and controls are taken to confirm anaemia.
The investigations performed in this study include theserum ferritin levels, serum iron & total iron binding capacity&Hb levels.
The Hb levels among cases& controls are 6.544±1.5992,
11.6184±0.9064 &Hb levels are decreased in cases & remains within normal range in controls. The difference is statistically significant (p<0.0001).
The serum iron levels among cases & controls are 18.6326 +
6.05080 & 69.0408 + 23.5248 serum iron is decreased in cases
IJSER © 2014 http://www.ijser.org
International Journal of Scientific & Engineering Research, Volume 5, Issue 1, January-2014 1628
ISSN 2229-5518
& remains within normal in controls. The difference is highly
significant (p˂0.0001).
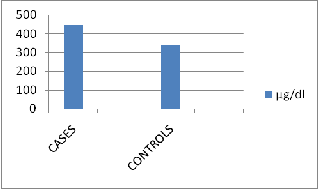
The TIBC values among cases & controls are 447.245
+31.3166 among cases & 340.7347 + 30.4451 in controls, TIBC levels are increased in cases and remains within normal range in controls .This difference is highly significant (p˂0.0001).
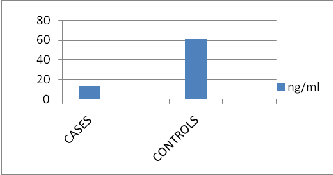
The serum Ferritin levels among cases & controls are 13.6747
+ 38.2765 & 61.4241 + 56.4806 serum Ferritin levels are decreased in cases & remains within normal range in controls
.This difference is highly significant(p<0.0001).
Nearly 46% of the women in this study are suffering from iron deficiency anaemia due to blood loss during menstruation.
Nearly 18% of the women are suffering from iron deficiency anaemia due to malnutrition caused by poor socio economic
conditions.
HAEMOGLOBIN LEVELS (MEAN±SD) IN CASES &
CONTROLS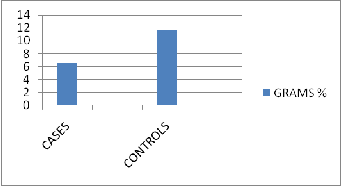
There is significant difference in Hb values among cases & controls,with mean Hb value of 11.6184±0.9064,among controls & 6.544±1.5992 in cases.
20% of the women are suffering from iron deficiency
anaemia due to blood loss IduringJmenstruationS& due to ER
malnutrition.
The age group of women who were severely affected by iron deficiency anaemia in this study were of age group 30-45 years.
Thus the present study suggests that serum iron, serum ferritin, levels are decreased &TIBC level is elevated in iron deficiency anaemia. Blood losses during menstruation, malnutrition, due to poverty are predicted as the cause for prevalence of iron deficiency anaemia.
Thus the present study reveals that women of rural areas should be screened at the reproductive age of 30-45yrs & should be treated.
4.1 HAEMOGLOBIN: Two sample t-test
t = -19.23 p<0.0001 df = 75
TABLE -1
HAEMOGLOBIN LEVELS (GMS%) IN CASES &
CONTROLS
4.2 SERUM IRON
Two sample t-test
t = -14.53 p ˂ 0.0001 df = 54
TABLE-2
Serum Iron level (µg/dl) in controls & cases
Serum Iron Levels (Mean+ SD) in controls & cases
IJSER © 2014 http://www.ijser.org
International Journal of Scientific & Engineering Research, Volume 5, Issue 1, January-2014 1629
ISSN 2229-5518
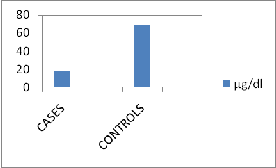
There is significant difference in serum iron values among cases & controls with mean serum iron value of 18.6326+
6.05080 in cases & 69.0408+23.5248 in controls.
4.3 TIBC:
Two sample t-test
P=17.07, p <0.0001 df = 95
TABLE-3
There is significant difference in TIBC values among cases & controls, with mean TIBC value of 447.245+31.3166 amongcases & 340.7347 + 30.4451 in controls.
4.4 SERUM FERRITIN: Two sample t-test
t = -4.90 p˂0.0001 df =84
Serum TIBC LEVELS (µg/dl) in controls & cases
IJSETABLE-4 R
Serum Ferritin levels (ng/ml) in cases & controls
SERUM FERRITIN | CASES n = 49 | CONTROLS n = 49 |
MINIMUM | 0.41 | 6 |
MAXIMUM | 245.97 | 217.74 |
MEAN | 13.6747 | 61.4241 |
S.D | 38.2765 | 56.4806 |
SIGNIFICANCE /z/ =6.7186˃1.96,df= 96,p=0.05 |
There is significant difference in serum ferritin values among
cases & controls,with mean serum ferritin value of
13.6747+38.2765 among cases &61.4241 + 56.4806 among controls.
IJSER © 2014 http://www.ijser.org
International Journal of Scientific & Engineering Research, Volume 5, Issue 1, January-2014 1630
ISSN 2229-5518
5.DISCUSSION
In the present study the main focus is to determine the levels
prevalence of iron deficiency appears to be due to malnutrition.
In a study done byAnne MKis, MD &Molly Carnes,MD4.
Showed serum Ferritin level of ≤100µg/L.
In a studyconducted byRodriquez. Blanco. A Cunningham, et.al showed,that haemoglobin concentration was low, serum iron concentration is also decreased, ferritin (<12ng/dl)and folate (<6ng/dl).Their conclusion was iron deficiency in women of reproductive age was the main cause of anaemia followed by folate deficiency. In the present study also,iron
level was decreased, ferritin level was also decreased5.
6
of Haemoglobin, serum iron, TIBC& serum ferritin in
In an article by Irene Alton
the findings were as follows
reproductive age women who are suffering from iron deficiency anaemia.
serum ferritin is decreased i.e. ˂15µg/l.Iniron deficiency
anaemia.
The Haemoglobin Values are less than 10gm% then they
In the present study TIBC levels are elevated
7,8
in cases of
are considered as anaemic and then iron ,ferritin & TIBC
levels are estimated .
A low serum iron and ferritin with an elevated TIBC are
iron deficiency when compared with controls with significant
values of with mean ± S.D TIBC value of 447.245±31.3166 among cases & 340.7347±30.4451 in controls (p<0.0001)
9,10,11
IJSER
diagnostic of iron deficiency. While a low serum ferritin is
Serum iron is decreased
with insufficient dietary iron,
virtually diagnostic of iron deficiency, a normal serum ferritin can be seen in patients who are deficient in iron and have co existent diseases (Hepatitis, anaemia of chronic disorders).
These test findings are useful in distinguishing iron deficiency anaemia from other microcytic anaemia’s.Anaemia is estimated to effect 2000 million people mostly in the developing countries. Whatever the underlying cause may be, poor socio economic conditions, lack of health education, & in adequate health facilities in rural areas of the developing countries further aggravate the severity of the problem.
Most of the earlier research on anaemia in different parts of the world was mainly focussed upon young children & women of childbearing age.
The red cell indices like Hb,the levels are significantly decreased shown in a study conducted by Anne M
Kis,MD&Molly Carnes,MD1 .
By conducting this study effort was made to address this problem in reproductive age women of rural areas. This study reveals that anaemia is more severe in age group 30-35 years. Researchers like, Hameed. A, Simon. J et.al had almost
similar observations as the findings in this study2.
In a study done by Buchanan JG, Nixon AD, et.al3, showed that the serum ferritin values of less than 10µg /L. The high
chronic blood loss, & inadequate absorption of iron &
impaired release of iron stores as in inflammation, infection & chronic diseases. The combination of low iron, high TIBC indicates iron deficiency. Without all of these findings together, iron deficiency is unproven. Low ferritin supports the diagnosis of iron deficiency, reported by Finch CA & Huber’s
H12.
In the present study the prevalence of iron deficiency anaemia in reproductive age women of rural areas is high; the causes are observed by going through their case history, are malnutrition, due to poor socio economic status, and menstrual blood loss.
Present study is supported by a study done by Assami. M, S.Galan, on assessment of nutritional status of Algerian women13 ,the study states that iron deficiency anaemia is occurring in 32% rural women ,19% semirural women ferritin levels were also low .Researchers like Vicki. L. Cleaver14 et.al in their studies stated that the causes for iron deficiency anaemia in reproductive age women of rural areas are due to parasitic infections, poor eating habits, due to poor socioeconomic status, GIT infections and menstrual blood loss.
In a study conducted by Teresa Shamah15- Levy,M.Sc, the results on the prevalence & distribution of anaemia among women of childbearing age (12-49yrs)participating in the 1999
National Nutrition Survey (NNS-1999).The results were ,the
IJSER © 2014 http://www.ijser.org
International Journal of Scientific & Engineering Research, Volume 5, Issue 1, January-2014 1631
ISSN 2229-5518
overall prevalence of anaemia was 27.8% in pregnant women
& 20.8% in non – pregnant women. Higher prevalence’s were observed in rural areas women and they concluded that anaemia in women of child bearing age is a growing public health problem.
In a study done by Anshu Sharma, et.al16 .To obtain baseline data on haemoglobin (Hb) levels of adolescent girls belonging to the low-socio-economic groups. Results were 61.9% of the subjects in the urban and 85.4% in the rural area were anaemic. In adolescent girls of poor communities.In developing countries like India. These results were consistent with the present study.
In a study conducted by Rodrequez .s Blanco.ACunningham,et.al.showed ,that Haemoglobin concentration was low ,serum iron is decreased, serum ferritin decreased5 (<12ng/dl),&folate(<6ng/dl).Their conclusion was iron deficiency anaemia in women of reproductive age was the main cause of anaemia followed by folate deficiency.
Thus the above findings for the causes of iron deficiency anaemia in these women are due to nutritional disorders and
In a study by T Leenstra,JD Kurtis18,et.al, they stated that iron
deficiency anaemia results as a cause of malnutrition,parasitic infection,poverty ,Results were Hb<120g/l,ferritin
<12µg/l.The prevalence of iron deficiency anaemia in girls was high.
Thus our study shows that the cause of iron deficiency anaemia is not only the low haemoglobin concentration but also low serum iron, high TIBC & very low Serum ferritinis the cause to assess the iron deficiency anaemia.
ACKNOWLEDGEMENT:
We are extremely thankful to Dr.SARIB RASOOL KHAN- Managing Director Dr. V.R.K. Women’s Medical College, Teaching Hospital & Research Centre, and Allied Hospitals for his continuous encouragement and support.
6. REFERENCES
1.Detecting Iron Deficiency in Anaemic Patients with
Concomitant Medical Problems Anne M Kis,MD and Molly
IJSER
particularly women of reproductive age and constitute a major
health issue in many developing countries.
The following results for the causes of iron deficiency anaemia in these women are given by observing their dietary habits, menstrual history, which were taken in the case history and are given in percentage.
Nearly 46% of the women in our study are suffering from iron deficiency anaemia due to blood loss during menstruation.
Nearly 18% of the women are suffering from iron deficiency anaemia due to malnutrition.
20% of the women are suffering from iron deficiency anaemia due to blood loss during menstruation & malnutrition.
34% of the women suffering from iron deficiency anaemia due to other infections, because of lack of poor sanitation. When compared with cases & controls in evaluating the causes for iron deficiency anaemia.
In a study conducted byJoel Monarezz17Homerromartinez,Ted greines et.al on iron deficiency in Tarahuamara women of reproductive age in northern mexico, they stated that iron deficiency anaemia is primarily due to lack of dietary iron,hookworm infection, blood loss during menstruation, in their findings serum ferritin levels were decreased ,their findings were consistent with present study.
Carnes,MD.
2.Prachi,pi, Hameed A,Simon j, Jamil A , Nawab G. Prevalence of anaemia in urban areas of Peshawar ,Pakistan.A challenge for health professionals & policy makers.J Pak med Assoc.1997:47(2):49-53.
3.Shah A. Iron deficiency anaemia-Part-I .Indian J Med Sci
2004; 58:79-81.
4.Detecting Iron Deficiency in anaemia patients with concomitant Medical Problems Anne M Kis,MD&Molly carnes,MD.
5. Helen Keller international,iron deficiency report,1998 on iron deficiency anaemia throughout the life cycle of rural Bangladesh.
6. Joel Monarezz,M.C,M.en.C M.sc phd,Ted.
7.Finch, C.A & Huber’s H(1982) Perspectives in iron metabolism. NewEngle.J.Med.306, 1520.
8. Firkin F & Rush B. Interpretation of Biochemical tests for iron deficiency: diagnostic difficulties related to limitations of individual tests. Australian prescribed.1997;20-74-6.
9. HannHW,Kim CY ,London WT,et al 43 (3):376-9.
‘’Increased serum Ferritn in chronic liver disease:A risk factor for primary Hepatocellular carcinoma’,Int J Cancer,1989.
IJSER © 2014 http://www.ijser.org
International Journal of Scientific & Engineering Research, Volume 5, Issue 1, January-2014 1632
ISSN 2229-5518
10. Dallmanp.Biochemical basis for the manifestation of iron deficiency Ann Rev Nutr 1986:6:13-40.
11. Firkin F & Rush B.Interpretation of biochemical tests for iron deficiency:diagnostic difficulties related to limitations of individual tests.Australian prescribed.1997:20-74-6.
12. Finch,C.AHubers,H. (1982) perspectives in iron metabolism .New Engle.J.Med.306,1520.
13.Assessment of the nutritional status of Algerian Women in the reproductive age living in an urban ,rural&semi-rural area AssamiM,GalanP,Assami A, Potier de Courcy G. Hercberg S.
14. IRON DEFICIENCY ANAEMIA IS AN IMPORTANT CONTRIBUTOR TO ANAEMIA AMONG REPRODUCTIVE AGE WOMEN IN LEBANON by NAHLA (BABA) A1,, NADA ADRAA1,ROBERT JACKSON American University of Beirut ,University of Maryland, USA.
15.Teresa Shamah-Levy, M.sc; Salvador Villalpando ,MD, Sc. Dr; Juan A Rivera,MS,Phd;FabiolaMejia- Rodriguez,B.sc;Martha Camacho-Cisneros,BSc;Eric A Monte Rubio,BSc Centro de Investigacion en Nutricion Y Salud, InstitutoNacional de SaludPublica , Cuernavaca, Morelos, Mexico.
16. Identification of appropriate strategy to control anaemia in adolescent girls of poor communities. Anshu Sharma, Kantiprasad, Visweswararao.
17. Joel Monarezz, M.C, M.en. C M.sc,Phd,Ted.
18.Prevalence and severity of anaemia & iron deficiency
:cross – sectional studies in adolescent school girls in western
Kenya T Leenstral,SkKariukil,JD Kurtis,AJ Olool, P A kager2
& F O terKuilel.
7. CASES AND CONTROLS DATA CHART
7.1 TABLE SHOWING THE PATIENTS (CASES) NAME AND THEIR CORRESPONDING DATA
CASES:
NAME | AG E | Hb(g m) | SERU M IRON | TIB C | SERUM FERRIT IN |
V.NAGALAKSHMI | 15 | 5 | 25 | 413 | 6.3 |
B.SUNITHA | 16 | 4.9 | 13 | 413 | 0.68 |
Y.MRUDULA | 16 | 7.8 | 13 | 450 | 1.53 |
P.SOWRYAKUMA RI | 17 | 5.7 | 25 | 488 | 4.9 |
K.VARAMMA | 17 | 6.1 | 13 | 450 | 40.3 |
IJSER © 2014 http://www.ijser.org
International Journal of Scientific & Engineering Research, Volume 5, Issue 1, January-2014 1633
ISSN 2229-5518
7.2 TABLE SHOWING THE CONTROLS NAME, AGE AND THE CORRESPONDING DATA
CONTROLS:
IJSER
IJSER © 2014 http://www.ijser.org