International Journal of Scientific & Engineering Research Volume 3, Issue 4, April-2012 1
ISSN 2229-5518
Nilesh Parihar, Dr. V. S. Chouhan
Abstract — ECG signals are used to detect the heart rate and heart abnormalities. For extraction of ECG features and detection of QRS complexes it is required to remove baseline wander and minimize the noise interference. In this paper we proposed a technique to remove baseline wander using Kaiser W indowing filter and wavelet transform, among which wavelet is most powerful and effective tool for analyzing transient signal. The algorithm is developed in matlab with standard CSEECG database.
Index Terms— Baseline wander, Differentiator, ECG, Kaiser W indow, MAI, QRS Complex, Wavelets.
—————————— ——————————
ECG provides useful information about function status of the heart beat. This technique is great importance for the analysis & detection of the heart cardiac anomalies. In most of the practical situations the ECG signal is available for observation, contains significant drift from the baseline or zero line of the ECG plot. The ECG signal captured by a computerized ECG machine can be rendered to the algorithm suggested in this paper and a clean drift-free signal would be available for visual inspection by a cardiac specialist as well as for computerized detection of the ECG wave complexes. [7]
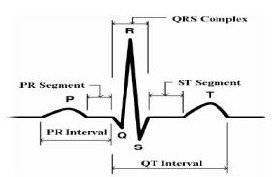
Fig.1. QRS Complex
————————————————
Dr. Vijay S. chouhan is currently an associate professor in M.B.M.
engineering college, India.
A standard scalar ECG is shown in fig.1. It consists of P- wave, PR-interval, PR-segment, QRS complex, ST-segment, ST- interval and T-wave. The P wave represents atrial depolarization, the QRS-complex represents left ventricular depolarization and the T-wave represents the left ventricular depolarization.
A common technique utilized in the QRS detector algorithm is to employ a scheme that consists of a pre- processor and a decision rule. The purpose of the pre- processor is to enhance the QRS, while suppressing the other complexes as well as the noise and the artifacts. The pre-processor consists of a filter, differentiator and moving average integrator and the purpose of the decision rule is to determine whether or not QRS complex is present at a given instant in the signal. This paper covers the ECG signals pre processing and implementation of wavelet dB6 on pre-processor signals. Then result is implemented on prepared algorithm. The algorithm is tested on standard CSE ECG database, having multi-lead ECG signal recordings for 125 cases. Each digital record constitutes a 10 second recording containing 5000 samples taken at a rate of
500 samples/sec.
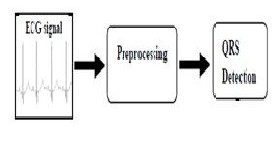
In order to extract information from the ECG signal, the ECG signal is divided into two steps: Pre processing and Feature Extraction as shown in fig. 2.
IJSER © 2012 http://www.ijser.org
International Journal of Scientific & Engineering Research Volume 3, Issue 4, April-2012 2
ISSN 2229-5518
Fig.2. ECG Signal Processing
The Pre processing stage removes noise from the ECG signal by using filtering method and Feature Extraction is performed by using Discrete Wavelet Transform (DWT) dB6.[2]
In pre-processing, ECG signal mainly contains noises of different types, namely frequency interference, baseline drift, electrode contact noise, polarization noise, muscle noise, the internal amplifier noise and motor artifacts. Artifacts are the noise induced to ECG signals that result from movements of electrodes. For removing the baseline wander and noise we design and follow a steps as a band pass filter with the use of Kaiser Windowing technique with cut off frequency 0.5-40 Hz, differentiation, squaring and moving average integrator [3]. After removing baseline wandering, the resulting ECG signal is more stationary.
Feature extraction is to obtain our wavelet analysis; we used the Matlab program, which contains a “wavelet toolbox”. The WT uses a short time interval for evaluating higher frequencies and a long time interval for lower frequencies. Wavelet Transform of a signal f(t) is defined as the sum of over all time of the signal multiplied by scaled, shifted versions of the wavelet function Ψ and is given by,![]()
![]()
![]()
![]()
![]()
![]()
![]()
![]()
![]()
![]()
![]()
![]()
Where * denotes complex conjugation and, Ψa,b is a window function called the mother wavelet, 'a ' is a scale factor and
'b ' is a translation factor. Here is a ![]()
![]() shifted and scaled version of a mother wavelet which is used as bases for wavelet decomposition of the input signal. If the scale parameter is the set of Integral powers of 2, i.e., a = 2 j (j ε z, z is Integer set), then the wavelet is called a dyadic wavelet [12]. The Wavelet Transform at scale 2 j is given by
shifted and scaled version of a mother wavelet which is used as bases for wavelet decomposition of the input signal. If the scale parameter is the set of Integral powers of 2, i.e., a = 2 j (j ε z, z is Integer set), then the wavelet is called a dyadic wavelet [12]. The Wavelet Transform at scale 2 j is given by![]()
![]()
![]()
![]()
![]()
![]()
![]()
![]()
We define local maxima of the Wavelet Transform modulus [13] as: - Let ![]() is the Wavelet Transform of a function f (x);
is the Wavelet Transform of a function f (x);
1. We call a local extreme any point x0 such that d(Wf (x)) /
dx has a zero crossing at x = x0, when x varies.
2. We call a modulus maximum; any point x0 such that
|Wf (x) | < |Wf (x0)| when x belongs to either a right or left neighbourhood of x0, and | Wf (x) | ≤ |Wf (x0 )| when x belongs to the other side of the neighbourhood of x0.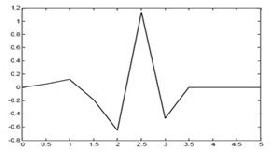
3. We call maxima line, any connected curve in the scale space x along which all points are modulus maxima.
Fig.3. Daubechies db6 wavelet
In Fig. 3 is presented a 3-level signal decomposition of a sample ECG waveform using the db6 wavelet. This first decomposes the ECG signal into several sub bands by applying the Wavelet Transform, and then modifies each wavelet coefficient by applying a threshold function. The high frequency components of the ECG signal decreases as lower details are removed from the original signal. As the lower details are removed, the signal becomes smoother and the noises on the T and P waves disappears since noises are marked by high frequency components picked up along the ways of transmission.
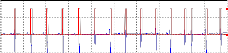
This is the contribution of the discrete wavelet transform where noise filtration is performed implicitly. In Fig.4 is presented the ECG signal before and after noise removal. The detection of the QRS complex is the last step of feature extraction. The R peaks have the largest amplitudes among all the waves, making them the easiest way to detect and good reference points for future detections.
The signal was processed using the wavelets up to 6 levels. However for the detection of the QRS complex, only details up to level 3 were kept and all the rest removed. This procedure removed lower frequencies considering QRS waves have comparatively higher frequency than other waves [6].
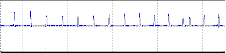
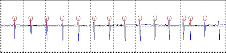
A threshold condition is the maximum value which is sub sequentially applied to set a practical lower limit to help to remove the unrelated noisy peaks. At this point, the data set is ready for peak detection through a very simple search algorithm that produces very accurate results. In Fig.
5 is presented the ECG signal and the extracted peaks corresponding to the QRS complex.
The results obtained with the proposed wavelets using different ECG noise levels. The algorithm based on wavelet for the detection of QRS complex of ECG signal. It can be notice that good results obtained with the db6 wavelet are
IJSER © 2012 http://www.ijser.org
International Journal of Scientific & Engineering Research Volume 3, Issue 4, April-2012 3
ISSN 2229-5518
caused by the resemblance that exists between this wavelet and the actual ECG signal.
Raw CSE ECG dat a 011-v1
![]()
2000
0
500
0
![]()
Raw CSE ECG dat a 001-L1
-2000
2000
0
-2000
0 500 1000 1500 2000 2500 3000 3500 4000 4500 5000
Band Pass Filter output
![]()
0 500 1000 1500 2000 2500 3000 3500 4000 4500 5000
4
-500
500
0
-500
0 500 1000 1500 2000 2500 3000 3500 4000 4500 5000
![]()
Band Pass Filt er output
0 500 1000 1500 2000 2500 3000 3500 4000 4500 5000 moving average int egrator
x 10
![]()
4
moving average integrat or
![]()
5000
2
0
0 500 1000 1500 2000 2500 3000 3500 4000 4500 5000
0
0 500 1000 1500 2000 2500 3000 3500 4000 4500 5000
(a)
(d)
2000
![]()
Raw CSE ECG data 011-v5
1000
Raw CSE ECG data 001-AVL
0
-2000
0 500 1000 1500 2000 2500 3000 3500 4000 4500 5000
![]()
0
-1000
0 500 1000 1500 2000 2500 3000 3500 4000 4500 5000
Band Pass Filter output
2000
0
-2000
Band Pass Filter output
![]()
0 500 1000 1500 2000 2500 3000 3500 4000 4500 5000
1000
0
-1000
![]()
0 500 1000 1500 2000 2500 3000 3500 4000 4500 5000
4
4
x 10
![]()
10
5
moving average integrator
x 10
![]()
2
1
0
moving average integrator
0
0 500 1000 1500 2000 2500 3000 3500 4000 4500 5000
0 500 1000 1500 2000 2500 3000 3500 4000 4500 5000
(e)
2000
![]()
Raw CSE ECG data 011-L1
0
-2000
2000
0
0 500 1000 1500 2000 2500 3000 3500 4000 4500 5000
Band Pass Filter output
1000
0
-1000
1000
Raw CSE ECG data 001-V6
![]()
0 500 1000 1500 2000 2500 3000 3500 4000 4500 5000
Band Pass Filter output
![]()
![]()
-2000
0 500 1000 1500 2000 2500 3000 3500 4000 4500 5000
4
x 10
![]()
10
5
moving average integrator
-1000
10000
![]()
0 500 1000 1500 2000 2500 3000 3500 4000 4500 5000 moving average integrator
0
0 500 1000 1500 2000 2500 3000 3500 4000 4500 5000
(b)
(c)
5000
0
0 500 1000 1500 2000 2500 3000 3500 4000 4500 5000
(f)
IJSER © 2012 http://www.ijser.org
International Journal of Scientific & Engineering Research Volume 3, Issue 4, April-2012 4
ISSN 2229-5518
Fig.4(a)(b)(c)(d)(e)(f) inputs with their corresponding filtered outputs
(a)
5
x 10
1
0
Appro. A3 for QRS detection 011-v1
4
x 10
![]()
1
0
-1
2000
1000
0
-1000
2000
0
0 500 1000 1500 2000 2500 3000 3500 4000 4500 5000
QRS Complex with BPF
0 500 1000 1500 2000 2500 3000 3500 4000 4500 5000
QRS Complex
4
-1
2000
1000
0
-1000
1000
0
-1000
![]()
0 500 100
![]()
0 500 100
0 500 100
-2000 x 105 Appro. A3 for QRS detection 011-v5
![]()
10 500 1000 1500 2000 2500 3000 3500 4000 4500 5000
0
x 10
![]()
2
0
Appro. A3 for QRS detection 001-AVL
(
-1
0 500 1000 1500 2000 2500 3000 3500 4000 4500 5000
QRS Complex with BPF
-2
2000
0 500 1000 1500 2000 2500 3000 3500 4000 4500 5000 d)
![]()
QRS Complex with BPF
2000
1000
0
-1000
2000
0
-2000
![]()
0 500 1000 1500 2000 2500 3000 3500 4000 4500 5000
QRS Complex
![]()
0 500 1000 1500 2000 2500 3000 3500 4000 4500 5000
1000
0
-1000
1000
0
-1000
0 500 1000 1500 2000 2500 3000 3500 4000 4500 5000
QRS Complex
![]()
0 500 1000 1500 2000 2500 3000 3500 4000 4500 5000
4
x 10
![]()
1
0
-1
Appro. A3 for QRS detection 001-L1
(e)
5
x 10
![]()
1
0
-1
Appro. A3 for QRS detection 011-L1
2000
1000
0
1000
0 500 1000 1500 2000 2500 3000 3500 4000 4500 5000
QRS Complex with BPF
![]()
0 500 1000 1500 2000 2500 3000 3500 4000 4500 5000
![]()
0 500 1000 1500 2000 2500 3000 3500 4000 4500 5000
2000
1000
0
-1000
2000
0
-2000
0 500 1000 1500 2000 2500 3000 3500 4000 4500 5000
![]()
QRS Complex with BPF
0 500 1000 1500 2000 2500 3000 3500 4000 4500 5000
![]()
QRS Complex
0 500 1000 1500 2000 2500 3000 3500 4000 4500 5000
(b)
IJSER © 2012 http://www.ijser.org
International Journal of Scientific & Engineering Research Volume 3, Issue 4, April-2012 5
ISSN 2229-5518
(c) (f)
Fig.5 (a)(b)(c)(d)(e)(f) R peaks defined using wavelet
[1] J. PAN AND W. J. TOMPKINS, “A REAL-TIME QRS DETECTION ALGORITHM”, IEEE TRANS. BIOMED. ENG., VOL. 32, PP. 230–236,
1985.
[2] P. SASHI KALA, DR. R.S.D. WAHIDA BANU, “EXTRACTION OF P WAVE AND T WAVE IN ELECTROCARDIOGRAM USING WAVELET TRANSFORM”, (IJCSIT) INTERNATIONAL JOURNAL OF COMPUTER SCIENCE AND INFORMATION TECHNOLOGIES, VOL. 2 (1) , 2011, 489-
493.
[3] S. S. Mehta, and N. S. Lingayat, Member, IAENG, “Support Vector Machine for Cardiac Beat Detection in Single Lead Electrocardiogram”, IAENG International Journal of Applied Mathematics,IJAM.
[4] LG Herrera-Bendezd, J Garcia, BG Denys, “Real-Time Digital
Filters for ECG Signals: Evaluation and New Designs, 0-8186-
2485-X/92, 1992 EEE.
[5] Gordan Cornelia, Reiz Romulus, ECG Signals Processing Using Wavelets, ersity of Oradea: Electronics Department, Faculty of Electrical Engineering and Information Technology, Oradea, Romania.
[6] ZHI-DONG ZHAO, Y. QUAN CHEN, “A New Method for Removal of baseline wonder & Power Line interference in ECG signals”, proceeding in 5th International conference on Machine Learning & Cybernetics, Dalian, 13 - 16 August
2006.
[7] Chui K.: “An Introduction to Wavelets”, Academic Press, Inc.1992.
[8] Saritha, V. Sukanya, and Y. Narasimha Murthy, “ECG Signal Analysis Using Wavelet Transforms”, Bulgarian Journal of Physics, vol. 35, pp. 68-77, 2008.
[9] V.S.Chouhan, “Total removal of baseline drift from ECG signals”, proceedings of the international conference on computing theory
and applications, 2007.
IJSER © 2012 http://www.ijser.org