International Journal of Scientific & Engineering Research Volume 2, Issue 9, September-2011 1
ISSN 2229-5518
Relevance of Branding in Insurance Sector
Prof. Deepali Singh, Rahul Priyadarshi , Snehal . Kannaujia, Puneet Kumar
Abstract-In the changing market scenario, insurance companies have realized the inherent value of brands and consider them ‘valuable a ssets’. Brand equity is the value buildup in a brand due to the positive perception of customers. The value of brand equity is the expected future revenue from the branded product as compare to unbranded product as there is proliferation of brands in the market place; insurance companies try to protect their brand equity by suitable brand differentiation and other means.
Brand is a multidimensional construct involving the blending of functional and emotional values to match consumers, performance and psychological needs. One of the goals of branding is to make brand unique on the dimensions that are both relevant and welcomed by customer s. Branding is a key function of branding that means much more than just giving the product name. Branding at corporate level is essentially about enhancing and managing the relationship between the insurer and its customer as well as the General public.
Keywords: Advertising, Branding, Insurance, Factor analysis, Regression model, self identity, National Heritage
—————————— ——————————
HE Insurance sector in India governed by Insurance Act, 1938, the Life Insurance Corporation Act, 1956 and General Insurance Business (Nationalisation) Act, 1972, Insurance Regulatory and Development Authority (IRDA) Act, 1999 and other related Acts. With such a large population and the untapped market area of this population Insurance happens to be a very big opportunity in India. Today it stands as a business growing at the rate of
15-20 per cent annually. Together with banking services, it adds about 7 per cent to the country’s GDP .In spite of all this growth the statistics of the penetration of the insurance in the country is very poor. Nearly 80% of Indian populations are without Life insurance cover and the Health insurance. This is an indicator that growth potential for the insurance sector is immense in India. It was due to this immense growth that the regulations were introduced in the insurance sector and in continuation ‚Malhotra Committee‛ was constituted by the government in 1993 to examine the various aspects of the industry. The key element of the reform process was Participation of overseas insurance companies with 26% capital.
Prof. Deepali singh ABV-Indian Institute Of information technology
Marketing, General Management, Services ,CRM, BPI, IT&M, E-
BusinesRahul Priyadarshi : Bachelor In Information Technology (B.tech in IT
) currently pursuing MBA Address: ABV-IIITM Gwalior (MP) INDIA ph no.9993957626,Email : asceticrahul15@gmail.com
Snehal kannaujia : Bachelor In Information Technology (B.tech in IT )
currently pursuing MBA Address: ABV-IIITM Gwalior (MP) INDIA
Puneet kumar Bachelor In Information Technology (B.tech in IT ) currently pursuing MBA Address: ABV-IIITM Gwalior (MP) INDIA
Creating a more efficient and competitive financial system suitable for the requirements of the economy was the main idea behind this reform. Since then the insurance industry has gone through many sea changes .The competition LIC started facing from these companies were threatening to the existence of LIC .since the liberalization of the industry the insurance industry has never looked back and today stand as the one of the most competitive and exploring industry in India. The entry of the private players and the increased use of the new distribution are in the limelight today. The use of new distribution techniques and the IT tools has increased the scope of the industry in the longer run.
The reforms were aimed at ‚creating a more efficient and competitive financial system suitable for the requirements of the economy keeping in mind the structural changes currently underway and recognizing that insurance in an important part of the overall financial system where it was necessary to address the need for similar reforms.
With increased commoditization of insurance products, brand building is going to play a vital role. The provisions of the IRDA bill acknowledge a many issues related to insurance permit that will present it from seeping out of the country. The IRDA bill provides for three levels of players – Insurance Company, Insurance brokers and Insurance agent.
In the changing market scenario insurance companies realize the inherent value of brands and consider them as valuable assets. Brand equity refers to the marketing effects or outcomes that accrue to a product with its brand name. Brand equity the value built-up in brand due to positive perception of customers. The value of brand equity is the
IJSER © 2011 http://www.ijser.org
International Journal of Scientific & Engineering Research Volume 2, Issue 9, September-2011 2
ISSN 2229-5518
‘expected future revenue'. From a branded product as
compare to unbranded product as there is a proliferation branding is a key function of branding that means much more than just giving the product name.
Branding at corporate level is essentially about enhancing and managing the relationship between the organization and its various stake holder as well as the General public. Brand is a multidimensional construct involving the blending of functional and emotional values to match consumers, performance and psychological needs (De chernetony and dall'olmo Riley, 1998).One of the aim of branding is to make a brand unique on dimensions that are both relevant and welcomed by consumers. In this Paper we examine some common reasons for investing.
When company shifting their focus from a product/market driven line of attack to consumer, driven marketing activities. This shift headed a direct consequence, companies are now concentrating much more importance on the reaction consumer display regards to the 4P's (production, price, promotion as place) and have further implemented three additional Ps(physical layout process an people(kotler, 1999)).This results, branding has emerged as crucial factor of contempary market strategies and is now considered a key organizational asset(kotler 2000)
1. Get a great and unique logo. Place it everywhere.
2. Write down your brand messaging. What are the key
messages you want to communicate about your brand?
Everyone should be aware of your band ascribe.
3. Integrate your brand: Branding extends to every aspect of your business-how you answer your phones, email signature, everything.
4. Create a voice" for your company that reflects your
brand. This voice should be applied to all written communication and incorporated the visual imagery of all plans online as well as offline.
5. Is your brand Friendly?
6. be conversational, be more formal, you get gist.
7. Create a tagline: write memorable meaningful and
concise statement that captures the essence of your brand.
8. Design templates and create brand standards for your
marketing. Use the color scheme, logo placement, look and feel throughout. You don’t need to be fancy just consistence.
9. be loyal to your brand: customers on return to you or refer you to someone else if you don’t deliver on your brand promise.
10. be consistent. i placed this point last only because it involves all of the above and is the most important tip i can give you. if you can't do this, your efforts at establishing a brand will fail.
In this Paper we are trying to find out:
1. Factors which affects individual decision for insurance.
2. Difference in perception of Insurer in the decision
of keeping insurance on the basis of Age.
3. Difference in perception of Insurer in the decision of
keeping insurance on the basis of Gender.
Achieving brand relevance is a strategic task that, by its very nature, is never completed in the volatile markets of our rapidly changing societies branding is not the sole source if differential advantage, as it can be obtained by the efficient implementation the 4Ps of the marketing mix(Diaz de Rada 1998).
In order to better understanding the relevance of branding in Insurance companies to put an impact on the consumer purchase decision-making process, the author refers to cherantony (1993), who has suggested that four key factors are responsible for directing a potential consumer towards the particular brand .
IJSER © 2011 http://www.ijser.org
International Journal of Scientific & Engineering Research Volume 2, Issue 9, September-2011 3
ISSN 2229-5518
Standing out in the customer’s mind | By striving to differentiate one’s brand from another, Companies hope to become embedded in the user’s culture and mind. This is the most effective way to insure consumer positively perceive the brand and product. This eventually leads to extremes form of competitive advantage. |
Investing in Differential Markets | When one seeks to establish a brand, it is essential to select a market in which it is possible to create differentiation. Otherwise the concept of branding will not be possible. |
Achieving brand relevance is about keeping the brand current in the marketplace, merely keeping the brand in front of its target audience does little to ensure that the brand has freshness about it or a positive significance. As businesses, nonprofits, and governmental entities alike are embracing and spending more money on marketing, their brand message need to become more complex and orchestrated to carry more meaning and to establish effective brand relevance
i. It separate a company from its competitors, in a unique way, this is relevant (and motivating) to its customers, prospects and channels-it gives it value and makes it special.
ii. It enhances the companies’ perceived value, thereby supporting premium pricing, sheltering it from low price competition and contributing the value.
iii. It provides resilience in times of negative press.
iv. It enables company to launch new products more quickly and cost effectively.
v. It makes people remember that brands happen,
with or without the company. It makes company realize the need to be proactive in shaping the identity and strength of a brand image.
Corporate branding has been defined by Van Riel
(2001,p.12) as:
A systematically planned and implemented process of
creating and maintaining a favorable reputation of the company with its constituent elements, by sending signals to stakeholders using the corporate brand.
The propose of this research paper written by authors Sabine Einwiller, Markus Will (2002) was to introduce an increasingly integrated approach to corporate branding regarding the actual and future importance of the topic of corporate branding: all of our interviewees stated that the topic was regarded as highly important for their company and that importance had increased over the past three to four years and the rise in importance is expected to continue in the future. Apart from some particular developments that are specific for the situation of an individual company or industry (e.g. deregulation), the developments underlying the rising importance of corporate branding can be grouped in five categories to be discussed in the following:
i. Growing importance of capital markets. ii. ‚War for the talent‛.
iii. Need to create synergy between the brands.
iv. Co-ordination and identity problems in
multinational corporations.
v. Growing demand for transparency
This study follows the survey research methodology. Based on previous research in related areas, a questionnaire was constructed to measure the attributes of branding of individuals on the basis of Age and Gender. After pilot testing, the questionnaire was administered to a group of people whom age is more than 20 years. Here we are using minimum age as 18 years. The data were analyzed using standard techniques of factor analysis, Regression analysis and other basic techniques. The remainder of this section gives a brief description of the sample, the survey instrument and the survey procedure.
The target groups chosen for this study were the employee of various public sector and private sector companies. They keep fewer amounts of insurance but insure regularly according to their earning and needs. The target groups include various types of insurer such as on the basis of areas whether they belong to rural or urban areas. On the basis of Profession whether they are working in Government or Private Sector and On the basis of annual income.
IJSER © 2011 http://www.ijser.org
International Journal of Scientific & Engineering Research Volume 2, Issue 9, September-2011 4
ISSN 2229-5518
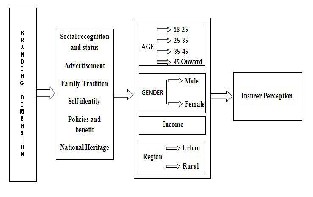
A four page questionnaire consisting of six subscales was developed. In the first subscale, demographic information such as age, gender, marital status, region to which they belong, profession, individual income levels were sought. In the remaining five subscales, questions were adapted from similar instruments reported in the literature by previous researchers to measure the relevance of branding in insurance of individuals on the six variables under consideration, viz. social recognition and status, Advertisement, Family Tradition, Self identity, policies and benefit, National Heritage.
Each question in the remaining four subscales of the questionnaire was scored on a 5 point Likert Scale from (1) highly dissatisfied to (5) highly satisfied. The regression analysis is used to find out factors which have significant impact on insurer. Regression Analysis is discussed in section 6. The theoretical Model is given below.
The instrument was first pilot tested on a small group of individuals. Preliminary analysis of the pilot data showed that those completed the survey form was generally happy with the questions asked. Minor changes were made to the
The data collected from the survey was scored and entered in the computer for analysis by the SPSS (16.0) package. Some preliminary results relating to the sample characteristics, the reliability of the questionnaire are reported in this section.
We made our questionnaire online and also collected data by distributing the forms personally. Of the 700 questionnaire forms distributed, 196 forms were returned; representing a response rate of 71% but out of this 47 forms were not considered for research since some of them are not properly filled . So the final ratios of forms which are considered for research are 65 %., which is considered an acceptable level of response rate in the type of research. Details of respondents such as Age, Gender, profession, and Annual Income are depicted in (Table 1).
Characteristic | Group | No. of respondents | Percentage (%) |
Age | 0-25 | 23 | 46.93 |
Age | 25-35 | 20 | 40.81 |
Age | 35-55 | 6 | 12.26 |
Gender | Male | 33 | 67.34 |
Gender | Female | 16 | 32.66 |
Annual Income (/year)in Lac | 0-3.0 | 24 | 48.97 |
Annual Income (/year)in Lac | 3.0-6.0 | 16 | 32.65 |
Annual Income (/year)in Lac | 6.0- onwards | 9 | 18.38 |
To assess the reliability of the instruments, the Cronbach (1981) alpha coefficients for the total questionnaire and the five subscales were calculated and reported in (Table 2).
subscale statements to improve clarity of the presentation. Questionnaires were hand delivered to many insurers while personal interviews have also been taken. To ensure a
Cronbach's Alpha
.786
It is noted that all items were found to have a mean
degree of objectivity in the survey data, selected insurer
were personally interviewed by us to verify the accuracy of the self reported data. As far as our concern, the self reported data were found to be reliable.

value ranging from 3.57 in the 5 point likert scale, where a value of 2.5 is regarded as neutral point. This indicates that ratings from the respondents tend to lie on the positive side of the rating scale. Furthermore, the standard deviations were found to range from .67 indicating a relatively high
IJSER © 2011 http://www.ijser.org
International Journal of Scientific & Engineering Research Volume 2, Issue 9, September-2011 5
ISSN 2229-5518
degree of consensus among the respondents in their
perception of the rating of variables in the questions.
The Cronbach alpha is the most widely used index for
determining internal consistency (Kerlinger 1986).It has been generally accepted that in the early stages of the research on hypothesized measure of construct, reliabilities of 0.50 or higher are needed, while for widely used scales, the reliabilities should not be below0.6 (Nunnally, 1978).In the current survey, all subscale alpha coefficients exceed 0.5 with an overall alpha value 4664 for the entire questionnaire. The high alpha value in all six subscales confirms the homogeneity of the items comprising them, and indicates acceptable level of reliability.
To understand the relevance of branding in insurance sector of Individuals 18 statements were identified. Each statement describes one aspect of perception. The opinions of insurers were collected in Likert five point scales. Studying all 18 statements would have been tedious and, in fact not necessary also. So factor analysis was used to reduce variables into smaller number of manageable variables by exploring common dimensions available among the variables. The variable which had common response and high correlation were grouped under a common factor. Variables which did not have any significant effect were suppressed. The reduced factors should be distinct from each other.
First the suitability of data for the purpose of factor analysis was tested using two analyses, namely KMO test and Bartlett’s test of Sphericity. The Kaiser- Maiyer-Olkin Measure of sampling adequacy is a statistic which indicates the proportion of variance in the variables which might be caused by new factors. High values generally indicate that a factor analysis may be useful with the data. If the value is less than 0.50, the results of the factor analysis probably will not be very useful.
(Table 3) shows the KMO value is 0.507 which signifies that the factor analysis is useful with the data. The chi Square value for Bartlett’s test of Sphericity is and the significant value is 0.0000 which is significant at more than 99 percent level of confidence. This means data are very suitable for factor analysis.![]()
The next step in the process is to decide about the number of factors to be derived. The rule of thumb is applied to choose the number of factors for which ‘Eigen values’ with greater than one is taken by using Principal component analysis method. The component matrix so formed is further rotated orthogonally using varimax rotation algorithm
By performing factor analysis 18 variables are first reduced to 14 variables and then further reduced into six component factors (Table 4). Each component factor includes some statements which are otherwise called variables. Each variable represents perception of investors about one particular aspect of investment variable like investment institutions and statements under each factor explain the feature of such perceptual factor. The six perceptual factors which have Eigen value more than unity alone is taken for consideration. There are separate tables for factor loading of each factor. The six perceptual factors which have Eigen values more than unity alone are taken for consideration. The six perceptual factors represent around 65 percent of total variance which is very significant and the remaining variance is explained by other factors. The first factor security accounts for around 18 percent of total variance and other factors accounts for remaining 47 percent variance.
Kaiser-Meyer-Olkin Measure
of Sampling Adequacy.
0.507
IJSER © 2011 http://www.ijser.org
International Journal of Scientific & Engineering Research Volume 2, Issue 9, September-2011 6
ISSN 2229-5518
The list of seven component factor along with their labels
and variables (statements along with loading) included under these factors are listed below.
1) Social recognition and status:
Table 5 shows that this factor contains variables related to the purpose of Insurer. Basically this factor is move around social recognition and status. As all the variables included under this component factor are related to needs of social recognition and status which may be known, this factor can be called as social recognition and status. They also considered social recognition and status as the most important criterion before making any insurance.
3) Family Tradition:
Table 7 shows that this factor contains variables related to the family tradition of insurer about various ethics and values of the company, and on the basis of that knowledge they continue the insurance. The insurer feels that family tradition is the most important factor before making any decision for insurance.
2) Advertisement:
Table 6 shows that this factor contains variables related to advertisement through various means through which persons perceives a perception before keeping any insurance. The insurer who is intelligent made any decision through message conveyed by advertisement.
4) Self identity:
Table 8 shows that this factor contains variables related to the self identity of an individual. The insurer feels that before making any decision about insurance, it is good to take suggestions from other insurer of this field and always go for that brand which keeps them different from other insurer of other brand.![]()
Variables Factor
Loading
IJSER © 2011 http://www.ijser.org
International Journal of Scientific & Engineering Research Volume 2, Issue 9, September-2011 7
ISSN 2229-5518
that particular brand supports my culture and
values related to the nation.
5) Policies and benefit:
Table 9 shows that this factor contains variables related to policies and benefits. Respondents were asked to indicate the significant earnings and schemes they devoted for the insurance. The result indicates that insurer do devote much time in policies and benefits. Which imply that peoples are already aware of various policies and investment?
Variables | Factor Loading |
I prefer to choose brands on the availability of desire policies | .799 |
I prefer to choose policies of ISO certified insurance companies | .754 |
I prefer to choose brands which give me surplus benefits | .804 |
I prefer to choose brands which give me emergency facilities. | .728 |
I prefer to choose brands which keeps me expected return on maturity or not | .675 |
6) National Heritage:
Table 10 shows that this factor contains variables related to national heritage. National heritage is also a crucial factor which from person to person before making any decision for insurance. For e.g. someone sees that that particular brand is associated with my nation or not, someone sees
The purpose of this research was to identify the most important factors which influence investment pattern of the persons in India. Based on literature review it was also hypothesized that there would be differences in the investing pattern of Individuals and also basis of gender. The study also attempted to identify what are the most important factors which they would prefer to consider before making any investment.
Factor I, was labeled as ‚Social recognition and status‛. While comparing the means score and Standard Deviation value of different age group, it was found that the mean score of age group (55 onward) is the highest followed by age group (35-55) Years and lowest in age group (22 - 28
Years).
Factor 2, was labeled as ‚Advertisement‛. While comparing the means score and Standard Deviation value of different age group, it was found that the mean score of age group (35-55 Years) is the highest followed by age group (0 – 25) Years and lowest in age group (28-40 Years).
Factor 3, was labeled as ‚Family Tradition‛. While
comparing the means score and Standard Deviation value
IJSER © 2011 http://www.ijser.org
International Journal of Scientific & Engineering Research Volume 2, Issue 9, September-2011 8
ISSN 2229-5518
of different age group, it was found that the mean score of
age group (35-55 Years) is the highest followed by age group (25 – 35) Years and lowest in age group (25 - 35
µi = Intercept
i= 1 Male
i=2 Female
Years).
Factor 4, was labeled as ‚Self identity‛. While comparing the means score and Standard Deviation value of different age group, it was found that the mean score of age group (35-55 Years) is the highest followed by age group (25 - 35
Years and lowest in age group (0 - 25 Years) .
Factor 5, was labeled as ‚Policies and benefit‛. While
comparing the means score and Standard Deviation value of different age group, it was found that the mean score of age group (35-55 Years) is the highest followed by age group (25 – 35) Years and lowest in age group (0-25 Years) .
Factor 6, was labeled as ‚National Heritage‛. While comparing the means score and Standard Deviation value of different age group, it was found that the mean score of age group (35 – 55 Years) is the highest followed by age group (0-25) Years and lowest in age group (25-35 Years).
From the above analysis it was observed that the factors Social recognition and status, Advertisement, Family Tradition, policies and benefit, National Heritage influence the branding pattern. So, to get better picture of factors influencing the branding pattern it is better to analyze the whole result based on gender wise. It has been proposed hypotheses that there are no significant differences of factors on the basis of gender. We have applied Levine’s F- test Equal variance
The result of regression analysis shows that their respective model no 2 is accepted for both males and females. A brief summary of the two models is given in Table 14. From the Table it is seen that R square value for model 2 is highest, so model 2 is accepted for males and for female’s respectively. Detail is given in Table 14.
The used Model is
θi = Coefficient of Factors
Model 2 for males comprises of 2 factors out of 6 factors, social recognition (β =.203,t=6.521 and p < 0.05) and Awareness (β =.141,t=4.915 and p < 0.05). that the dominant factor for males is Awareness which is followed by Opinion
Male | Female | |||
Models | 1 | 2 | 1 | 2 |
R2 | .138 | .210 | .066 | .097 |
F | 42.973 | 35.422 | 12.998 | 9.793 |
D.W. | 2.127 | 2.801 |
The purpose of this section is to examine that out of six perceptual factors which have significant impact on different age group and on the basis of gender. Some of the smaller frequencies in the original categories have been merged in the analysis. The results of regression analysis are explained below. We have applied step wise regression model for both age and gender wise.
Three Models for Age group (22- 28) years are generated. Four Models for age group (28-40) Years are generated and Five Models for age group (40-60) Years are generated. Two models for male and two models for females are derived. On the basis of high R square value we accepted model 3 for (22-28 years) age group, model 4 for (28 -40 years) age group and model 5 for (40-60 age group) and their respective second model for males and females. The detailed summary is given below.
Zi = µi + θi * Xi
IJSER © 2011 http://www.ijser.org
International Journal of Scientific & Engineering Research Volume 2, Issue 9, September-2011 9
ISSN 2229-5518
The result of regression analysis shows that model 3 for (0-
25 years), model 4 for (25-35 years) and model 5 for (35-55 years), model 6 for(55-onward) age group are accepted. A brief summary for the entire five models is given in Table
13.From the Table it is seen that R square value for model 3 is highest for 22-28 years age group, so model 3 is accepted, model 4 is accepted for 25-35 age group since its R square value is highest and model 5 is accepted for 35-55 age group since its R square value is highest among others models derived.
The result of regression analysis shows that their respective model no 2 is accepted for both males and females. A brief summary of the two models is given in Table 14. From the Table it is seen that R square value for model 2 is highest, so model 2 is accepted for males and for female’s respectively.
a) Further may include wider range of brands from different sector other that insurance
b) Customer prospective from different culture can be analyzed.
c) These factor may or may not be sufficient for further research but provide the base for further research in upcoming year.
a) Sample of 49 people may not present very accurate result
b) Evaluation of the brand by people may be biased
It can be concluded that the modern person is a mature and adequately groomed insurer. The value of brand equity is the ‘expected future revenue'. From a branded product as
compare to unbranded product as there is a proliferation branding is a key function of branding that means much more than just giving the product name. Aim of branding is to make a brand unique on dimensions that are both relevant and welcomed by consumers. In this Project we try to find out the relevance of branding in Insurance Sector by examine several factors via Social recognition and status, Advertisement, Family Tradition, Self identity, policies and benefit, National Heritage.
Peoples are well known about their right as well and they are thinking straight to their benefits what insurance company providing them.
References
1990;Winn ans Angell, 2000,
Concern by organixation regarding their environmental management.
‘Green Fifty’: The top Environmentally
Responsible Outsourcing Vendors of 2007, July‛
D.P. Agrawal(2006), Framework of ethical brand positioning.
definition of brand.
business, Canadian Manager,
Vol.26 Issu 1, pp.25-27
IJSER © 2011 http://www.ijser.org
International Journal of Scientific & Engineering Research Volume 2, Issue 9, September-2011 10
ISSN 2229-5518
organization", Learning Organization, The, Vol. 14
Iss: 6, pp.510 – 523
Branding.
‚Integrating environmental criteria into the supplier selection process‛, Journal of Material and Processing technology.
1(1),2010,15-26
THANGAVEL M.Com, M.B.A., Ph.D., OVERVIEW
OF INDIAN INSURANCE SECTOR, Volume 22,
2008.
‘green’ strategy‛, Journal of Business Strategy, Vol.
29 No.2
IJSER © 2011 http://www.ijser.org