International Journal Of Scientific & Engineering Research Volume 2, Issue 8, August-2011 1
ISSN 2229-5518
Quasi-static Energy Absorption of Wood
B.G.Vijayasimha Reddy, K.V.Sharma, T.Yella Reddy
Abstract- This study presents the experimental results for a series of tests on the uniaxial quasi-static crushing of cubical specimens of
50mm side for two species of wood such as Jack wood and Indian Fig. Compression tests were conducted on universal testing machine of
400kN capacity and at a constant deformation rate of 8mm/min. The woods were separately tested in the two principal directions i.e., grains oriented along the direction of loading (along the grain) and the other transverse to it (across the grain). An account of the macro- deformation modes observed in these tests was discussed, with a focus more on the evaluation of energy absorbing characteristics. A comparison is made with the theoretical estimates. The experimental results shows that the energy absorption by the Indian Fi g wood for
00 specimens varied about 1.32 times that for 900 specimens and for the Jack wood it is 1.4 times.
Keywords - Jack wood, Indian Fig, quasi-static, deformation mechanism, energy absorption, densification strain, crush strength.
—————————— ——————————
1. INTRODUCTION:
HERE have been numerous studies of cellular structures and cellular materials such as metal ring systems, honeycombs, polymeric foams and wood,
some of which have been reviewed in the context of dynamic compression by Reid. S et al.[1]. Many aspects of the behavior of cellular solids are summarized well in the book by Gibson and Ashby [2]. An important aspect of modern technology is the search for stiffer, stronger and lighter materials. Cellular materials are often utilized in shock attenuation and impact damage protection applications. In these applications, energy is transmitted to the system mostly by the impact of a foreign object and dissipated through the compressive inelastic deformation of cells within the material. Flow stress of the cellular material determines the load transmitted to the system during dissipation process and the deceleration of the impactor as well. Thus, it is desired to keep at an optimum level, which is not too high to damage the structure and its contents and not too low to diminish the amount of energy dissipated. The ultimate deformation determines the amount of energy that can be dissipated safely. Jack and Indian Fig woods are naturally occurring -- porous bio-composites, offers salient mechanical and physical properties. As their cellular microstructure allows the application of large deformations, fine composite nano architecture of wood material increases its specific strength and stiffness, giving rise to a high specific energy dissipation capacity as stated by Varul and Ravichandran [3, 4]. One reason for this study is the current and potential use of wood as impact energy absorbers and its use as core material in lightweight sandwich structures. [5]

Author: * Research Scholar, Department of Mechanical Engineering, University Viswesvaraiah College of Engineering, Bangalore, Karnataka, India.
PH: +91-9972399797, E-mail: bgvsreddy@gmail.com.
Co- authors: **Professor, Department of Mechanical Engineering,
University Viswesvaraiah College of Engineering, Bangalore, Karnataka,
India.
***Emeritus Professor, Department of Mechanical Engineering, Vemana
Institute of Technology, Bangalore, Karnataka, India.
2. EXPERIMENTAL DETAILS
2.1 Specimen preparation:
Cubical specimens of 501.0 mm side were cut from well seasoned parent block of species of Indian Fig and jack wood. In the tests reported, the specimens loaded across the grain were cut with the grain perpendicular to their axis (i.e. the direction of loading) and are referred as900 specimens, the axially crushed as 00 specimens.
2.2 Moisture content tests
Moisture content tests were conducted for the Indian Fig 6-
10% and for jack wood 5-9%, which is the typical value for well-seasoned dry woods. The initial density and relative density of the specimens were then calculated.
2.3 Uniaxial compression test:
Experimental results are provided for a series of tests on specimens of species of Indian Fig and jack wood which were subjected to uni-axial quasi-static compression loading conditions. The tests were conducted on a universal testing machine of 400kN at a deformation rate of 8mm/min. The behavior of these woods under such conditions is reported and focused more on the evaluation of energy absorbing characteristics.
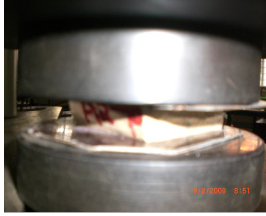
3. DEFORMATION MECHANISMS
The energy absorbing characteristics of the woods crushed under quasi static loading depends on the deformation mechanism of cellular structure and its mode of deformation. Typical load-deformation curves for the selected woods tested along and across the grain are shown in the figure 1 and 2. Curve is characterized by three distinct zones.
Elastic Zone (a-b): When the wood is compressed under uniaxial compression, initially it tends to bulge (barreling) due to the elastic fiber buckling (Euler type) of cell walls. In case of Indian Fig, the bulge is more prominent and continued up to for about 2% of compression. A sharp reduction of load separates the elastic and plastic regions. During this, a number of minor crush zones were initiated across the faces of the specimen due to the plastic buckling of cell walls and collapse
IJSER © 2011 http://www.i jser.org
International Journal Of Scientific & Engineering Research Volume 2, Issue 8, August-2011 2
ISSN 2229-5518
of the end caps. During further compression, the cellular structure of wood collapses as the cell walls of the wood break, crumble, fracture and fall into the cavities of the cells ahead of the compression resulting in the minor surface cracks. This failure starts in a very narrow zone perpendicular to the loading axis and resembles a shear bond or a kink bond. It is evident through the experiments that shear bonds are always found to occur in the left transverse plane and are independent of the density of the wood. The fibrous and anisotropic structure of large fiber misalignments or imperfections in a micro scale may be the favorable sites of formation of the shear or kink bands. At the sites of formation of shear bands the fiber miss-alignment would be more critical and has been recognized as a major failure mechanism of wood crushed along its grain [4]. There is a sudden drop in the load after the initiation of plastic crushing, this occurs at an average load of about 92kN for the Jack wood and 28.4kN for Indian Fig wood followed by a load plateau.
Plateau Zone (b-c): The vertical fractures and crushable shear bands or kink bands propagate progressively due to the plastic folding and crushing of end caps of the layers of the cellular structure as mentioned above and deformation continues at a plateau load. The plateau region is more uniform for the Jack wood. For Indian Fig the plateau region has a wider wavy form.
Densification Zone: For all specimens of woods tested in the present study, the progressive plastic deformation reaches a stage where the crushing of the individual cells becomes exhausted and further deformation is the result of solid phase compaction of fragmented and ruptured cell walls against each other. This is evident by a rapid and steep increase in the load. The material offers stiffer response, thus it densifies or the strain locks up and this phase is called as densification phase and the strain at which this begins is called densification strain. This is one of the important material properties because, together with the plateau stress, this directly determines the energy absorption capacity of material.
400
350
300
250
200
150
100
50
0
J-0
d
b c a
400
350
300
250
200
150
100
50
0
J-90
0 100 200 300 400
Dis place m e nt(m m ) x10-1
0 10 20 30 40
Displacement(mm)
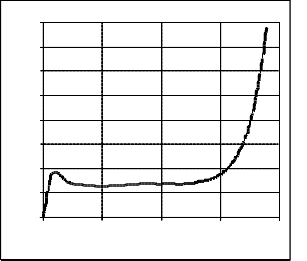
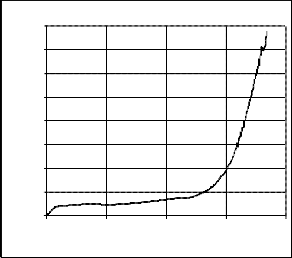
Fig 1: Load-Displacement for Jack wood at 00 Fig 2: Load-Displacement for Jack wood at 900
a b
IJSER © 2011 http://www.i jser.org
International Journal Of Scientific & Engineering Research Volume 2, Issue 8, August-2011 3
ISSN 2229-5518
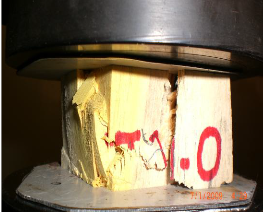
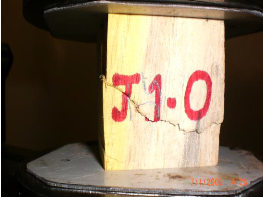
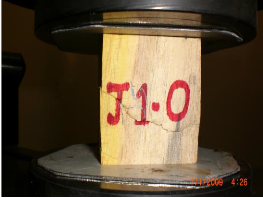
c d
Fig a-d: Photographic views of Progressive stages of plastic deformation of wood specimen along the grains
4. RESULTS AND DISCUSSION:
Typical load-displacement response obtained from experiments for the specimens tested along the grain and across the grain orientation to the loading direction was
shown in the figure1 through 6 and the results of this study are given in the table1.

TABLE.1: ENERGY ABSORPTION CHARACTERISTICS
Specimen | Density kgm-3 | Relative density kgm-3 | % Moisture content | Initial crushing load kN | Initial crushing stress N/mm2 | Locking Strain | Energy absorbed(J) |
Specimen | Density kgm-3 | Relative density kgm-3 | % Moisture content | Initial crushing load kN | Experimental | Theoretical | Exp | Theo | Energy absorbed(J) |
Specimen | Density kgm-3 | Relative density kgm-3 | % Moisture content | 0 | 90 | 0 | 90 | 0 | 90 | 0 | 0 | 0 | 90 |
J1 | 520 | 0.34 | 8.9 | 90 | 24 | 45 | 10 | 40.46 | 8.09 | 0.72 | 0.72 | 3453.95 | 2469.36 |
J2 | 536 | 0.35 | 7.8 | 91 | 25 | 41 | 9.6 | 41.65 | 8.57 | 0.71 | 0.72 | 3454.95 | 2470.36 |
J3 | 510.4 | 0.34 | 8.5 | 92 | 26 | 41 | 10.1 | 40.46 | 8.09 | 0.70 | 0.72 | 3455.95 | 2471.36 |
J4 | 480 | 0.32 | 5.6 | 93 | 27 | 42.5 | 9.9 | 38.08 | 7.16 | 0.71 | 0.74 | 3456.95 | 2472.36 |
J5 | 521.6 | 0.35 | 6.9 | 94 | 28 | 42.00 | 10.6 | 41.65 | 8.57 | 0.70 | 0.72 | 3457.95 | 2473.36 |
Avg | 513.6 | 0.34 | 7.54 | 92 | 26 | 42.5 | 10 | 40.46 | 8.1 | 0.70 | 0.72 | 3455.95 | 2471.36 |
F1 | 432.1 | 0.28 | 7.8 | 25 | 2.5 | 30.16 | 4.2 | 33.32 | 5.48 | 0.75 | 0.74 | 1878.43 | 1467.12 |
F2 | 440.8 | 0.29 | 6.9 | 20 | 3 | 32.5 | 5.9 | 34,51 | 5.88 | 0.74 | 0.73 | 1554.7 | 1693.6 |
F3 | 409.6 | 0.27 | 8.2 | 35 | 2.5 | 30.06 | 4.9 | 32.13 | 5.1 | 0.74 | 0.75 | 2092.05 | 1112.25 |
F4 | 440 | 0.29 | 4.3 | 30 | 3.5 | 31.92 | 5.2 | 34.51 | 5.88 | 0.68 | 0.73 | 1557.79 | 1324.5 |
F5 | 434 | 0.28 | 7.6 | 32 | 5 | 32.56 | 4.7 | 33.32 | 5.48 | 0.73 | 0.74 | 3299.02 | 2223.68 |
Avg | 431.3 | 0.28 | 6.96 | 28.4 | 3.3 | 31.44 | 4.98 | 33.32 | 5.56 | 0.73 | 0.74 | 2076.4 | 1564.23 |
IJSER © 2011 http://www.i jser.org
International Journal Of Scientific & Engineering Research Volume 2, Issue 8, August-2011 4
ISSN 2229-5518
400
350
300
250
200
150
100
50
0
F-0
0 10 20 30 40 50
Displacement(mm)
400
350
300
250
200
150
100
50
0
F-90
0 10 20 30 40 50
Displacement(mm)
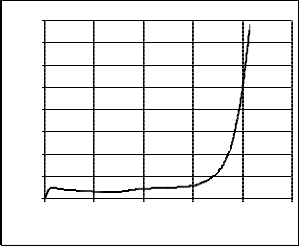
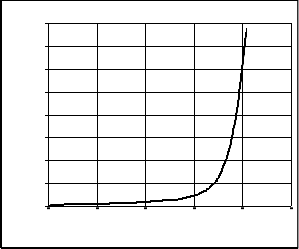
Fig 3: Load-Displacement for Indian Fig at 00 Fig 4: Load-Displacement for Indian Fig at 900
400
350
300
250
200
150
100
50
0
J-90 J-0
0 10 20 30 40
Displacement(mm)
400
350
300
250
200
150
100
50
0
F-0 F-90
0 10 20 30 40 50
Displacement(mm)
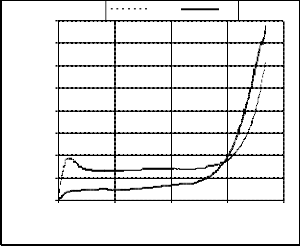
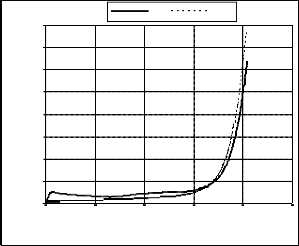
Fig 5: Load-Displacement for Jack wood for 00 & 900 Fig 6:Load-Displacement for Indian Fig for 00&900
4.1 Initial crush strength(c):
The load-displacement curve for all the tested specimens is almost linear up to the maximum stress (hereafter referred to as initial crush strength c). Gibson and Ashby [2 ] have formulated a simple relationship between the initial crush strength and the relative density of the wood, i.e. The average density of the wood sample,o, divided by the density of the cell wall material, s which has a value of
1500kgm-3.These are expressed as follows.
c0=0.34(o/s)ysMN-m-2 …… (1)
c90=0.2(o/s)2ys MN-m-2 …… (2)
c0, & c90, Crushing strength along the grain (axial) and across the grain (transverse). ys = Axial yield strength of the cell wall material, 350MN-m-2 [from Cave,1969]. The compressive strength of wood along the grain varies linearly with the relative density while across the grain varies with density squared. The equations (1) and (2) correlate well with the experimental data of the present study with a discrepancy of about 10% compared to values
calculated by the above relations. This may be due to the anisotropy of wood, varied climatic conditions and fertility of the soil in which a tree grow, and defects in the cellular structure of the wood for various reasons. Experimental results show that increase in the density lead to higher initial crush strength.
4.2 Densification strain (d):
Maiti et al.(1984) have a theoretical prediction for densification strain, by assuming that it is reached when all the voids within cellular material are eliminated and the relative density of the wood attains a value of 1,i.e.,d=1-
(/s). However this approach overestimates the present quasi static densification strain data by as much as
15percent. Since this was also the case for their
experimental data and suggested that =2 for various
species of wood, it still does not correlate with the present experimental data. The best fit to the present study, =
0.5 for Indian Fig and 0.8 for jack wood were chosen.
Present study was emphasized on more accurate
prediction of densification strain from the stress- strain
IJSER © 2011 http://www.i jser.org
International Journal Of Scientific & Engineering Research Volume 2, Issue 8, August-2011 5
ISSN 2229-5518
curves. The densification strain was read from the intersection of plateau stress and a tangent drawn to the steeply rising densification curve which is parallel to the elastic (initial loading) curve shown in figure.1.
4.3 Energy absorption:
The energy absorption capacity of the cellular material depend on the direction of loading (across and along the grain) conditions, plateau stress and densification strain. The energy absorbed by the Indian Fig wood for 00 specimens varied about 1.32 times that for 900 specimens. This difference could be due to very early plastic collapse of cell wall at the initial loading and weak in transverse strengths.
5. CONCLUSIONS:
The study of behavior of wood specimens under quasi- static loading conditions reveals the following.
The macro-mechanisms of the collapse of cellular structure of wood depend on density and the direction of loading (along the grain and across the grain).
The energy absorbing characteristics of wood is a function
of its relative density and deformation mechanisms under the loading conditions.
Prediction of the densification strain by Gibson and Ashby
[2] and originally due to Maiti et al [3] have shown less accurate. And overestimates the present quasi-static densification strain data by as much as 15%. Since this was also the case for their experimental data and suggested that
=2 for various species of wood, it still does not correlate
with the present experimental data. The best fit to the present study, = 0.5 for Indian Fig and 0.8 for jack wood were chosen.
The energy absorbed by the Indian Fig wood for 00 specimens varied about 1.32 times that for 900 specimens.
ACKNOWLEDGEMENT
The authors are highly indebted to Prof. Seenappa, Government Engineering College, Bangalore, for his support and encouragement during this investigation.
REFERENCES:
1. [1]. S.R.Reid, T.Y.Reddy and C.Peng, “Dynamic Compression of cellular structures and materials”. In: Jones N, Wierzbicki T, editors. Structural crashworthiness and failure London: Elsevier appl. Science, 1993, 295 -
340.
2. [2]. Lorna J. Gibson and Michael F. Ashby “Cellular solids-structure and
properties” 2nd edn.1997. Cambridge university press, U.K.
6. [5]. S.R.Reid, and C.Peng, (1997) “Dynamic uniaxial crushing of wood”
Int. J. Impact engineering.Vol.19, 531-570.
7. [6]. Maiti.S.K., Lorna J. Gibson and Michael F. Ashby. Deformation and
Energy absorption diagrams for cellular solids, Acta Metall., 1984;32(11),
1963-1975.
3.
4. [3]. M. Vural and G. Ravichandran (2003) “Microstructural aspects and modeling of failure in naturally occurring porous composites.” Int. J.Mechanics of materials.Vol.35, 523-556.
5. [4]. M. Vural and G. Ravichandran (2003) “Dynamic response and
energy dissipation characteristics of balsa wood: experiment and
analysis.” Int. J. Solids and structures Vol.40, 2147-2170.
IJSER © 2011 http://www.i jser.org