International Journal of Scientific & Engineering Research, Volume 4, Issue 9, September-2013 1939
ISSN 2229-5518
Qualitative - Quantitative Analysis of Tire Industry of Iran by Using Fuzzy DEMATEL and Systemic Method Until 1404
Amir Mehdiabadi, Shahram Amirabdollahian, Abolfazl Rohani, Noshin Mazidabadi Farahani
Abstract— The aim of present research is to consider tire industry in 20 years planning. On this basis, the research method in two arenas of quality and quantity has been analyzed. In the quantity arena, attention has been paid on studying documentary of this industry and overlook at 20 years planning of the country fill 1404. In quantity arena by analyzing the result of studying documentary and by using Delphi technic and experts ideas and prioritizing variables with ANP technic, first, research conceptual model in form of dynamical modeling drawn and some questions as coupled comparing prepared in order to test the model distributed among 10 experts of tire industry of country and the results were analyzed by using Fuzzy DEMATEL .The results show that the most important effective factors on demanding tires in view of tire experts are tire consumption rate, real tire inventory of country, importing tire and vehicles and these factors are part of effective parameters on demanding tires.
Index Terms— Tire, Strategy, CLD (System Dynamics), Fuzzy DEMATEL, Vehicle.
1 INTRODUCTION
—————————— ——————————
Tire is a strategic commodity due to its place in transport sys- tem and being expenditure stuff (Tavana et al, 2009, page 44). Tire industry plays an since it is related to other industries such as vehicle and great value of production and its mone- tary circuit, it is considered important and vital industry. By appearing new and competitive technologies in the field of automotive industry, tire industry has considerably pro- gressed accordingly (Asghari Zadeh et al, 2006). In Iran with respect to the limitation in transporting by air and lack of parts for shipping and inadequate railroads throughout the country, so far these problems, 80 percent of transportation withers passengers or goods done by vehicle which are moving on tires consequently, special consideration must be paid on this part of industry. Undeniable relevance of tire industry to au- tomotive industry caused the industry move towards progress and development in the world. Tire enjoys a specific and complementing role as one of the thousands components which are used in automotive industry and its linking value. Unstable procedure of producing different kinds of cars in the world has always been faced with problem and pared on un- foreseen pathway. However, standing procedure of tire pro- duction in the world show that it has had similar procedure to automotive production had, and hasn’t been left behind from the up to date technologies and customer select.
————————————————
• Corresponding author, Young Researchers and Elite Club, Semnan Branch, Islamic Azad University, Semnan, Iran. Amir.mehdiabadi@gmail.com
• Young Researchers and Elite Club, Semnan Branch, Islamic Azad Univer- sity, Semnan, Iran. amirabdollahian_shahram@yahoo.com
• Department of industrial engineering Payame Noor University, PO Box:
19395-3697, Tehran, Iran. Abolfazl_rohani@yahoo.com
• MA of Business Administration (International Business Trends), Islamic
Azad University, Science and Research Branch of Tehran. noshinmazida-
badifarahani@yahoo.com
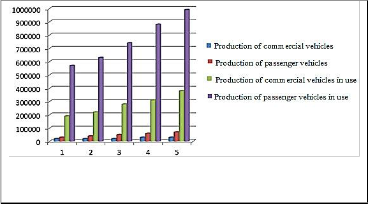
Regarding to the growth of automobile production in Iran that is in accordance with the gross national production up to the year 1404 will meet the increase of three times more than what is it now. And this shows the importance of the matter to be investigated as one of the base in transportation system of the country. Following figure1 shows the evolution procedure of heavy and light vehicles up to years 2020:
Fig1. Vehicle production procedure in the world (Tavana et al, 2009, page
26)
In large scale, the value of tire started from planting, maintaining and harvesting of natural Rubber and along with the production of other raw material using in the production, which is initiated from refinery leads to producing artificial rubber, processing oil, thread and grime accompanied by producing wire wheels and steel cord, the set of needed raw material completed and then after passing from the link of transporting the material of the tire factory, the circulation continues and again with the help of transportation, tires pass from the link of wholesale and retail and eventually consumption and recycle (report from ministry of industry and mining, 2006). It’s important to note that regarding to value-added of tire components such as grime; wire wheels
IJSER © 2013 http://www.ijser.org
International Journal of Scientific & Engineering Research, Volume 4, Issue 9, September-2013 1940
ISSN 2229-5518
and artificial Rubber and also the value of imported tires all show the importance of the industry. The table below shows the procedure of producing different kinds of natural and artificial tires till 2011:
TABLE 1

THE PRODUCTION OF NATURAL RUBBER AND SYNTHETIC
Year | Tire production (in thousand tons) |
| Natural tire | Synthetic rubber | Total |
2000 | 672 | 10870 | 17632 |
2001 | 7332 | 10483 | 17815 |
2002 | 7326 | 10877 | 18203 |
2003 | 8006 | 11338 | 19344 |
2004 | 8744 | 11977 | 20271 |
2005 | 8907 | 12073 | 20980 |
2006 | 9827 | 12612 | 22439 |
2007 | 9890 | 13347 | 23237 |
2008 | 10128 | 12712 | 22839 |
2009 | 9690 | 12385 | 22075 |
2010 | 10399 | 14082 | 24481 |
2011 | 10974 | 15115 | 26089 |
Table 1 shows the production of tire in different usage that always had an increasing growth between 2000 and 2011. It’s important to note that technology is a factor to approach higher and better quality productions. Tire and automotive making technology and their interaction is clear to everyone (ministry of industry and mining, 2006). From one point of view, it’s automotive industry that determines and meets technologies need in tire industry. For this reason, the demand for tires is based on the number of vehicles produced. To meet the demand of car market in Iran in next two decades is affected by demand and supply, and more to say that the demand subjects two other factors:
(1) New needs for vehicles based on the distance between the expected number and the existing number in the country and (2) Need for vehicles based on the number worn-out and ex- pelled from the system.
And supply subjects:
(1) Production capacity of the country and developing plan-
ning;
(2) Expanding export markets and
(3) Importing vehicles (Saipa, 2006).
Following table shows the production of tire and global needs
for tires up to 2012.
PRODUCTION AND GLOBAL TIRE DEMAND BETW EEN 2012-1997

Year

1997
1998
1999
2000
2001
2002
2003
2004
2005
2006
2007
2008
2009
2010
2011
2012

Tire industry enjoys the capacity in Iran that works competitively in its link value, and it’s advisable in some areas competitively partner up and on this base leave some parts to other companies horizontally. Related areas in this field including tire industry engineering and research companies formed for this purpose during last years. Besides this area, tire industry can arrange a widespread service for buyers throughout the country to compete with foreign competitors to reduce individual expenses for such services. To attend in neighboring countries a wide advertisement through the tire industry is needed that is defined in this in this area. The industry has already done well for raw materials. Therefore, regarding to the not so good situation of tire industry in Iran from one hand and increasing worldwide demand of tires on the other hand, efforts have been made to identify variables in the industry, relations and dynamisms. In this research we will present a comprehensive picture with a systematically look to this matter.
2 ECONOMIC ANALYSIS
In general, demand is the amount of goods that a consumer buys in a fixed period of time with a fixed price (Moris & Phil- ip, 2006). Effective factors on demand of goods are (Salvatore,
2007):
Table 2 shows that the procedure of tire production didn’t | 1. | Goods price |
go with the needs of the society, thus it led to the unbalanced | 2. | Individual income |
between demand and supply in the market. But this procedure | 3. | Individual wealth |
went towards balanced due to modern and new technology | 4. | Price of other goods |
and methods of production and increase in production of ve- | 5. | Individual tastes |
hicles in the world so that there would be no remarkable gap | 6. | Individual expectations |
between demand and supply of tire by 2012.
TABLE 2
There can be different relations between two goods from eco-
nomical point of view (Moris & Philip, 2006):
1- Complementary products:
IJSER © 2013 http://www.ijser.org
International Journal of Scientific & Engineering Research, Volume 4, Issue 9, September-2013 1941
ISSN 2229-5518
Two goods, for example x and y are complementary to each other when alteration in demand of x is in counter with the price of y, it means:
Those goods that are used simultaneously by demander are complementary, for example tea and sugar.
 (1)
(1)
2- Alternative products:
Two products x and y are substitutions when changes in de- mand of x with changes in price of y are in the same direction i.e.:
 (2)
(2)
3- Neutral products:
Two products x and y are neutral when change in demand
of x has no relation with change in price of product y. In other
worlds, tow products are independent from each other. i.e.:
 (3)
(3)
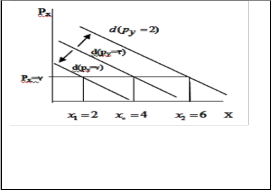
In this paper cars and tires are two complementary prod- ucts. Diagram below shows the effect of change in price of complementary products and demand transfer curve for the product x (fig1).
Fig2. Change in the price of complementary product and demand transfer curve for the product x (Salva- tore, 2007)
The above figure shows the change in price of complementary products and demand transfer curve for product x. as it is seen, by increasing the price of complementary product (cars). Demand for product x (tires) decreases and vice versa.
Fig3. Balance of the market.

The above figure shows the balance of the market in which e is the balance and p_e is price equilibrium. The surplus in demand and supply can cause imbalance..
3 RESEARCH METHODOLOGY
Quality and quantity method has been used to access the needed information about effective factors on tire industry of the country and analyzing them. In part of quality, it has been found that joining the explorative interviews and documen- tary data is necessary to know more about the matter. Qualita- tive studies usually founded on interviews and considerations of documentaries (Miles and Huberman, 1994). In this paper after reviewing the theoretical base, considering documentary, analyzing statistics of tire and vehicle production in Iran and the world, and interview with experts, variables and dyna- misms existed in this arena have been recognized and with a dynamic modeling system approach presented in a dynamic model of framework following questions arises:
1- What are the effective factors on the tire production of the country?
2- How are the relations and severity of the relation be- tween variables?
3- How is the procedure of tire and vehicle production in Iran and the world?
Dynamic modeling system approach is a scientific method which is used to model complicated problems in a strategic level and for countering various variety and feedback and concentrating on determining factors in a system behavior (Sterman, 2000). Dynamism in systems exists by interaction of two types of rings, i.e. positive ring (Reinforcing) and negative ring (Balancing). Positive rings cause intensify and strengthen whatever happens in the system and negative rings has a neu- tralizing and balancing role and they oppose changes. In caus- al loop diagrams positive relation means that the increase (de- crease) in one variable leads to increase (decrease) in another variable and in a negative relation, an increase in one variable leads to decrease which in turn the decrease leads to an in- crease of other variable (Sterman, 2000).
In continuation of main variable effects of this model, it is considered by Fuzzy DEMATEL technic. In order to evaluate the effects of each element on each other, a questionnaire with oral variables in form of couple with comparison was designed and completed by 10 experts and specialists in the field of tires.
DEMATEL technic can not only convert the relations be- tween cause and effect to a structural model, but also can be used as a suitable way to face internal dependencies of a set of parameters. In dead, DEMATEL here is able to present remark- able information about network process analysis to decision makers. Due to facing with ambiguities in human evaluations, from comparative scale used in DEMATEL method, we use Fuzzy scale suggested by Lee (1999). Following table shows the different degrees of “effect”.

TABLE 3
CORRESPONDING LINGUISTIC VALUES WITH THE LINGUISTIC EXPRES-
IJSER © 2013 http://www.ijser.org
International Journal of Scientific & Engineering Research, Volume 4, Issue 9, September-2013 1942
ISSN 2229-5518
SIONS
k k k k
k Z
λ m u
X =


ij = ij ,


ij , ij
(8)

Linguistic judgments
No influence
Very low
Corresponding triangular fuzzy number
(0,0,0.25)
(0,0.25,0.5)

ij r k r k r k r k
Like common DEMATEL method we assume that there is at
n
influence
Low influence
High influence
(0.25,0.5,0.75) (0.5,0.75,1)
least one i that
∑u ij
j =1
< r k

Very high influence
(0.75,1,1)
This assumption is met well in practice. Then algebra phrase by multiplying a fixed number to a Fuzzy number and adding two Fuzzy numbers is used to computing average matrix


, taken from 1 2 P
To determine the relations among parameters C= {Ci ׀ i= X
1,2… n}, a group of decision making including 10 experts are
asked to gain a set of couple with comparasions interms of
X , X
, ..., X
X X
X
word-expressions. From this 18 fuzzy matrix

(X 1 ⊕ X 2 ⊕ ... ⊕ X p )
11 12 1n

is provided by the experts’ views.
X =
; X = X 21
X 22
X 2 n
p
0 Z12
Z1n
X n 1
X n 2
X nn
(9)
k k
k k
In which that:
Z k
Z
= 21
0 Z 2 n
k = 1, 2, ..., p
p
k k
∑ X k
(10)
Z n 1
Z n 2 0
(4)
X ij
= k =1
p
Here, Z
= (λ , m ,u )
Z k
k k k k
ij ij ij ij
fuzzy matrix
, initial

The fuzzy matrix , is called direct-relation normal fuzzy
matrix. Here we use average arithmetical for making unification
direct-relation Fuzzy matrix is called the  expert.
The next step is to get the normal direct-relation Fuzzy ma-

trix, assuming , are triangular Fuzzy numbers.
of whole outputs given by experts after computing direct- relation normal fuzzy matrix X . This method is better than the unification of whole outputs given by experts after compu- ting initial relation fuzzy matrix Z .
k k
k k k
Next step is the performing and structural modeling analy-
n n n n
ai
= ∑ Zij =
∑ λij
, ∑ m ij
, ∑u ij
(5)
sis. To compute total relation Fuzzy matrix, first we have to
j =1
j =1
j =1
j =1
guarantee the convergence of Lim X w = 0
k n k
w →∞
r = max ∑u ij
1≤i ≤n j =1
(6)
In computing X w
, approximation relation
Then to convert parameters scale to comparable scales is from converting linear scale used in form of normalization for-
of n1 ⊗ n2 ≅ (λ1 × λ2 , m1 × m 2 ,u1 ×u 2 )
tiplying two Fuzzy triangular numbers.
w
is used for mul-

mula. Direct relation normalization Fuzzy matrix of the ex-
Therefore, the elements of
X are also Fuzzy triangular
pert, means
X k is shown as bellow:
numbers. According to an absolute condition total relation
Fuzzy matrix is defined as below:
11 X 12
X 1n
T = Lim (X + X 2 + ... + X w ) = X × ( I − X )−1
(11)
k k k
k k k
X k
X
= 21
X 22
X 2 n
k = 1, 2, ..., p
Now that T is obtained, we use CFCS method for Fuzzy
k k k
removal and to get total relation matrix (Zhao et al, 2011).
Therefore, for CFCS method we shall have:
X n 1
X n 2
X nn
(7)
nk = (λk , m k ,u k ); k = 1, 2, ..., n
In which that:
If
are Fuzzy triangular number and n def
is the reagent of their
IJSER © 2013 http://www.ijser.org
International Journal of Scientific & Engineering Research, Volume 4, Issue 9, September-2013 1943
ISSN 2229-5518

absolute amount. We also have:
L = min (λk ) , R = max (u k ); k = 1, 2, ..., n , ∆ = R − L
Then:
def
2 Nazari
3 Salvatore
2006
2007
From effective factors on GDP, one can point
to the economic situation of a country and
employment. Also inflation can act as a mod- erator of GDP.
Those products that are used simultaneously are complementary. In this paper two products i.e. cars and tires complementing each other.
nk
×
= L + ∆
( m − L ) ( ∆+ u − m )2 ( R − λ ) + (u − L )2 ( ∆+ m − λ )2

( ∆+ m − λ ) ( ∆+ u − m )2 ( R − λ ) + (u − L ) ( ∆+ u − m )
(12)
Saipa’s
4 company report
2006
Saipa company's research on base of modeling from 30 typical countries in the world in dif- ferent situation including per capita income, the number of population, economic growth shows that there is a direct relationship be- tween per capita income and number of cars.
4 CONCEPTUAL MODEL OF RESEARCH
Models lie into two groups i.e. stationary and dynamic. In the first models (stationary), the factor of time is not considered and or the model situation in the case of momentary is shown. On the contrary, dynamic models are models that change the relations and components by passing the time (Hamid Zadeh,
1995). In general, we can highlight some characteristics for the second models (Bahrami et al, 2007):
- Permanent dynamism and propellant.
- Finding the cause of problems in organization.
- Performing great jobs by using ordinary facilities.
- Be sensitive and sober when problems arise.
- Producing goods and services.
In cause and effect model of demanding tire ring in balance
and reparative prevailing cause dynamic movement in the
whole linkage. By increasing the rate of importing vehicles,
existing number of vehicles in the country increased and sub-
jected to the breakeven will come down.
Following such procedure and reach to the equilibrium, the
demand for vehicle increased and production planning of ve-
hicle develops. The rate of production extends upwards by
growing of vehicle production programs, and this is the main
factor of increasing the real inventory of vehicles. Because the
demand for tires is dependent and resulted the demand for vehicles, so by increasing the real inventory of vehicle in the country leads to increasing the rate of tire consumption, since vehicle without tires is useless. By growing up the demand for
tires, production of tires will go up in the country. Automating program of lines and transferring technology from tire pro- ducers of powerful countries will be expanded. In the concep- tual method, it explains the other dimensions of cause and effect relations. Brief description of system's loops and its backup views related to effective factors on tire industry is presented in table (4)
TABLE 4
CLD DIAGRAM
Nazemi
7 & Et al
Ministry of Indus-
9 tries and
Mines of
Iran
Ministry of Indus-
10 tries and
Mines of
Iran
Tavana &
11 Et al
12 Michelin
Tavana &
14 Et al
2006
2006
2006
2009
2005
2009
Demanding cars related to various factors. The most important of are, the amount of income, population, the rate of employment, geograph- ical zone, transportation facilities replacing vehicles. The price of petrol, the price of car (initial price and maintaining expenses, and finally the age of vehicle.

Tire as a part of downstream industries in automotive manufacturing, up and down vicis- situdes was almost similar to the automotive and its place in vehicles not as a thousand parts of consuming, but as a one of important and completing component that enables cars to carry weight and approach high speed under different atmosphere.
Tire is accounted to a petrochemical down- stream industry that in the light of existing rich oil and gas sources and petrochemical industry has got advantages in producing tires.
This industry of the country in addition to job creation of 14000 people directly, employed 70 to 80 thousand persons indirectly in sub-units and relevant industries.
Tire consumption is affected directly by the use of vehicles.
Tire consumption is not only subjected to the number of vehicles but also affected by the distance gone and load and passengers carried in per unit of time.

In the light of governing in value chain, distri- bution network from wholesaler and ware- housing and retail are the most important part of tire value chain of a country on basis of comparative studies have been done, all great tire manufacturers started powerfully in this arena and have created particular distribution network.

Author
Year
Context

1 Nili
2007
Gross domestic product (GDP) covering the
value of total goods and services produced in a
specific period in a country usually in a year.

IJSER © 2013 http://www.ijser.org
International Journal of Scientific & Engineering Research, Volume 4, Issue 9, September-2013 1944
ISSN 2229-5518

A9 0.124
0.082
0.124
0.124
0.208
0.499
0.467
0.363 0

TABLE 7
NORMALIZED DIRECT RELATION MATRIX ELEMENTS OF D


Factors A1
A2 A3
A4 A5 A6
A7 A8 A9
A1 0.144
0.068
0.162
0.162
0.126
0.162
0.083
0.091
0.000
A2 0.055
0.033
0.055
0.164
0.225
0.213
0.022
0.000
0.068
A3 0.001
A4 0.067
0.098
0.069
0.193
0.022
0.193
0.022
0.213
0.022
0.122
0.000
0.000
0.033
0.098
0.022
0.083
0.022
Fig4. Causal loops tire demand
After drawing of systemic model of research that shows ef- fective variables on tire production of the country. With the help of ANP method we identified nine factors which have the
A5 0.055
A6 0.049
A7 0.258
A8 0.162

A9 0.000
0.022
0.031
0.213
0.000
0.098
0.001
0.067
0.000
0.258
0.126
0.033
0.000
0.193
0.181
0.135
0.000
0.031
0.049
0.181
0.056
0.022
0.033
0.022
0.045
0.033
0.001
0.001
0.033
0.045
0.033
0.045
0.022
0.033
0.033
0.022
0.001
0.001
0.001
0.022
0.033
most effect on tire demand according to the following table:
TABLE 5
TABLE 8
FACTORS RELATED TO THE T MATRIX OF RELATIONSHIPS
VARIABLES AFFECTING THE DEMAND FOR TIRES


Factors A1
A2 A3
A4 A5 A6 A7
A8 A9
A1 0.338
A2 0.189
A3 0.216
A4 0.133
A5 0.086
A6 0.105
A7 0.409
A8 0.353

A9 0.132
0.233
0.138
0.251
0.120
0.049
0.077
0.331
0.166
0.192
0.340
0.171
0.356
0.097
0.038
0.114
0.192
0.407
0.238
0.391
0.300
0.410
0.108
0.076
0.065
0.389
0.393
0.272
0.292
0.321
0.370
0.087
0.035
0.074
0.197
0.314
0.156
0.269
0.281
0.232
0.040
0.046
0.059
0.107
0.134
0.095
0.134
0.059
0.053
0.052
0.011
0.016
0.078
0.090
0.064
0.162
0.056
0.169
0.048
0.056
0.039
0.091
0.100
0.066
0.046
0.094
0.118
0.038
0.011
0.012
0.038
0.056
0.055
It’s remarkable to notice that both of two factors of tire de- mand and vehicle have self-effectiveness and to identify these effects Fuzzy triangular numbers have been used. The results are shown as below tables with regard to the Fuzzy DE- MATEL process.
TABLE 9

TOTAL IMPACT FACTORS GIVEN AND TAKEN
Factors
TABLE 6
MATRIX A DIRECT RELATIONSHIP BETW EEN THE FACTORS
A1 2.205
A2 1.609

A3 2.175
0.468
0.788
0.556
2.673
2.396
2.731
1.738
0.821
1.618

Factors
A1
A2
A3
A4
A5
A6
A7
A8
A1
0
0.254
0.309
0.082
0.004
0.004
0.004
0.082
A2
0.337
0
0.362
0.082
0.166
0.082
0.124
0.124
A3
0.309
0.082
0
0.124
0.004
0.004
0.124
0.166
A4
0.602
0.791
0.453
0
0.082
0.124
0.082
0.166
A5
0.467
0.833
0.791
0.082
0
0.116
0.18
0.67
A6
0.602
0.607
0.714
0.082
0.124
0
0.714
0.67
A7
0.602
0.203
0.714
0.082
0.004
0.25
0
0.957
A8
0.254
0.124
0.362
0.256
0.082
0.116
0.791
0
A9
0.535
0.203
0.004
0.25
0.203
0.18
0.957
0.602
A4 0.724
A5 0.408
A6 0.561
A7 1.832
A8 2.013

A9 1.269
1.265
1.846
2.404
1.951
1.557
1.961
1.989
2.254
2.965
3.783
3.570
3.230
-0.541
-1.438
-1.842
-0.119
0.456
-0.692

IJSER © 2013 http://www.ijser.org
International Journal of Scientific & Engineering Research, Volume 4, Issue 9, September-2013 1945
ISSN 2229-5518
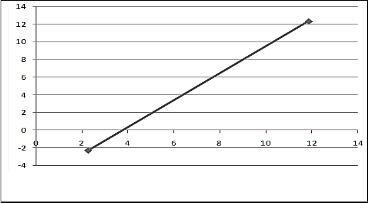
TABLE 10
MATRIX T FOR DIMENSIONS OF RELATIONSHIPS

Factors

T1

T2
T1
3.153
4.153
T2
1.876
2.911
TABLE 11
TOTAL DIMENSIONS ARE GIVEN EFFECT
Fig6. Effects of general factors

Factors 


T1 | 5.030 7.306 | 12.336 | -2.277 |
T2 | 7.064 4.788 | 11.852 | 2.277 |
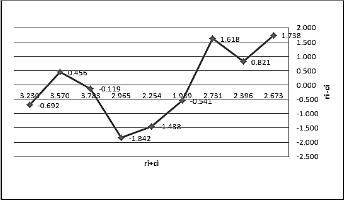

Table 5 shows the nine factors in form of impress and impressionable parameters. As it is clear from the table that factors affecting on tire demand from the view of experts in field of the tire consumption rate, the real tire inventory of the country and importing vehicle and tires and these factors are parts of effective parameters on tire demand. On the other hand, transfer technology indexes, distance paved, vehicle eagerness ratio, automobile real inventory developing transportation navy are of impressionable parameters in the country. Diagram 3 shows the result of analysis:
Fig5. Effects of 9-fold
In table (9) we analysis the two factors of tire demands and vehicle demand. As it is clear the demand of vehicle known as effective parameter and the demand for tire as impressionable. The related analysis is shown.
Identifying and drawing of effective factor on tire demand as rings of cause and effect can help to understand better. Tire industry in Iran with 50 years old and considering all effective parameters on car demand in Iran and also for being political and economic tariffs (Middle East and Africa car 2008) have got specific direction. The industry has now plays a great role in national products with about 15000 employees directly and a sale about 750-800 million dollars per year and meet nearly
70% of country’s need to different kinds of vehicle’s tire such as cars, buses, light and heavy trucks, road constructing, agri- cultural and also tires for bicycles and motor-cycles (Tavana et al, 2009, p1). What is obvious is that tire demanding is related to the demand and technology progress in automotive indus- try. Internal car companies’ obligations and emphasis on price and delivery time reduction, upgrading the quality of product and suppliers, concurrent with world changes, privatizing of reliant organizations, joining to world trade organization and possibility of entering powerful competitor in Iran’s market all challenge the car demand that will lead to decrease of tire de- mand in the country.
REFERENCES
[1] Asgharizadeh, E., Ansari, M., Kiyani Mavi, Z. (2005). “Weighting and ranking of indicators on quality tires with multi-criteria decision making techniques Case Study: Kavir Tire Corporation”, Journal of Knowledge Management, Year 19, No. 75, pp. 21-3.
[2] Bahrami, A., Yadegarzadeh, G. R., Parand, K. (2007). “Policy and factors affecting educational evaluation: an approach based on dy- namic systems”, journal of Research and Planning in Higher Educa- tion, No. 44, pp. 84-49.[Persian]
[3] Forrester, J. W. (1971). Principles of systems. Productivity Press, Cambridge.
[4] Global Tire Report, (2008). European Rubber Journal.
[5] Hamidizadeh, M. R. (2000). “System dynamics”, Tehran, Beheshti
University.
[6] Investing in global leadership (2005). Michelin, Paris, Nov.
[7] Nazari, M. (2006). “Macroeconomic management”, knowledge look
Publications, Tehran.
[8] Nazemi, J., Jangi, A. H., Momeni, A. (2006). “Iran's vehicle market is expected to act on the global automotive market”, Saipa Group Re- search, International Marketing Manager.
[9] Nili, M. (2006). “Foundations of Economics”, Ney Publishing.
IJSER © 2013 http://www.ijser.org
International Journal of Scientific & Engineering Research, Volume 4, Issue 9, September-2013 1946
ISSN 2229-5518
[10] Philip & Morris (2006). “Economic Analysis”, Tehran University, Vol
2, 7 editions.
[11] Report on Iran's Ministry of Industries and Mines. (2005). [12] Report Saipa Co., (2006)
[13] Salvatore, D. (2007), “Theory and microeconomic issues”, translated by Hassan Sobhani Publication Nay.
[14] The Middle East and Africa Car/LCV market (2008), PR Newswire Europe
Limited, London.
[15] Tavana, A., Emami, N., Tanha, M., Taghvayi, S. (2009). “The tire industry outlook in 1404”, Rubber Research and Engineering Com- pany, Association of Rubber Industry in Iran.
[16] Zhou Quan, Huang Weilai, Zhang Ying. (2010).Identifying success factors
in emergency management using a fuzzy DEMATEL method, Safety Sci- ence.
[17] www.wordwatch.org
[18] www.irane1404.com
IJSER © 2013 http://www.ijser.org