International Journal of Scientific & Engineering Research, Volume 6, Issue 3, March-2015 120
ISSN 2229-5518
Productivity Improvement in Semiconductor Subcontracting Company Using Simulation Modeling
Gutierrez, Ma.Teodora E. Industrial Engineering Department Technological Institute of the Philippines Quezon City, Philippines
Abstract
The study aims to improve the existing production output of a semiconductor industry through simulation modeling. The study covers the front line process of back end semiconductor subcontracting firm. The focus is on the first step of the process which is the die attach. During observation, there were significant occurrences of unscheduled machine downtime which resulted in the interruption of production process. The machine downtimes were caused by man-machine interaction. The study shows that Frame Error in Input Bin and Frame Error in Output Bin in the die attach section contributes to the machine downtime. The simulation output revealed that there was an increase of throughput by 15, 600 production units per day, if the current situation of having an unscheduled machine downtime will be eliminated.
There should be an alarm for the machines when supplies were not refilled. The man-machine ratio must be reviewed to determine if the machine assignment per operator is efficient. Lastly, the layout of the section should be reviewed so that operator can better observe and monitor the many machines he is handling.
Keywords: Simulation Modelling, Die Attach Process, Semiconductor Process
1 INTRODUCTION
—————————— ——————————
here is a strong presence of outsourcing as evident from the recent information of the database of a world leading provider of company profiles and country reports, which roughly estimated that there are 1,480 firms that engaged in outsourcing worldwide. Majority (i.e. 25%) of these firms are positioned as the highest earner at an annual
revenue of 2,000 US$M and above [1].
This phenomena was supported by the longitudinal study
of Beugelsdijk,S., Pedersen,T., Petersen,B. (2009 )over the two
decades which indicates that the multinational companies con- tinuously inclined to invest in several parts of the world espe- cially in developing countries[2].This progression corroborates with the recent data about manufacturing outsourcing activi- ties (also called contract manufacturing), in which in 2001, it was estimated to have worth $120 billion and has been the fastest growing sector among manufacturing industries with a yearly growth rate of more than 80% between 1996 and 2000 [3].Hence, It becomes necessary to look into the manufacturing process of a subcontracting/outsourcing firm and improve their productivity in order to become more competitive
————————————————
• Ma.Teodora E.Gutierrez is currently an Assistant Professor IV in Indus- trial Engineering Department at Technological Institute of the Philippines, Quezon City. She is currently pursuing doctorate degree program in indus- trial engineering at De La Salle University, Philippines. E-mail: dhorieg@gmail.com; ma.teodora.gutierrez.tip.edu.ph
2 PROCEDURES
Simulation is an appropriate quantitative tool that could gen- erate several scenarios which can reflect the dynamic charac- teristic of an investigated system.Simulation is the “imitation of a real world process or system over time”[4]. The study use descriptive research that primarily relies on observation as a means of collecting data [5]. The study will also employ exper- imental research. Experimental research is defined as isolating and controlling the relevant conditions which determines the events investigated and identifies the effects when the condi- tions are manipulated[6].
3 RESULTS AND DISCUSSIONS
The study relies on direct observation as a means of collecting data. The study covers the front line process of back end semi- conductor subcontracting firm. The focus is on the first step of the process which is the die attach.
The case study company is a subcontracting firm of a Multina- tional Companies that sells integrated circuits and electronic parts all over the world. The case study company conducts assembly and tests of various semiconductor products such as Radio Frequency Identification Device (RFID), Opto Modules, etc. with monthly capacity of up to 3 million units. The case study company is now in 3 decades of doing semiconductor business.
IJSER © 2015 http://www.ijser.org
International Journal of Scientific & Engineering Research, Volume 6, Issue3, March 2015 121
ISSN 2229-5518
3.1 Die Attach Process Description
Die attach is the first process and is considered as critical since the downstream relies on the output of this process. The manufacturing plant. Cause and Effect Diagram in Die Attach Processthe die attach working table.
The operator then fills empty magazines with 20 strips each. The operator will then loads two magazine in the loading bin of the die attach machine. Then machine will run to process the input part. The machine will automatically load the pro- cessed strips into empty magazines in the post process bin. The operator unloads the magazines with the processed part and takes one strip for inspection, which will take 25 seconds. If the sample parts are good, then the operator will transport it to the curing trolley. When 40 magazines ( 8 lots ) have accu- mulated at the curing trolley, curing process is The direct ob- servation of the manufacturing operation in the case study company was conducted for three consecutive days. Then af- ter a week, another one day was spent for direct observation in the manufacturing process particularly the die attached section so as to validate the data gathered and the simulation results.
During the observation and as confirmed by the operators and supervisor there are downtimes of the die attach machines. Machine downtime is the time during which a machine cannot be operated because of breakdown.To be able to determine the causes of machine downtime a Pareto analysis was conducted.

Figure 1 – Pareto Chart for Causes of Machine Downtime
The above figure shows the number of occurrences of the different causes of downtime based on direct observation. Frame error in Input BinMagazineand Frame error in Ouput Bin Magazine contribute most to the problem of machine downtime in the die attach. In the 12 hours operation, there is usually 60 times occurrence of these machine downtime. The other causes of downtimes of the machines are misalignment, electrical problem, and empty wafer for the photo and inte- grated circuit pads but occurs in few times only.
The way in which the machine could stop running was because of the machine detects there is no frame in the iput bin magazine. This means that it will stop running be- cause the machine does not have input supply to be processed. And the cause of it is that operator did not refill/reload the input materials. In other words, the machines are usually down or idle when the operator is not able to load magazines or supply( i.e. frame error ( input bin ). There is no alarm in the machine that operator could be informed about the need to refill again the frame. Hence, it leads to interruption of opera- tions in the die attach. This occurs for about 60 times per shift (i.e. 12 hours). Every machine downtime in the loading part (i.e. frame supply error) could last on the average of .75 minutes with standard deviation of 0.54 mins.
Another instance when machine stops’ running is when operator was not able to unload the processed parts which was cased in the magazine. It occurs 60 times as well in the 12 hours operation. Although machine has an alarm in the frame roller which is the unloading part of the machine, the downtime has an average of 0.62 minutes with standard devi- ation of 0.312 minutes. Furthermore, upon knowing the causes of machine downtime, the time to process each elemental ac- tivities in the die attach was gathered through time and mo- tion study.
In Table 1, there are 6 elemental activities in the die attached. Instead of using an average time for the 10 cycle observations, the study used probability distribution to capture accurately the performance of the system. The 10 observed time of each element were inputted to the stat: fit which determines the appropriate probability distribution which will then inputed in the simulation model. It will be noted that element descrip- tionno.7 and no.8 are the downtime of the machine which was discussed earlier.
3.2 Simulation Modeling
The processing time for each element description was collected from one lot or one batch. One lot is equivalent to one magazine. One magazine has 40 strips. One strip has 20 integrated circuits. The study was conducted for 3 days and another 1 day for the validation of the data gathered. The pro- cessing times which become the simulation syntax as shown table 1 were used in simulating the existing process. Figure 2 shows the simulation model of the existing process in die at- tach section. The result of the simulation was shown in table
2.Two scenarios were applied in the simulation model, scenar-
io 1 is the existing process which includes the observed ma-
chine downtimes. Scenario 2 in the simulation model does not
include machine downtimes ( i.e. frame error ( input bin) and
frame error ( Output Bin ).
IJSER © 2015 http://www.ijser.org
International Journal of Scientific & Engineering Research, Volume 6, Issue3, March 2015 122
ISSN 2229-5518
Table 1 - Existing Process in Die Attach with time study
ered data into a simulation modeling 4 basic modeling con- struct takes place.
The first step is to identify the locations. This involves the presentation of machines, conveyors, workstations, etc. in the areas of investigation. In the case study company , two highly automated machines are involved which are one unit of Photo Machine, one unit of IC IC machine and other equip- ment such as one unit of microscope, one area for storage and one working table. One operator is assigned to work on this process. Table 2 is the simulation text for locations which also incorporates the observed machine downtime for the two ma- chines.
The second step in simulation modeling is to identify
the Entities. The entity in the model is named as raw materials.
The third step is to identify when the raw materials
arrived. It was set to arrive every 5 minutes, meaning materi-
als are assumed to be available in all time.
The Last step in simulation modelling is to identify
the processes. Thisincludes defining the routing of parts
through the system and to specify what operations are per-
formed for each part at each location. Table 3 shows the simu-
lation text for Processing, the move logic was done by an op-
erator.This is called resources. The simulation was run in 8 hours with 2 replications.
The simulation was also run by two scenarios. The first scenario is the existing conditions of the company which have an unscheduled downtime due to machine breakdown as
discussed earlier. The second scenario is the proposed scenario where the unscheduled downtime should be eliminated.
Table 2 - Simulation text for Locations with observed Ma- chine Downtime (Existing Scenario)
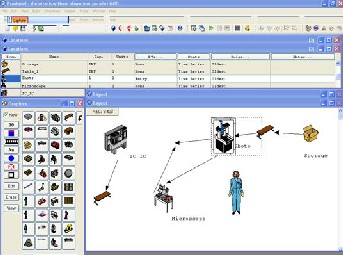
Figure 2 - Simulation model of the existing process in die attach
A simulation model was presented based on the pro- cess description of die attach.In order to transform the gath-
IJSER © 2015 http://www.ijser.org
International Journal of Scientific & Engineering Research, Volume 6, Issue3, March 2015 123
ISSN 2229-5518
Table 3 – Simulation text for Processing 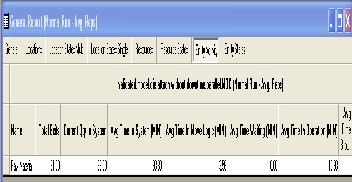
Figure 4 - Simulation Results in Scenario 2 (W ithout machine downtime)
Table 4 – Simulation model results with present and pro- posed scenarios
3.3 Simulation Results
The results of simulation are seen infigure 3 and figure 4. Ta- ble 4 also summarizes the important performance measure of the process.

Figure 3 - Simulation Results in Scenario 1 (W ith machine downtime)
The existing process (Scenario 1) resulted to an output of
54.5 lots or magazines which are equivalent to 130,800 integrated
circuits or production units per day (UPD) for die attach section. This simulation result provides a valid representation of the case study company because the resulted number of exits (or produc- tion output) falls within the current capacity of the case study com- pany.
oreo-
ver,
the machine percent operation or utilization for this scenario are
64.01 % for photo machines and 60.675 % machine operation in IC
IC machine.
On the other hand, the proposed scenario( Scenario 2 )
where the unscheduled machine downtime was eliminated the
output is 71.7 lots or equivalent to 146, 400 integrated circuits or production units per day.
This resulted to an increase output by 15, 600 production units per day. The machine percent operation or utilization are 71.7
% for Photo machine and 68.095% for IC IC machines.
Clearly we could see that there is a significant difference in the
production output if unscheduled downtime is eliminated. Even if it seems that the machine downtime caused by the operator not able to load and unload the magazines into the machine occurs in a very short span of time which has average of 30 seconds it still af- fects the production outputs and other productivity measurement such as machine utilization.
4 CONCLUSION
The machine downtimes were caused by man- machine interaction. The study shows that Frame Error in Input Bin and Frame Error in Output Bin in the die attach section contributes to the machine downtime. There is an increase of throughput by 15, 600 production units per day if the current situation of having an unscheduled
IJSER © 2015 http://www.ijser.org
International Journal of Scientific & Engineering Research, Volume 6, Issue3, March 2015 124
ISSN 2229-5518
machine downtime will be eliminated.
The study shows how simulation modeling provides
opportunity to trace the causes of inefficiencies of the
process and measure the production losses. Moreover,
simulation has a feature that provides the use of proba-
bility distribution function of the processing time, which
in effect provides a true representative of the perfor- mance of a system.
There should be an alarm for the machines when supply wasnot refilled. The man-machine ratio must be reviewed if the machine assignment per operator is effi-
cient. Lastly, the layout of the section should be reviews so that operator can better observe and monitor the many machines he is handling.
REFERENCES
[1] Data monitor 360, 2012
[2] Beugelsdijk,S., Pedersen,T., Petersen,B. ,(2009).” Is there a trend to- wards global value chain specialization? — An examination of cross border sales of US foreign affiliates”. Journal of International Man- agement 15 (2009) 126–141
[3] Aissaoui,N., Haouari,M., Hassini,E.(2007) “Supplier/subcontractor selection and order lot sizing modeling: A review”. Computers & Operations Research 34 (2007) 3516 – 3540
[4] Pawar, A. ( 2006 ) “ Simulation Based Performance Evaluation of Various Policies in Multi-Echelon Supply Chain. Thesis in Master of Science ( Industrial Engineering ), Pennsylvania State University .
[5] Clarke, R. J. ( 2005 ) “ Research Models and Methodologies “HDR Seminar Series. Faculty of Commerce.Spring session.2005 pp.1-65.
[6] Clarke, R. J. ( 2005 ) “ Research Models and Methodologies “HDR Seminar Series. Faculty of Commerce.Spring session.2005 pp.1-65.
IJSER © 2015 http://www.ijser.org