International Journal of Scientific & Engineering Research, Volume 5, Issue 5, May-2014
ISSN 2229-5518
Processing and Interpreting Water bodies and
1285
Road Networks from Satellite Images and storing them as QR Codes
Mukund Sarma, Aiswarya Somanath, Raghesh Krishnan K
Abstract— Study on remote sensing images is becoming an important target for geological survey activities, mineral exploration, industrial investment, etc. A detailed study and observation about an image is essential to classify every object in the image. This work aims to classify water bodies and road networks from satellite images. Satellite image analysis provides a statistically superior method of sampling that is not possible via conventional ground "grab sampling" methods. Satellite imaging can analyze the entire body of water and identify the areas that need treatment or can be used for planning purposes. However, heavy cloud obstruction or vegetation coverage will impact the ability to view and analyze water or land. Also, remotely sensed images may be severely affected due to different kinds of noise. In order to overcome this, initially, the image is checked for noise and is removed, if necessary using an iterative filtering algorithm for impulse noise removal. The denoising is followed by segmentation after which feature extraction or classification can be performed to identify the objects. After classification, the information is to be stored for future reference. The last step is to store back the information in the form of a QR code. Previously, barcodes were used for storing such information. However with the advent of smartphone technology, people are always connected to the internet and the new technology of QR codes is more suitable for this purpose. The information can be used f or various purposes like geographical surveys, mapping of regions and can also be used to find out the author or the person who has processed the image for any future clarifications.
Index Terms— Computer Vision, Edge extraction, Image Processing, LANDSAT, LEGION, Remote sensing, SWOT.
—————————— ——————————
ATER resources play an important role in regional, environmental and transportation planning. They also play an important role in disaster management,
industrial planning and agricultural production. Detecting water bodies is the first step for any planning. However, the process to extract these water bodies is not an easy task; various methods have been implemented and rejected due to the fact that some other features, such as cloud and building shadows could be misclassified as water. Other problems related with extracting water bodies is the size of the river in low spatial resolution images, and broken river segments. Roadways are an irreplaceable component of efficient transport systems in the globalized economy. Also, roadways play an important role during disasters to facilitate movement to safer regions. Study of roads from satellite images has been underway since the past
30 years, but significant progress has been achieved only during recent times due to the availability of high resolution images. Many automatic and semi-automatic methods have been put forth as a result of this research. However, no single method has been put forth for obtaining successful results under all conditions. In this paper, a preview of few of the existing methods which are in use today for extraction of roads and water bodies from satellite images is provided and a method
which can be used to extract them is proposed.
According to J. John [1] in this classification method a specific combination of absorbed, emitted and reflected electromagnetic radiation at varying wavelengths is used to identify an object uniquely so as to distinguish between water bodies and land. The region in the electromagnetic spectrum between 700 to 2500 nm, covers the near and middle infrared portion of the spectrum. In this region the water bodies almost absorb all incident radiant flux while the land surface, typically composed of vegetation and bare soil, reflects significant amount of near and middle-infrared energy. Therefore it is a straightforward task to delineate the land-water interface. The shortcoming of this approach is that when there are organic and inorganic particles in the water, the amount of electromagnetic energy leaving from the water increases, causing some part of the water to appear so bright that it is difficult to be recognised.
————————————————
Mukund Sarma and Aiswarya Somanath are currently pursuing Bachelors degree program in Computer Science and engineering from Amrita Vishwa Vidyapeetham, Amritanagar, Coimbatore, India. E-mail: mukundsarma9@gmail.com, aiswaryasomanath@gmail.com.
Raghesh Krishnan K is currently working as an assistant professor, Dept. of Information Technology, Amrita Vishwa Vidyapeetham, Amrita Nagar, Coimbatore, India. Email: k_ rag h esh@ cb. a mri ta . ed u
IJSER © 2014
International Journal of Scientific & Engineering Research Volume 5, Issue 5, May-2014
ISSN 2229-5518
1286
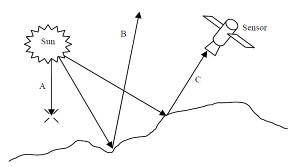
Fig. 1. Sensors measure the amounts of energy reflected
from or emitted by the Earth surface targets: Absorbed (A), Scattered (B), and Reflected (C) energy.
K.Waldemark [2] proposed a two-layered network for extracting water-bodies from satellite images using a neural network approach. In the first layer, based on the assumption that water bodies are homogenous, a multi-layer perceptron was used to automatically select water seed points, from which, the water region can be extracted. Neural networks can approximate arbitrary complex functions, so they are used to describe features that are being extracted in the remote sensing application. In the second layer, a LEGION (locally excitatory globally inhibitory oscillator network) was used to integrate pixels to form semantically meaningful entities, such as lakes, and rivers. This approach has several advantages. Firstly, this algorithm is hopeful to be a general method to extract objects from satellite images, based on the statistical feature of objects. Secondly, it can be implemented through parallel and distributed computation.
A novel algorithm with profile factor as the kernel circle is proposed for recognition of rivers. [3] Image unification, edge extraction and skeleton generation are the premier three steps. The profile factor of morphology can be expressed as shape functions for concrete judgment. Natural rivers profile is like “U” form, and artificial water-bodies profile is of the shape of “M” while highway’s section can be considered as “W” shape. Then corresponding profile factor functions (PFF) can be established for determination. The experimental comparisons show that the results by the proposed algorithm are close to the results obtained from high-resolution remote sensing images by manual interpretation.
2.4 Using the fuzzy c means and contour model method In [4], Disha Tiwari, Dr. G.P.Saroha and Urvashi Bhushan, propose two effective methods for extraction of roads using fuzzy c-means. The image is segmented using fuzzy c-means to identify clusters and the algorithm uses a weight for partial pixels belonging to clusters using which roads are extracted. In the semi-automatic process, users enter points through a GUI (Graphical User Interface) and using the snake or contour
method, roads are extracted. Both methods have been found to work better for suburban locations than for urban locations wherein rooftops were mistakenly identified as roads. A similar method is found in [5] where the fuzzy c means clustering is followed by application of genetic algorithms for extraction of roadways.
An automatic road extraction method has been identified by Vinay Pandit, Sudhir Agupta, K.S. Rajan in [6]. This method uses two copies of the image for determining positions of vehicles on the roads in order to come up with definite road seed points. These points are then used to extract the roads. The method can be extended to identify railroads as well. A possible improvement on this method would be to eliminate the discrepancies caused due to different reflectance as a result of change in sun angle. This method gave correct results for 3 out of 4 images.
Fig. 2. Using vehicular positions as road seed points. [6]
Cui ni, qin ye, Bofeng li, Shaoming Zhang have described a semi-automatic method called phase classification in [7]. Initially the road edges are detected using a canny filter and then the edges are grouped into straight lines or curves based on their amplitude and phase values. The possible road start points are detected and pixels are grouped together based on edge lines and gray levels to detect roads. This method was found to be highly effective in detecting elevated highways and straight roads without many obstructions.
Volodymyr Mnih and Geoffrey E. Hinton have evolved a method for detection of roads using neural networks in [8]. A large dataset is used in order to improve the training along with a post processing technique to incorporate effects of surrounding pixels on the identified ‘road’ pixels. The pre- processing, which involves increasing the context to prevent miscalculation of rooftops as roads, is followed by training neural networks using existing road maps. The method described by M. Ziems, M. Gerke and C. Heipke in [9] also makes use of existing data to train the system. The major
IJSER © 2014
International Journal of Scientific & Engineering Research Volume 5, Issue 5, May-2014
ISSN 2229-5518
drawback of these methods is that data may not be always readily available for training.
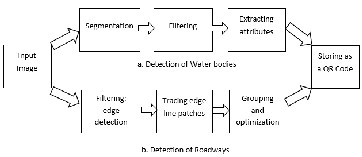
Fig. 3. Block diagram of the proposed method. Path (a) is used to detect water bodies and (b) is used to detect roadways.
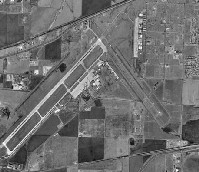
The input to this work is a grayscale LANDSAT image. One Hundred grayscale LANDSAT images of different resolutions were acquired for this work from ADRIN, Dept. of Space, Government of India. A preprocessing step is applied that checks if the image is noisy and if found to be noisy, it removes the noise using an Iterative Filtering Algorithm for Impulse Noise removal [10]. Noise free pixels within the neighborhood are searched and noisy pixel is replaced with value estimated from noise free pixels. This is an iterative process that happens until all noisy pixels are filtered.
1287
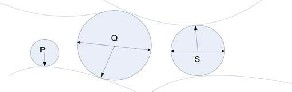
Fig. 4. Here P, Q and S are reference circles and Q is the centre pixel. [12]
One method to find these center pixels is skeletonization of the filtered image. Skeletonization is a process for reducing foreground regions in a binary image to a skeletal remnant that largely preserves the extent and connectivity of the original region while throwing away most of the original foreground pixels. In this case, we assume that roads have parallel edges and skeletonization finds the center pixels, i.e. the pixels along the parallel edges equidistant from both parallel edges.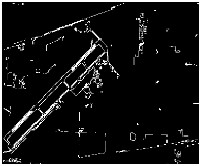
(a)
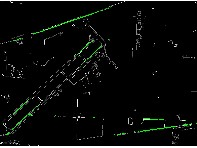
Filtering refers to the process of identifying the pixels which have the maximum possibility of belonging to the region that we are interested in extracting. There is a difference in the pixel intensities of pixels which belong to a road and those which belong to other regions. The boundary at which this difference occurs determines the edges of the roadway. Filtering can be used for edge detection in this case also. The best results have been found with the use of canny filter with an appropriate threshold value [11]. Once the edge pixels have been detected we proceed to find the center pixels. Center Pixel is defined as “For a pixel p, its reference circle C(p) is the largest circle centered at p that does not contain edge points. Visually, the radius of the reference circle is the maximum distance from the pixel to the closet edge point. A pixel is a central pixel if it has the maximum reference circle among its neighboring pixels” in [12].
(b)
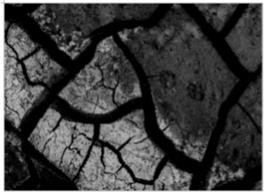
Fig. 5. Figure shows (a) Input image, (b) Filtration followed by
Skeletonization which shows broken paths formed by centre pixels.
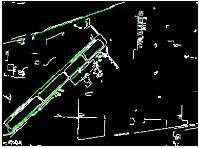
Once the relevant pixels have been identified, they need to be grouped together so that the roadway can be extracted. The paths formed by center pixels may appear broken in certain places due to noise or obstructions in the image itself such as fog or cloud. We can bridge these gaps using morphological operators so that they form a continuous path [13]. Once the gaps have been bridged we can identify the curved roads also using Hough Transforms, but with a shorter threshold for length and angle which is different
IJSER © 2014
International Journal of Scientific & Engineering Research Volume 5, Issue 5, May-2014
ISSN 2229-5518
from the values for straight line roads. The road is extracted as many segments which are extracted as straight lines by the Hough Transform.
1288
(a)
(b)
Fig. 7. Input image before (a) and after (b) applying the variance filter.
Variance is calculated using (1).![]()
𝑆2 = 1
𝑁 − 1
(1)
∑(𝑋𝑖 − 𝑋̅)
(b)
Fig. 6. (a) Result after using the morphological operations on the skeletonized image, (b) Applying Hough transform on (b) and adding the result to (b)
Variance filter is first applied on the input image. The variance filter has a unique ability to distinguish between flat, uniform terrain and rugged or varying country when used with satellite imagery renders it useful for segmenting water bodies. The variance filter has shown to be particularly successful in highlighting the shorelines of large water bodies.
(a)
Where 𝑋̅is the mean, 𝑆 is the standard deviation.
Once the variance filter is applied on the input image, a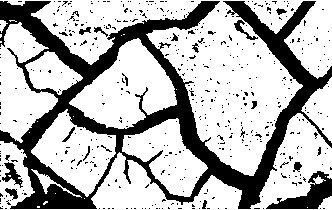
texture based segmentation method is used to segment the image using texture filters [14], [15].
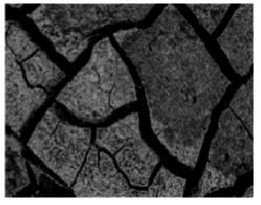
Fig. 8. Output of texture based segmentation.
The filtering module was implemented in order to remove sharp spikes and small regions from the binary image. The sharp spikes and small regions were considered as noises. The filter used was the morphological opening and closing operation. The structure element used was a 5×5 matrix. A
3 × 3 matrix would distinguish water bodies like ponds which are small when compared to a sea. Using a 7 × 7 matrix would clearly distinguish the shoreline from the water-body but would not work in the case of rivers. Figure
7 shows how a 3×3 matrix is helpful in distinguishing small water bodies when compared to a 5×5 or a 7×7 matrix. But like as mentioned earlier a 3 × 3 matrix would not distinguish water bodies that are small such as ponds. Using a 7 × 7 matrix would clearly distinguish the water-
IJSER © 2014
International Journal of Scientific & Engineering Research Volume 5, Issue 5, May-2014
ISSN 2229-5518
1289
body but would not work in the case of small water bodies. So the structure element used was considered as a 5 × 5 matrix. A 5 × 5 matrix can filter out water bodies without losing the characteristics of the image and at the same time detect shorelines accurately. The result of this filter applied to the image is shown in the Figure 9 (b). The filter first closes small holes, using the closing filter, and the opening filter eliminates small regions and smoothen the boundary of the objects. [16]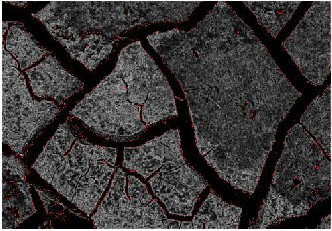
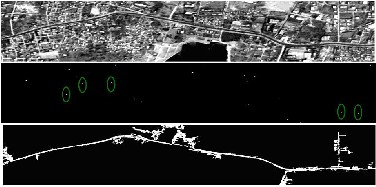
Fig. 10. Region inside the red boundary is classified to be water body.
The attributed extraction module was implemented in order to distinguish lakes and rivers. In this process the attributes extracted from each connected component were the bounding box, area, perimeter and compactness [18]. The compactness attribute is defined using equation 2.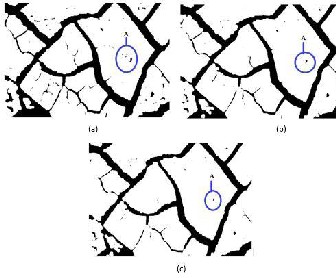
2![]()
𝐶���𝑎𝑐��𝑒�� = 𝑃𝑒𝑟𝑖𝑚𝑒𝑡𝑒𝑟
𝐴𝑟𝑒𝑎
Fig. 9. The figure shows the output for a 3×3 (a) matrix, for a 5×5 matrix
(b) and a 7×7 matrix.
The Path-Opening filter uses a flexible linear structuring element called path which is described by its length Lp. The flexibility of this structuring element in all the possible orientations has allowed the detection of the water bodies to be brighter than their surroundings. Path-Opening filters are proposed in order to improve the water/land contrast in satellite images. Using these filters, pixels forming linear structures having a length equal to or higher than Lp will preserve their values. Lp is used to set the length of the structuring element of the Path-Opening filter. Lp values ranges from 120 to 250. Pixels not forming linear structures longer than Lp are ignored. Consequently, the contrast of the water bodies against the rest of the image will improve.
The good performance of morphological filter explains why it has been used for the detection of road networks in very high resolution optical images [17].
(2)
Rivers in general are of large length but have a smaller width when compared to the width of a lake. A lake on the other hand generally has a large width but its length is not as long as a river.
One of the latest developments in the industry is the use of QR codes in many web applications. The basic concept behind QR codes is the barcode, and has been in use in the industry since the 1970s. QR codes in their present form were developed in the recent past, when they were and are still being used in production control of automotive parts in Japan and Korea. A quick response (QR) code is a two dimensional barcode that can be read on devices such as a mobile phone with camera or a laptop computer which, once accessed, allows you to complete an action such as reading some text, accessing a web site or texting a number. Mobile phones interpret the QR codes using decoding software. These QR codes are increasingly found in places such as product labels, billboards, and buildings, inviting passers-by to pull out their mobile phones. The two main advantages of QR codes are
• They can hold large amounts of data (upto 4KB) as compared to bar codes which can hold only upto 20 numerical digits.
• QR codes are free to generate and read. [19]
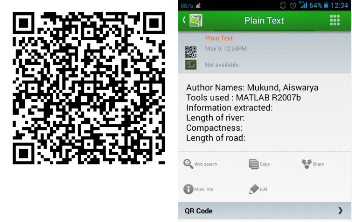
Figure 9 is an example of a QR code that stores information on what kind of image was processed and who processed the image using which tool. Details about the length of the river, the area of lake, compactness and length of the road can also be
IJSER © 2014
International Journal of Scientific & Engineering Research Volume 5, Issue 5, May-2014
ISSN 2229-5518
1290
stored for future reference.
(a) (b)
Fig. 11. (a) Example of a QR and (b) shows the data that is stored as a
QR code. QR Droid is the application used to scan the QR Code.
This QR code is added to the original image at the bottom as shown in Figure 12.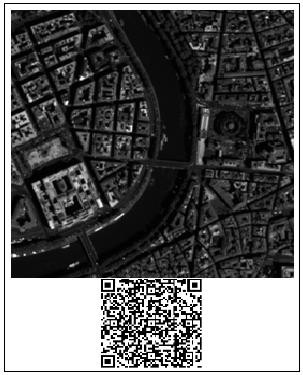
Figure 12. Figure shows how the QR code is joined to the original image
In this paper a few existing water detection techniques are discussed along with their advantages and disadvantages. And a new method to detect water bodies from satellite images is also discussed in detail. The segmentation process was the
major step in the whole process. If not done properly it could
classify shadows and clouds as water bodies too. Segmentation plays an important role as rivers may be classified as roadways due to their shape and width. Morphological opening and closing operations are used to improve the contrast of water bodies against the rest of the image. Components such as the length, area and compactness are extracted and stored as a QR code for future reference.For road extraction, edge detection is the most important step as it is the first step towards identifying the relevant pixels.
For Water body detection the segmentation module should be improved using the variance filter and a rule base algorithm or even more complex algorithm such as neural network segmentation. The preprocessing module of denoising should be improved using the curvilinear filter that denoises the image and also preserves the image characteristics. Better edge detection techniques with appropriate thresholds will help to improve the efficiency of the method to detect roadways. Larger data sets and high resolution images will also help to increase the success of the method.
We take this opportunity to express our profound gratitude and deep regards to Mr. K Raghesh Krishnan, Assistant Professor, Department of Information Technology, Amrita Vishwa Vidyapeetham, Ettimadai, Coimbatore, for his constant guidance, monitoring and encouragement throughout the course of work and formulation of this paper.
We also take this opportunity to thank Ms. S Padmavathi, Assistant Professor, Department of IT, Amrita Vishwa Vidyapeetham, Ettimadai, for providing us with valuable suggestions at all stages.
We would like to thank Ms. R Aarthi, Project Coordinator and Class Advisor for providing us an opportunity to undertake and complete this work.
We are also indebted to Ms. Amrita P, Assistant Professor, Department of Cyber Security, Amrita Vishwa Vidyapeetham, Ettimadai, for all the help and guidance that she provided.
[1]. J. John, Remote Sensing of the Environment - An Earth Resource
Perspective Prentice Hall, 2000, pp 379 – 406.
[2]. K. Waldemark. Patterns from the sky Satellite image analysis using pulse coupled neural networks from pre-processing, segmentation and edge detection Pattern Recognition Letters 21, 2000, pp. 227-237.
[3].Y. Lin A, L. Yan A A, Q. X. Tong. “Automatic recognition of rivers from LIDAR data by profile factor”.The International Archives of the Photogrammetry, Remote Sensing and Spatial Information Sciences. 2008, Vol. XXXVII. Part B1.
[4]. Disha Tiwari, Dr.G.P.Saroha, Urvashi Bhushan.”Road network
IJSER © 2014
International Journal of Scientific & Engineering Research Volume 5, Issue 5, May-2014
ISSN 2229-5518
1291
extraction from satellite images by active contour (snake) model and fuzzy c-means”, International Journal of Advanced Research in Computer Science and Software Engineering, Volume 2, Issue 5, May 2012 ISSN: 2277
128X.
[5]. H. Liu, J. Li and M. A. Chapman. “Automated road extraction from satellite imagery using hybrid genetic algorithms and cluster analysis” Journal of Environmental Informatics, Vol 1 (2), pp: 40-47, 2003.
[6]. Vinay Pandit, Sudhir Gupta, K.S. Raja. ”Automatic road network extraction using high resolution multi-temporal satellite images”. Geoscience and Remote Sensing Symposium, IEEE International,IGARSS Volume 5, pp: 272-275, 2009. DOI: 10.1109/IGARSS.2009.5417680
[7]. Cui Nia, Qin Yea, Bofeng Lia, Shaoming Zhanga. “Road extraction from high-resolution remote sensing image based on phase classification” The International Archives of the photogrammetry, remote sensing and spatial information sciences. Vol. Xxxvii. Part b3b, 2008.
[8]. Volodymyr Mnih and Geoffrey E. Hinton. “Learning to Detect Roads in High-Resolution Aerial Images”. 11th European Conference on Computer Vision, Proceedings, Part VI, pp 210-223, 2010. DOI: 10.1007/978-3-642-
15567-3_16
[9]. M. Ziems, M. Gerke, C. Heipke. “Automatic road extraction from remote sensing imagery incorporating prior information and colour segmentation”. International Archives of Photogrammetry, Remote Sensing and Spatial Information Sciences, 36, pp: 141-147, 2007.
[10]. Sharon Shakel. Gotru, Ch. SwapnaPriya. ”Iterative Filtering Algorithm for Impulse Noise Removal in Digital Images “, International Journal of Engineering Research & Technology (IJERT), Vol. 2 Issue 7, July – 2013
ISSN: 2278-0181
[11]. Huijing Zhao, Jun Kumagai, Masafumi Nakagawa and Ryosuke Shibasaki. “Semi-automatic road extraction from High Resolution Satellite image”. In Proc. ISPRS Technical Commision III Symposium: Photometric Computer Vision, page 406, 2002.
[12]. Yan Li and Ronald Briggs. "Automatic Extraction of Roads from High Resolution Aerial and Satellite Images with Heavy Noise", World Academy of Science, Engineering and Technology, Vol. 54, pp.416-422, 2009.
[13]. Mohamad M. Awad. “A Morphological Model for Extracting Road Networks from High-Resolution Satellite Images,” Journal of Engineering, vol. 2013, Article ID 243021. doi:10.1155/2013/243021
[14]. Wilson, P. A. “Rule based Classification of Water in LANDSAT MSS images using the Variance filter “. Photogrammetric Engineering and Remote Sensing, 63(5), 1997.
[15]. Pedro Santana, Ricardo Mendonca and Jose Barata.”Water Detection with Segmentation Guided Dynamic Texture Recognition”, ROBIO12 IEEE International Conference, 2012.
[16]. S. Grosdidier, S. Valero, J. Chanussot, R. Fjortoft. “River network detection on simulated SWOT images based on curvilinear denoising and morphological detection”. Geoscience and Remote Sensing Symposium (IGARSS), 2012 IEEE International ISSN: 2153-6996. pp: 5454 – 5457, 2012. DOI:10.1109/IGARSS.2012.6352372.
[17]. Yifeng ZHU, Camargo Neto Joao University of Nebraska – Lincoln. “Recognition of Lakes from Remotely Sensed Imagery.”CSCE 896
Computational aspects of GIS.
[18]. J.L. Starck, M. Elad, and D. Donoho. “Redundant multiscale transforms and their application for morphological component separation,” Advances in Imaging and Electron Physics, vol.132, pp. 287–348, 2004.
[19].Mukund Sarma. “Second Level Authentication using QR Codes”, International Journal of Computer and Internet Security. ISSN 0974-2247
Volume 5, Number 2, pp. 43-50, 2013.
IJSER © 2014