International Journal of Scientific & Engineering Research, Volume 4, Issue 4, April-2013 247
ISSN 2229-5518
Prediction of Attenuation coefficient of X band microwave
Signal under different atmospheric chaos (particles) .
Abstract: In this paper an attempt has been made for estimation of attenuation coefficient of microwave signals at different atmospheric chaos. The entire length of atmosphere has been considered as number of layer of sand, silt and clay particles in cascade form. The expression for attenuation coefficient of sand, silt and clay particles have been developed and depends on frequency, angle of incidence, visibility, permittivity, permeability. It is found that attenuation coefficient of microwave signal increases with frequency, decreases with angle of incidence and visibilities.
INDEX WORDS: ATTENUATION COEFFICENT, ANGLE OF INCIDENCE, X BAND MICROWAVE FREQUENCY, VISIBILTY.
1 INTRODUCTION:
The attenuation caused by sand and dust particles is one of the major problems in the utilization of microwave / millimeter wave bands for terrestrial and space communication. When microwave and millimeter waves pass through the medium containing precipitations like sand and dust particles, signals gets attenuated due to [1-3]
(i) Absorption of energy by these particles and its conversion into heat, and
(ii) Scattering of energy out of the beam by these particles.
Under the influence of incident wave, dust particles oscillate as ions and radiate energy in all directions. This results in appreciable amount of attenuation depending on size and concentration of particles. The theory of attenuation coefficients can be explained in terms of scattering and absorption cross-sections of a single particle. Different phenomena, such as, reflection, scattering, absorption and polarization cause considerable changes affection both phase and amplitude of the signal to a great extent [ 4].
In the present paper, a theoretical investigation has been carried out considering the layers of three main constituents i.e., sand, silt and clay of the storms to quantify the extinction cross-section and attenuation. The developed theoretical model has been used to determine the attenuation in terms of frequency, visibility, particles size and incidence angle.
2 THEORETICAL CONSIDERATIONS:
2.1. GEOMETRY OF PROBLEMS:
In order to consider the attenuation of main constituents of sand and dust storms, such as sand silt and clay, the profile structure of these constituents in atmosphere must be taken into accounts. The geometry of layers of different dust particles in storm is shown in Figure .1. The length of communication link is assumed to be L, which contain the layers of different constituents of storms blown to the height of the link due to dust storms. As the storms
IJSER © 2013 http://www.ijser.org
International Journal of Scientific & Engineering Research, Volume 4, Issue 4, April-2013 248
ISSN 2229-5518
are assumed to contain three constituents, the entire section is represented in the form of three layers in cascade.
Further, the layer with sand particles extends form Z = 0 to Z = L, layer with silt particles extends from Z= L1, to L2 layer with clay particles extends from Z= L2, to Z= L3. If ε and α denote the permittivity and attenuation coefficients of microwave signal of sand silt and clay, respectively, then
Z=L1
Z=L2
Z=L3
Air /vaccum Z=0
Fig 1 shows that Geometry of the layers of different dust particles.
IJSER © 2013 http://www.ijser.org
International Journal of Scientific & Engineering Research, Volume 4, Issue 4, April-2013 249
ISSN 2229-5518
1 z 0 z L1
z 2 z L1 z L 2
3 z L 2
z L3
w h e r e L L1 L 2 L3
.3 ATTENUATION MODEL FOR DUST PARTICLES:
In order to consider the attenuation behavior of the dust particles, which are considered to be dielectric spheres, the concept of energy balance over the surface of sphere surrounding the scattering volume is utilized. If E (θ, ф) and H (θ, ф) denote the electric and magnetic fields, then field equation for dust particles can be written as ;[5]
E H
P

c o s e c
P ' e i k r


R
(1)
E H
P

c o s e c
P ' e i kr


. (2)
R
Where,
P k 2 K
L
M _
1 a 2 2 b 2 2 c 2 2

P '
k 2 K '
L ' M
' _
1 a 2 2 b 2 2
c 2 2
(3)

K 2
1 F ( ) : L

1 (

.

1) 1 ( 6 a 2 b 2 c 2 ) F ( ) :
3 1 5 3

M 1 ( 1)(b 2 c 2 ) F ( )
6
(4)
K '

2 1 F '( ) : L


1 ( 1) 1 ( 6 a 2 b 2 c 2 ) F '( ) :
3 1 5 3

M 1 ( 1) (b 2 c 2 ) F '( )
6
. (5)
Where (R, θ, ф) are polar co-ordinates (α, β, γ) are direction cosines. Here Z axis is taken as the
polar axis and is defined as
α = sin θ cos ф: β = sin θ sin ф: γ = cos θ
Combining equations .3, .4 and .5 with .1 and .2
IJSER © 2013 http://www.ijser.org
International Journal of Scientific & Engineering Research, Volume 4, Issue 4, April-2013 250
ISSN 2229-5518
1 cos 1 F ( ) cos
1

2

2 6( 2 3)
eikR

E H cos
cos 2 F '( )
1
R
cos

6(2 3)
1 cos 1 F ( ) co s
1
(6)


2

2 6 (2 3)
eikR
E H
c os 2 F '( )
1

6( 2 3)
cos

cos R
(7)
For dust particles, the permittivity value is taken as μ = 1, so equation .6 and equation .7 can be written as;
E H
1

cos F ( ) cos
1

cos 2 F '( ) cos
e ikR
2
6( 2 3)

cos
R
(8)
E H
1
cos F ( ) cos
1

cos 2 F '( ) cos
eikR
2
6(2 3)

cos
R
(9)
Where F (ε) and F ‘(ε) are scattering amplitudes depending on the size of particles, different for
spherical and non-spherical particles. [6].As the problem is concerned with the flow of energy, Pontying vector must be used. In this case only the radial component of Pontying vector actually crosses the surface of the sphere. In spherical co-ordinate system, if E(θ , ф) and H(θ , ф) denote the electric and magnetic fields, then radial component of the average Pontying vector will be in the radial direction, the value of which is given as;[4]

S 1 Re( E H *
E H * )
R 2

S 1 R e ( E H *
E H * ) ( E H *
E H * )
R 2 in c
inc
inc
inc
sca
sca
sa c
sca
( E inc H * sca E inc H * sca ) ( E in c H * sca E inc H * sc a )
(10)
IJSER © 2013 http://www.ijser.org
International Journal of Scientific & Engineering Research, Volume 4, Issue 4, April-2013 251
ISSN 2229-5518
The t0otal energy scattered out of the surface of dust particles is the sum of the absorbed and scattered powers. The total extinction cross-section will be the ratio of scattered power to incident power given as; [7]
(
1 ) R e 1
R e ( E H *
E H
* ) R 2 s i n d d
e x t 2


2
. (11)
During the passage of microwave and millimeter waves through the medium containing sand and dust particles, the waves will be attenuated as consequence of two phenomena i.e., scattering and absorption. Let N(s) ds be the number of dust particles per unit volume of storm with radii in the interval s to (s + ds), s= (a, b, c). If σ be the extinction cross-section of dust particles, then total power removed from the wave with incident Pontying vector SR by dust particles in volume element of unit cross-sectional area and thickness dl is given as ;[6]

d S R
d I
S
R e x t
N ( a ) d a
(12)
Denoting the integral in the equation by σ (attenuation)
ext N ( a )da
The attenuation for spherical dust particles is ;
e x t
a 3 N
( a ) d a
(13 )
Where N is the number of particles in unit volume of storm in radii a to a+da. Similarly, for non-spherical dust particles,
e x t a b c N
( a ) d a
(14)
Where‘s’ denotes the parameter a, b and c. The number of particles N per unit volume of storm is given by Sami and Ghobrial[46]
9.43 109

N
V 4 a 3
and for non spherical dust particle
9.43 10 9

V 4 abc


3 3
(15)
Where V is the visibility, Km; a the radius of dust particle and γ = 1.07
The attenuation coefficients can be calculated using equations .8, .9, .10, .13, .14 and .15 as
IJSER © 2013 http://www.ijser.org
International Journal of Scientific & Engineering Research, Volume 4, Issue 4, April-2013 252
ISSN 2229-5518
The attenuation coefficient for spherical dust particle (sand, silt and clay particles) of microwave signal are written as ;
9.43 109
1
1


cos F ( ) cos cos 2 F '( )
V 4 a3 2
( 2)(2 3)

3
cos cos 2

R
(16)
The attenuation coefficients for non spherical dust (sand, silt and clay particles) of microwave signal is written as
9 .43 1 0 9
1
1


co s F ( ) co s co s 2 F '( )
V 4 a bc 2
( 2 )( 2 3)

3
co s cos 2

R
(16.1)
The attenuation coefficient for spherical dust particles) of microwave signal is written as ;
FOR SAND
9.43 109

sand
1
cos F ( ) cos

sand 1
sand sand 2
( sand 2)(2 sand 3)
4
3
V 3 a
cos 2 F '( )

cos cos 2
R
4.17
FOR SILT
9 .4 3 1 0 9

s i l t
1
c o s F ( ) c o s

s il t 1
s i l t s i l t 2
( s i lt 2 )( 2 s i lt 3)
4
3
V 3 a
c o s 2 F '( )
c o s c o s 2

R
(18)
FOR CLAY
IJSER © 2013 http://www.ijser.org
International Journal of Scientific & Engineering Research, Volume 4, Issue 4, April-2013 253
ISSN 2229-5518
1
1
9 .4 3 1 0 9
cl a y
c os F ( ) c o s
c la y

cla y cl a y 2

( cla y 2 )( 2 cla y 3)
4
V 3 a

3
co s 2 F '( )
c o s c o s 2

R
.(19)
The attenuation coefficient for non spherical dust particles of microwave signal is written as ;
FOR SAND
9.43 10 9

sand
1
cos F ( ) cos

sand 1
sand
sand 2
( sand 2)( 2 sand 3)
4
V

cos cos 2
R
3 abc cos 2 F '( )
. (20)
FOR SILT
9 . 4 3 1 0 9

s i l t
1
c o s
F ( ) c o s

s i l t 1
s il t
s i l t 2
( s i l t 2 ) ( 2 s il t 3 )
4
V 3 a b c c o s 2 F '( )
c o s c o s 2

R
(21)
FOR CLAY
1
1
9.43 109
clay
cos F ( ) cos
clay


2 (
2)(2
3)

clay
4
clay
clay clay
V 3 abc cos 2 F '( )
cos cos 2

R
. (22)
Therefore, the average attenuation coefficients caused by spherical dust particles of microwave signal are written as
IJSER © 2013 http://www.ijser.org
International Journal of Scientific & Engineering Research, Volume 4, Issue 4, April-2013 254
ISSN 2229-5518
av

(sp) sand silt clay
3
(.23)
Where sand is attenuation due to sand particle.
silt is attenuation due to silt particle
clay is attenuation due to clay particle
The average attenuation coefficients caused by non spherical dust particles of microwave signal are written
av

(non sp) sand silt clay 24
3
The scattering amplitude F (є) and for dust particles are calculated as [8]
a b 2
1
F ( )
K A

3 1
1 1
F '( ) K 2
a b 2
1
A
1
A
.25
3 1
1
1
1 2
Where the modified geometrical factors A1 and A2 are different for probate dust particle’s which are given as [8-9].
For probate dust particles
1 1
A1 [{ a

/ 2 b (b
a )( b
a ) } ta n { ( a
b )
a ) / a } ]
.26
4 2 2 2 2 2

1 2 2 2
1 1

2 2 2 2 2 2 2

1 2 2 2
A 2 [ a { a
b ) 1 ) / 2 b ( b
a ) ( a
b ) } t a n { ( a
b )
.27
b ) / b } ]
.4 NUMERICAL COMPUTATIONS:
In order to calculate attenuation coefficient for spherical and non spherical particles for this equation .17 to .29 .The numerical values of permittivity of dry and moist dust particles are tabulated in Table .1
S.No | Types of particle | Dielectric constant for dry particle | Dielectric constant for moist particle |
IJSER © 2013 http://www.ijser.org
International Journal of Scientific & Engineering Research, Volume 4, Issue 4, April-2013 255
ISSN 2229-5518
1 | Sand | 3.776-j0.255 | 6.786-j0.321 |
2 | Silt | 4.031-j0.214 | 8.26-j0.221 |
3 | Clay | 4.495 –j0.255 | 9.206-j0.221 |
5 RESULT AND DISCUSSION
Attenuation coefficient of microwave signal in sand and dust storm
condition for spherical and non spherical can be calculated by using equation in terms of frequency, visibility, angle of incidence and particle radii. The results are tabulated in table .2 to table .6 and their variations are shown in fig .2 to .6. The attenuation coefficient for sand, silt and clay dust particle observed in this model are similar to observation made by S. Singh et. al [1996].[8] The attenuation coefficient for spherical and non spherical can be calculated from equation .17 to equation .25 and their results are tabulated below. In order to calculate the attenuation coefficient for spherical and non spherical dust particles, the numerical value of complex permittivity are taken as 3.776-j0.255 for dry sand, 6.786-j0.321 for moist sand particles, 4.031-j0.214 for dry silt particles, 8.26-j0.221 for moist silt particles, 4.495-j0.255 for dry clay particles, 9.26-j0.221 for moist clay particle respectively. It is observed the attenuation coefficient (dB) is calculated with respect to frequency as well as visibility. The frequency varies from 30 GHz to 140 GHz and visibilities from 0.001 Km 1 Km.
Table : 2 Variation of Attenuation coefficient (dB) for spherical particles with frequency at visibility 0.1 Km
Sr. No. | Freq (GHz) | PRESENT STUDY | SINGH STUDY et.al (1996) |
Sr. No. | Freq (GHz) | Attenuation coefficients (dB) at visibility 0.1 Km | Attenuation coefficients (dB) at visibility 0.1 Km |
Sr. No. | Freq (GHz) | Sand | Silt | Clay | Sand | Silt | Clay |
01 | 30 | 1.31 | 1.42 | 1.51 | 1.73 | 1.92 | 2.31 |
02 | 60 | 2.12 | 2.32 | 2.51 | 2.33 | 2.38 | 2.42 |
03 | 90 | 2.98 | 3.12 | 3.34 | 3.21 | 3.9 | 4.12 |
04 | 120 | 3.53 | 4.12 | 5.63 | 3.73 | 4.12 | 4.33 |
05 | 140 | 3.97 | 4.33 | 5.12 | 3.83 | 4.53 | 4.77 |
IJSER © 2013 http://www.ijser.org
International Journal of Scientific & Engineering Research, Volume 4, Issue 4, April-2013 256
ISSN 2229-5518
Table : .3 Variation of Attenuation coefficient (dB) for non-spherical particles with frequency at visibility 0.1 Km
Sr. No . | Frequ ency (GHz) | PRESENT STUDY | SINGH STUDY et .al (1996) |
Sr. No . | Frequ ency (GHz) | Attenuation coefficients (dB) at visibility 0.1 Km | Attenuation coefficients (dB) at visibility 0.1 Km |
Sr. No . | Frequ ency (GHz) | Sand | Silt | Clay | Sand | Silt | Clay |
01 | 30 | 1.41 | 1.62 | 1.64 | 1.93 | 2.12 | 2.51 |
02 | 60 | 2.22 | 2.52 | 2.53 | 2.53 | 2.58 | 2.62 |
03 | 90 | 3.01 | 3.22 | 3.54 | 3.41 | 4.09 | 4.32 |
04 | 120 | 3.63 | 4.22 | 4.83 | 3.93 | 4.32 | 4.53 |
05 | 140 | 4.07 | 4.53 | 5.32 | 4.17 | 4.73 | 4.93 |
Table : 4
Variation of Attenuation coefficient (dB) for spherical and non-spherical particles with visibility in different frequencies.
Sr. No. | Visibility Km | Attenuation coefficients for spherical particle (dB) | Attenuation coefficients for non- spherical particle (dB) |
Sr. No. | Visibility Km | 40 GHz | 60 GHz | 80 GHz | 40 GHz | 60 GHz | 80 GHz |
01 | 0.001 | 3.98 | 4.31 | 4.51 | 4.12 | 4.27 | 4.97 |
02 | 0.01 | 3.23 | 4.23 | 4.32 | 3.96 | 4.19 | 4.89 |
03 | 0.1 | 2.64 | 3.72 | 4.13 | 3.2 | 4.08 | 4.68 |
04 | 1 | 2.03 | 2.98 | 3.4 | 2.5 | 2.5 | 4.09 |
TABLE 5
Variation of Attenuation coefficient (dB) with particle size for spherical and non-spherical particles at visibility at 0.1K.M. at 40 GHz in case of sand, silt, clay particles.
Sr. No. | Particle size (mm.) | Attenuation coefficients for spherical particle (dB) | Attenuation Coefficients for non- spherical particle (dB) |
Sr. No. | | Sand | Silt | Clay | Sand | Silt | Clay |
01 | 0.1 | 0.7 | 1.1 | 1.32 | 0.9 | 1.21 | 1.4 |
02 | 0.2 | 1.33 | 1.5 | 1.68 | 1.47 | 1.58 | 1.7 |
03 | 0.3 | 1.47 | 1.89 | 2.32 | 1.69 | 2.01 | 2.7 |
04 | 0.4 | 1.76 | 2.21 | 2.51 | 2.01 | 2.42 | 2.9 |
IJSER © 2013 http://www.ijser.org
International Journal of Scientific & Engineering Research, Volume 4, Issue 4, April-2013 257
ISSN 2229-5518
Table : .6
Variation of Attenuation coefficient (dB) for spherical and non-spherical particles with angle of incidence in degree.
80 GHz
3.48
3.01
2.64
2.33
6
5
4
3
2
1
0
30 60 90 120 140
Frequency in GHz

Sand Slit Clay
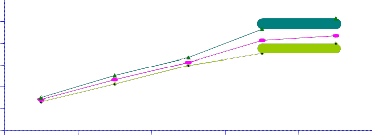
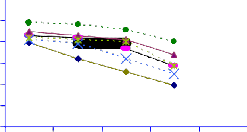
Fig 2 Variation of Attenuation coefficient for spherical dust particle (sand, silt and clay) with frequency at visibility at 0.1
Km
.
(NOTE -Bold line shows spherical particle
Dashed line shows that non spherical particle).
IJSER © 2013 http://www.ijser.org
International Journal of Scientific & Engineering Research, Volume 4, Issue 4, April-2013 258
ISSN 2229-5518
6
5
4
3
2
1
0
30 60 90 120 140
Fr eque ncy in GHz

Sand Slit Clay
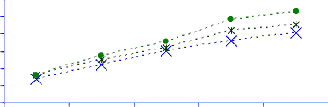
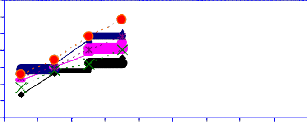
Fig .3 Variation of Attenuation Coefficient for non spherical dust particle (sand silt and clay)
with frequency at visibility at 0.1 Km.
6
5
4
3
2
1
0

0.001 0.01 0.1 1
Visibility in Km
FOR 40GHz
60 GHz
80 GHz
40 GHz
60 GHz
80 GHz
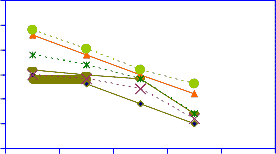
Fig .4 Variation of Attenuation Coefficient with visibility in Km at different frequencies.
3.5
3
2.5
2
1.5
1
0.5
0
0.1 0.2 0.3 0.4
Par ticle r adii in m m
Sand Silt Clay Sand Silt Clay
Fig .5 Variation of Attenuation Coefficient with particle radii in mm for different particle.
IJSER © 2013 http://www.ijser.org
International Journal of Scientific & Engineering Research, Volume 4, Issue 4, April-2013 259
ISSN 2229-5518
3
2.5
2
1.5
1
0.5
0
30 60 75 90
Angle of incide nce in de gre e
For 40 GHz
60GHz
80GHz
40GHz
60GHz
80GHz
Fig 6 Variation of Attenuation Coefficient with angle of incidence in degree at different frequencies.
From above discussion it is concluded that attenuation coefficient of microwave signal depend upon frequency, visibility, and particle radii. Attenuation coefficient of microwave signal increases with frequency due to increase in, for zero visibility the medium is almost completely packed with sand, dust particles. Any lossy dielectric medium will have a complex permittivity

ε * = ε (1-jσ /ω ε) .
The imaginary part of which is function of conductivity and frequency. There are two types of loss which attenuate the wave in addition to the loss of reflection loss. First conductivity of the dielectric contributes to the loss of energy in form of heat. Secondly the dipoles created due to polarization process experience certain amount of friction (damping force) when they flip back and forth in alternating an electromagnetic field. Consequently these dipoles extract energy from the impressed field which is dissipated in form of heat. Since the losses due to dielectric conductivity and polarization damping force in form of heat it is logical to represent the two losses in terms of conductivity. These equation shows increasing frequency enhance conductivity and loss tangent of the medium. These in turn raise the effective absorption loss with reflection in the reflection in the system. Thus absorption loss increases with frequency. It may concluded that it may, therefore be concluded that it is the polarization damping force that predominately controls the loss in the medium, when frequency of the propagating signal is increased. The attenuation coefficient of microwave signal increases with particle radii and decreases with increases with visibilities and increases with angle of incidence according to Brewster’s Phenomena. Attenuation coefficients for Non-spherical dust particle are large value than spherical dust particle. Therefore it can be predicted that non-spherical dust particle passes higher value of attenuation than spherical dust particle. Clay particle passes large dielectric constant in comparison to sand and silt particle.
IJSER © 2013 http://www.ijser.org
International Journal of Scientific & Engineering Research, Volume 4, Issue 4, April-2013 260
ISSN 2229-5518
Acknowledgement Authors thank to Dr S K srivastav guide of her Ph.D thesis and HOD of
Govt PG COOLEGE for his valuable guidance and discussions.
References:
1. Srivastava S. K, B .R Vishwakarma B.R and Saxena R. K, ‘Transmission Line Model for
Loss Evaluation in Sand and Dust Storms. ‘Journal of the Institution of Engineers (India), Vol
81, /1, 2000, Page no. 11.
2. Srivastava S.K and Vishwakarma B.R ‘Cross-polarization and Attenuation of Microwave/Millimeter wave in a Microwave Terrestrial Link Containing Sand, Silt and Clay as Dust constituents. ‘Journal of the Institution of Engineer (India), Vol 84, 2003. Page No.
42.
3. Srivastava S.K and Vishwakarma B.R. ‘Depolarization of Microwave/ Millimeter wave Back scattered by Dust constituents.’ AMSE International Journal of Modeling and Simulation, France, Vol 75, (no 1 and 2) 2002, Page No 10.
4 Srivastava .S. K and Vishwakarma B. R. ‘Depolarization of Microwave/ Millimeter wave in
Sand and Dust Storm.’ IETE journal of Research, Vol 48,( no 2), 2002, Page No. 133.
5 Straton . J .A, ‘Electromagnetic Theory.’ McGraw Hill, New York, 1941-1955, Page No.
568.
6. Srivastava .S .K and Vishwakarma .B .R. ‘Polarization and Attenuation of Microwave
Signal in Sand and Dust StormProceedings of Microwave 2001, National Symposium on
Antenna and Propagation, November 2-4, 2001
7. Singh.S, Rai. C. S and Vishwakarma. B. R. ‘Millimeter Wave Attenuation in Storm Layer with Spherical and Non- spherical dust Particles. ‘Journal of the Institution of Engineers (India), Vol 76,1996 Page No. 59.
8. Ghobrial .S.I and Sami. M .Sarief. ‘Microwave Attenuation and Cross-polarization in Dust storms. IEEE Transactions on Antenna and Propagation, USA, AP 35, 1987, Page No. 416.
9. Singh. S, Rai. C .S and Vishwakarma .B. R. ‘Millimeter Wave Attenuation in Storm Layer with Spherical and Non-spherical dust Particles.’ Journal of IE (t), Vol 76, ET, 1996. Page No. 59 .
Authors
Dr. Megha Persai Bhatt presently, worked in Agriculture university, Raipur, CG, India, as visiting faculty, Astt . Professor in LNCT –S Engg . College, Bhopal MP, India. She has done
his Ph.D in GuruGhasi Das Central university, Bilaspur, CG, under Dr. S.K Srivastav, HOD of
Physics Deptt, Ambikapur , CG under topic Study of effect of microwave signal under dust
IJSER © 2013 http://www.ijser.org
International Journal of Scientific & Engineering Research, Volume 4, Issue 4, April-2013 261
ISSN 2229-5518
storm condition and Remote Sensing 0 0 She is also Gold Medalist in MSc 20077 from PT OR S U , University, Raipur CG
IJSER <S> 2013 http/fwww I!Ser org