International Journal of Scientific & Engineering Research, Volume 6, Issue 1, January-2015 2106
ISSN 2229-5518
Manjul Mayank Pandey (Assistant Director, Directorateof Census Operations, Bihar, Patna).
&
Dr Rupam Tiwari (Assistant Professor, in Don Bosco Institute of Management & Research, Mumbai).
&
Dr Anupama Choubey, (Assistant professor of the Institute of leadership and entrepreneurship Development, Kolkota).
![]()
Abstract
In population dynamics we study short term and long term changes in the size and age composition of the popu- lation and the biological and environmental processes influencing those changes. It is the study of how popula- tion changes over time. In this research paper, author is concerned about human population dynamics in India. The composition of the population, including birth and death rates, immigration, emigration and age and sex composition are the main components of population dynamics. Birth rate, Death rate, Immigration and Emigra- tion are the four primary ecological events that influence the size of a population.
Birth and death rates are the most important determinants of population growth; in some countries net migration
is also important in this regards .Until the mid-19th century birth rates were slightly higher than death rates, so the human population grew very slowly. After mid-19th century, industrialization altered population growth rates, very sharply and its main component was agricultural mechanization, which increased agricultural productivity. As food supplies expanded, average level of nourishment rose and vulnerability to chronic and
contagious disease declined over succeeding generations. Improvements in medical facilities and public health services also helped to people to live longer, so death rates fell and life expectancy increased. After several dec- ades of lower death rates, specially declining infant and child mortality and improvement in women literacy rate helped to decline fertility, effectively population momentum resulting in a baby boom. This phased reduction in death and birth rates is a process called the demographic transition, which affects population growth rates in dif- ferent stages, differently. Population momentum (continued population growth after a fall in birth rates) ac- counts for a significant portion of population growth. Even though fertility rates declined. Developed nations have passed through the demographic transition and developing counties (like India) are at some point in the process. As a result, a “bulge” or baby boom, generation distinctly larger than those preceding or following it, is moving through the age structure of population. These large cohorts create both opportunities and challenges for society. As this cohort moves into working age group; it will be potentially higher share of workers as compared with dependent population. If working ages population can be productively employed according to their age structure with skilled development, economic growth of India will be accelerated. They also can strain available resources and services, which in turn may cause shortages and economic disruption. Failure to take advantage of the opportunities inherent in demographic change can lead to economic stagnation.
Index Terms: Population Dynamics, Age composition, Birth rates, Death rates, Total Fertility rates(TFR), Age Specific Fertility rates (ASFR), Immigration and Emigration, Chronic disease, Baby boom, Demographic transi- tion, Population momentum, Cohorts, Policy reform, Boom, Bust, logistic curve, Economic dividend, Fecundi-
ty, Dependency ratio, Life expectancy and Replacement level.
Introduction
—————————— ——————————
IJSER © 2015 http://www.ijser.org
International Journal of Scientific & Engineering Research, Volume 6, Issue 1, January-2015 2107
ISSN 2229-5518
Population is a group of individuals (all members of a single species) who live together in the same habitat and are likely to interbreed. Each population has a unique physical distribution in time and space. It may contain individuals of different ages and its size is likely to change over time, growing or shrinking according to the re- productive success of its members.
Population dynamics is a dominant branch of mathematical biology, which has its history of more than 200
years, while more recently the scope of mathematical biology has greatly expanded. In population dynamics we study short term and long term changes in the size and age composition of the population and the biological and environmental processes influencing those changes. It is the study of how population changes over time. Popu- lation dynamics overlap with other branches of research in mathematical biology, viz. mathematical epidemiol- ogy, the study of infectious disease affecting population. In last few decades Population dynamics has been complemented by evolutionary game theory, which was first developed by John Maynard Smith.
A population model is a type of mathematical model that is applied to the study of population dynamics. Models allow a better understanding of how complex interactions and processes work.
In this research paper, author is concerned about human population dynamics in India. One of the common
mathematical models for Population dynamics is exponential growth model. The first principle of Population dynamics is widely regarded as the exponential law of Malthus, as modeled by the Malthusian growth model. In nineteen century, Benjamin Gompertz and Pierre Francois Verhults, refined and adjusted the Malthusian demo- graphic model. A more general demographic model formulation was proposed by F.J.Richards in 1959, further expanded by Simon Hopkins, in which the population models of Ludwig Von Bertalanffy, Gompertz and Ver- hulst are considered as a special case of general formula.
When food is abundant and growing conditions are favorable, a population has the potential to increase in num-
ber from generation to generation. The population’s intrinsic growth rate ("r") is said to be geometric when each generation's increase is a constant percentage of the total population size. Geometric growth is also known as exponential growth.
As population size approaches the carrying capacity, competition becomes more intense, mortality increases, the
birth rate drops, and any one of the following alternatives is possible:
1. The population may level out and stabilize below the carrying capacity. This pattern is known as a logistic or sigmoid (S-shape) growth curve.
2. The population may briefly overshoot the carrying capacity and then crash, resulting in repeated cycles of
"boom" and "bust".
3. The population may oscillate around (or below) the carrying capacity.
In reality, all of these models are gross over-simplifications. Natural populations respond to a wide range of en- vironmental conditions that are rarely constant over time. Countries passing through transition phase follow lo- gistic growth curve which is briefly discussed below.
Logistic function.
IJSER © 2015 http://www.ijser.org
International Journal of Scientific & Engineering Research, Volume 6, Issue 1, January-2015 2108
ISSN 2229-5518
( Logistic mo del of populatio n growth)
For the recurrence relation, see Logistic map.

Standard logistic sigmoid function
A logistic function or logistic curve is a common "S" shape (sig mo id curve), with equation:
![]()
Where‘e’ is the natural logarithm base. For values of x in the range of real numbers from −∞ to +∞, the S-curve shown on the right is obtained.
A typical application of the logistic equation is a common model of population growth, originally due to Pierre- François Verhulst in 1838, where the rate of reproduction is proportional to both the existing population and the amount of available resources, all else being equal.
In this research paper, author reviews the size, growth, and structure of India’s population in historic and com- parative perspective. It focuses on features of India’s demography that have been, and will likely be, relevant to economic growth and the improvement of living standards and life expectancy. In this research paper, Census and SRS data for fertility, mortality, migration, age and sex structure are analyzed in population dynamics of India. It reviews theoretical and empirical literature on the demographic Changes and its effect on economic growth and explores the application of the models and results to understanding and forecasting population growth in India.
* Biologically prime child bearing age group is (15-49) years, while resource constraints, social, political and economic factors affect childbearing decisions differently from state to state and country to country.
*Infant and child mortality and old age mortality (above 60 years) are relatively high in comparison to rest of the population.
On basis of these facts demographers may develop an accurate picture of how a society’s population size, births, deaths and age structure are likely to evolve in the next several decades.
Population Growth.
IJSER © 2015 http://www.ijser.org
International Journal of Scientific & Engineering Research, Volume 6, Issue 1, January-2015 2109
ISSN 2229-5518
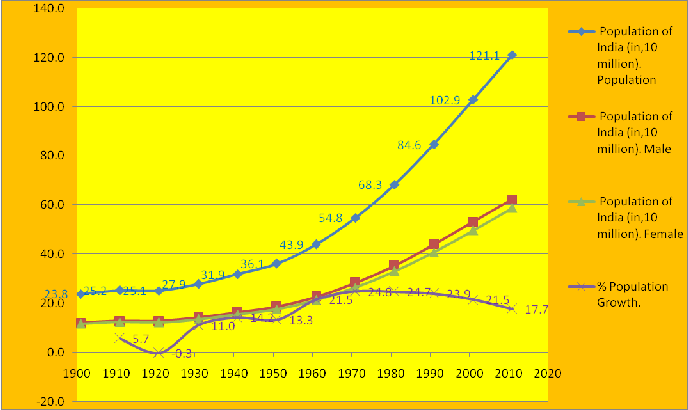
Basic population growth trend is based on decadal Censuses of India.
Population of India (in,10 million). | ||||
Year | Population | Male | Female | % Population Growth. |
1901 | 23.8 | 12.1 | 11.7 | |
1911 | 25.2 | 12.8 | 12.4 | 5.7 |
1921 | 25.1 | 12.9 | 12.3 | -0.3 |
1931 | 27.9 | 14.3 | 13.6 | 11.0 |
1941 | 31.9 | 16.4 | 15.5 | 14.2 |
1951 | 36.1 | 18.6 | 17.6 | 13.3 |
1961 | 43.9 | 22.6 | 21.3 | 21.5 |
1971 | 54.8 | 28.4 | 26.4 | 24.8 |
1981 | 68.3 | 35.3 | 33.0 | 24.7 |
1991 | 84.6 | 43.9 | 40.7 | 23.9 |
2001 | 102.9 | 53.2 | 49.7 | 21.5 |
2011 | 121.1 | 62.3 | 58.8 | 17.7 |
Uttar Pradesh Population (in, 10 million).
![]()
IJSER © 2015 http://www.ijser.org
International Journal of Scientific & Engineering Research, Volume 6, Issue 1, January-2015 2110
ISSN 2229-5518
Year | Population | Male | Female | % Population Growth. |
1901 | 46.6 | 24.1 | 22.6 | --- |
1911 | 46.0 | 24.0 | 22.0 | -1.36 |
1921 | 44.6 | 23.3 | 21.2 | -3.16 |
1931 | 47.5 | 24.9 | 22.5 | 6.56 |
1941 | 53.9 | 28.3 | 25.7 | 13.57 |
1951 | 60.3 | 31.6 | 28.7 | 11.78 |
1961 | 70.1 | 36.8 | 33.4 | 16.38 |
1971 | 83.8 | 44.7 | 39.1 | 19.54 |
1981 | 105.1 | 55.9 | 49.3 | 25.39 |
1991 | 132.1 | 70.4 | 61.7 | 25.61 |
2001 | 166.2 | 87.6 | 78.6 | 25.85 |
2011 | 199.8 | 104.5 | 95.3 | 20.23 |
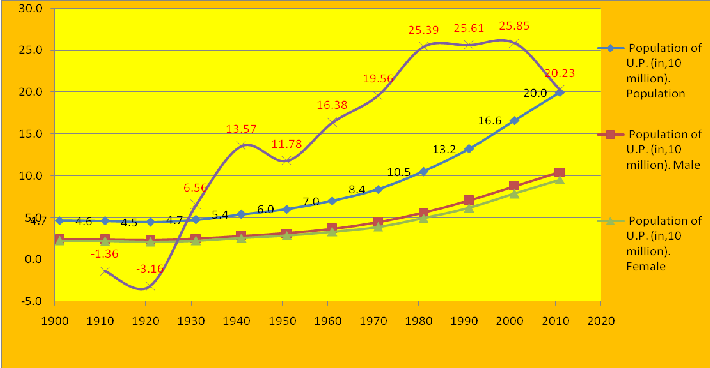
Population growth of India in decade, 1911 to 1921declined by -0.3% while in a major state, Uttar Pradesh, it was -3.16%. During 1921 to 1981, population growth of the country increased, except in 1941 to
1951.Population growth of the country in period 1981 to 2011 declined with very slow rate.
Population growth of U.P.in 1981 to 2001 was almost constant. But in last decade 2001 to 2011, it was sharply declined 25.85% to 20.23%.
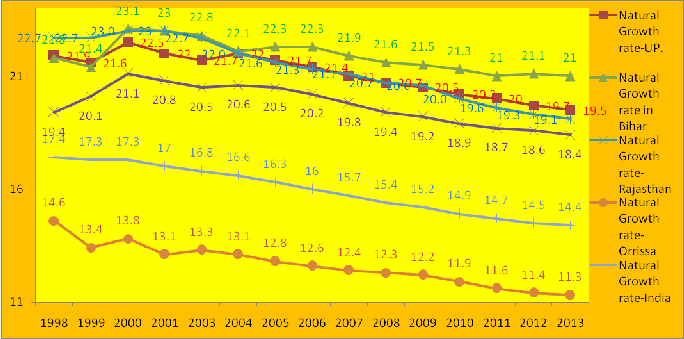
Population of the India is currently growing at a rate of 1.44% per year, far surpassing China’s rate of 0.7%. This difference will result in India’s population size overtaking China's in less than 20 years. Differences in growth rate of southern Indian states and empowered action group (EAG) states, especially major states, Bihar, Madhya Pradesh, Rajasthan, Uttar Pradesh and Orissa are responsible for high growth rate (1.44% per year) of the country. Following graph shows natural growth rate of the six southern Indian states along with growth rate of India.
IJSER © 2015 http://www.ijser.org
International Journal of Scientific & Engineering Research, Volume 6, Issue 1, January-2015 2111
ISSN 2229-5518
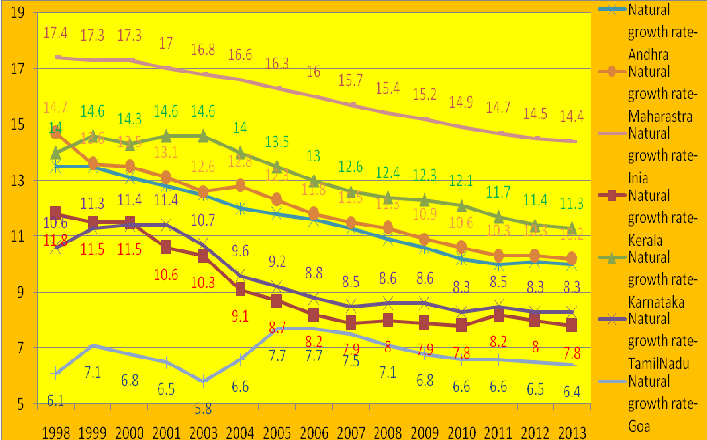
Above graph clearly shows, that natural growth rate of the six southern states (viz. Andhra Pradesh, Goa, Kar- nataka, Kerala, Maharashtra and Tamil Nadu) are lower than growth rate of India. These states have already at- tained the goal of replacement level (TFR, 2.1) before the 2010 deadline. On the other hand, natural growth rate of the EAG states, are responsible for high growth rate (1.44% per year) of the country. On the other hand natu- ral growth rate of the empowered action group (EAG) states are higher than natural growth rate of the India, except Orissa. Natural growth rate of the U.P., Bihar, M.P. and Rajasthan are alarming.
IJSER © 2015 http://www.ijser.org
International Journal of Scientific & Engineering Research, Volume 6, Issue 1, January-2015 2112
ISSN 2229-5518
In 1952, India was the first country in the world to launch a national programme, emphasizing family planning to the extent necessary for reducing birth rates “to stabilize the population at a level consistent with the re- quirement of national economy. After1952, sharp declines in death rates were however not accompanied by similar drop in birth rates. The National health policy 1983 stated that replacement level of total fertility rate (TFR, 2.1) should be achieved by the year 2000. On May 2000 India was projected to have 1 billion (100 crore) people i.e. 16% of world population on 2.4% of global land area. As per 2001 Census, population of India was
enumerated 1027 million on 31st march 2001, and country was observed in the middle of demographic transi-
tion. A lag in decline in fertility in relation to mortality has resulted in the sizeable growth of India’s population so for which will continue in the coming several decades. Decline in population growth process has been wit- nessed since 1980. The National population policy (NPP) -2000 documents clearly stated that population growth in India continues to be high on account of demographic momentum (estimated contribution 58%), higher unwanted fertility due to unmet need of contraception (estimated contribution 20%). India is at some point of demographic transition. As a result, a “bulge” or baby boom, generation distinctly larger than those preceding or following it, is moving through the age structure of population. These large cohorts create both op- portunities and challenges for society. As this cohort moves into working age group; it will be potentially higher share of workers as compared with dependent population. If current trend is continued, India may overtake Chi- na in2045 to the most populous country of the world. While global population has increased three times during this century from 2 billion to 6 billion. The population of India has increased nearly five times from 238 million (23 crores) to 1 billion in the same period. India’s current annual increase in population of 15.5 million is large enough to neutralize efforts to conserve the resource endowment and environment.
The population dynamics includes birth rates, death rates, immigration, and emigration age and sex composi- tion. Birth and death rates, immigration and emigration are the four primary ecological events that influence the size of a population. This relationship can be expressed in a simple equation:
IJSER © 2015 http://www.ijser.org
International Journal of Scientific & Engineering Research, Volume 6, Issue 1, January-2015 2113
ISSN 2229-5518
Birth and death rates are the most important determinants of population growth; in some countries net migration is also important. Until the mid-19th century birth rates were slightly higher than death rates, so the human pop- ulation grew very slowly. Demographic profiles of the Indian states vary from region to region and state to state. Thus, heterogeneity in demographic profiles of the Indian states affects its population composition. Heterogene- ity in demographic profiles of the six southern states (Andhra Pradesh, Karnataka, Kerala, Tamil Nadu, Maha- rashtra and Goa) and eight empowered action group (EAG) states (viz. Rajasthan, Uttar Pradesh, Uttarakhand, Bihar, Jharkhand, Madhya Pradesh, Chhattisgarh and Orissa) are very significant.
Fertility and mortality trend, infant mortality and natural growth rate of India since 1995 to 2013, based on SRS data is given in following graph.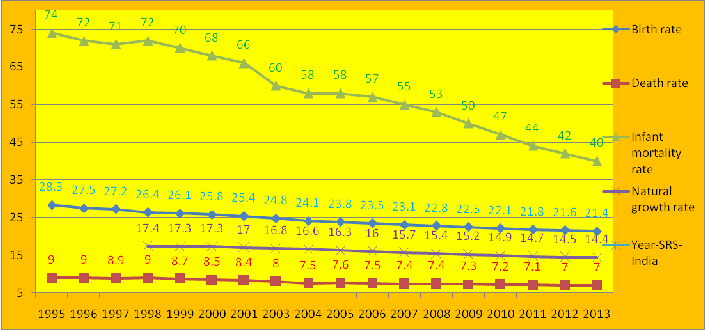
After six decades, formulating the national family welfare programme, India has:
• Reduced CBR from 40.8 (1951) to 28.3 (1995) and 21.4 (2013, SRS bulletin). The maximum
CBR has been reported in respect of Bihar (27.7) and the minimum in respect of Kerala
(14.9), as per 2013, SRS bulletin.
• The CDR for the country has declined to 7.0 in 2012 and 2013 from 7.1 in 2011.The maximum
CDR has been reported for Orissa (8.5) and minimum for Delhi (4.2).
• IMR from 146 per 1000 live births (1951) to74 per 1000 live births (1995 SRS bulletin) and 40 (2013, SRS bulletin). The maximum IMR has been observed in Madhya Pradesh (56) and the minimum in Kerala (12).
• In 1950, life expectancy in India (31 years) was less than half that in the US (68 years). But by 2005, life expectancy in India (64 years) was not far behind the US (77 years). In 2012, life expectancy at birth for
women was 67.7 years, for men it stood at 64.6 years.
IJSER © 2015 http://www.ijser.org
Internatio nal Jo urnal of Scientific & Engineering Research, Volume 6, Issue 1, January-2015
ISSN 2229-5518
2114
33.5
34
32
32.8
32.4 32.1 32.1
3 {}.&---:;-
- Birth rate UP.
. 30.4 30.1 Birth rate
29.5 1.9
?8 7
. B'h
n r
30
28.3
28 27 ·5 27.2
q
26 7T'J
. 28.3 27.8
26.4 26.1 L'9.0 28.6 28 3
25.8 25.4 . 27.9 n...s_
24.8 :n."t- 26 7
1 1 a
27.4 27.2 - Birth rate
M P
Birth rate
24.1 23.8 23.5
24
22
. 26 .2 25.9
23.1_., 2 8 25.6
L , 22 5
0 22.1 21.8 21.6 21.4
Rajasthan
Birth rate Orrissa
20
18
199519961997199819992000200120032004200520062007200820092010201120122013
Birth rate India
12
- Death rate
UP.
11
Death rate in Bihar
10
Death rate Rajasthan
9
Death rate Orrissa
8
--Death rate India
7
- Death rate-
6.6 6.7 6.7 6.6 6.5 MP
6
1995 1996 1997 1998 1999 2000 2001 2003 2004 2005 2006 2007 2008 2009 2010 2011 2012 2013
1 --G ER IS) 2015
International Journal of Scientific & Engineering Research, Volume 6, Issue 1, January-2015 2115
ISSN 2229-5518
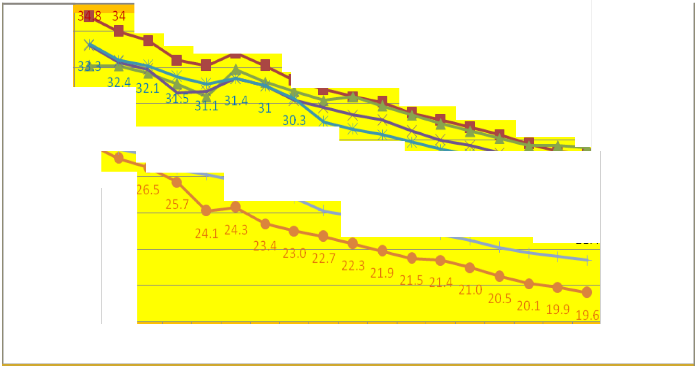
From above graphs, it is very clear that birth rates in EAG states are higher than average birth rate of the coun- try, except Orissa. Similarly, death rates of EAG (BIMARU) states are higher than the county’s average death rate, 7.0, in 2012 & 2013, except Rajasthan. Among EAG states, Bihar drastically improved its death rate since
2000 and in 2008, it attained death rate below the death rate of India. Another important Demographic indicator,
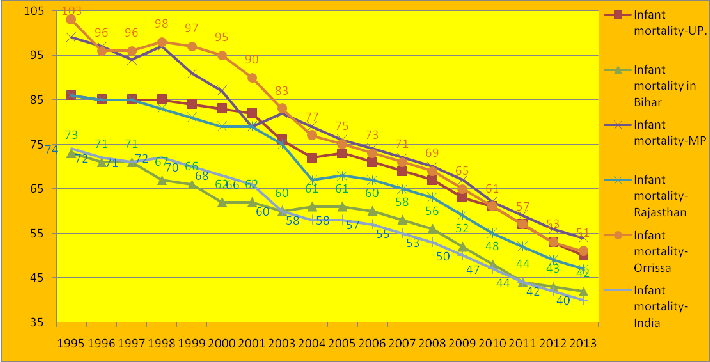
infant mortality rate (IMR) of EAG states, are higher than country’s IMR. Bihar also improved its infant mortal- ity rate (IMR) from 72(in 1995) to 42 in 2013.
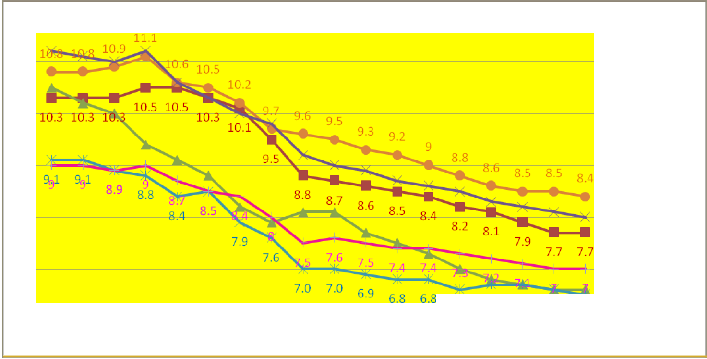
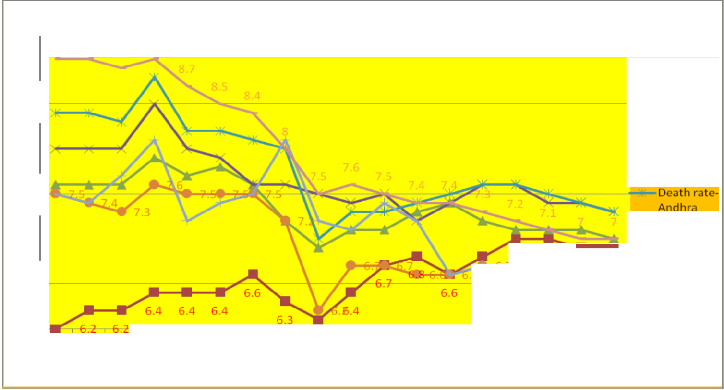
Demographic profiles of the six southern states.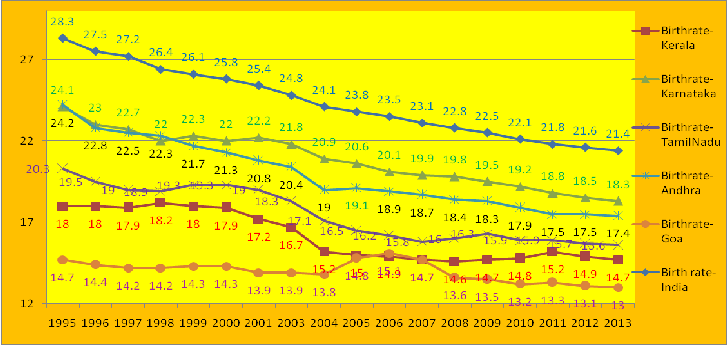
IJSER © 2015 http://www.ijser.org
Internatio nal Jo urnal of Scientific & Engineering Research, Volume 6, Issue 1, January-2015
ISSN 2229-5518
9.5
Year
2116
- Death rate Kerala
8.5 Death rate Karnataka
- Death rate Tami Nadu
7.5
6.5
Death rate
7 7 Maharastra
Death rate
H Goa
Death rate-
6.1 lnia
19115 1996 1997 1998 1999 2000 2001 2003 2004 2005 2006 2007 2008 2009 2010 2011 2012 2013

5.5
80
- IMR-
75 Keral
70 a
IMR-
65 Karna
60 taka
- IMR-
55
Tamil
50 Nadu
45 IMR- Andh
40 a
35 IMR- Maha
30
rastra
25 IMR-
20 1 Goa
;j IMR-
10
5 11 11
13 12 12 12 12 12
India
1995 1996 1997 1998 1999 2000 2001 2003 2004 2005 2006 2007 2008 2009 2010 2011 2012 2013
From above graph, it is clear that Birth rate, Death rate, IMR of all six southern states is lower than that of the
India, except death rates of the Andhra Pradesh and Tamil Nadu since 2008.
In general, fertility in urban areas is lower as compared to rural areas, in India and also in its states. Spacing be- tween children, age of marriage, education, and better healthcare, widespread acceptance of family planning
1 -.GER IS) 2015
International Journal of Scientific & Engineering Research, Volume 6, Issue 1, January-2015 2117
ISSN 2229-5518
measures like vasectomy and tubectomy and socio-economic conditions are the main factors behind this pro- gress”. However, early marriages and negligence of birth control measures in other populous states keep India's fertility rate alarmingly high. States like Uttar Pradesh, Bihar and Madhya Pradesh will need at least 15-20 years to achieve this goal.
The most populous state Uttar Pradesh is most concern to stabilize population. National Commission of India, on Population estimates projected population of Uttar Pradesh alone, will be 22% of India’s population by 2026, while Bihar, Rajasthan and Madhya Pradesh together will account for 22%. The four southern states of Andhra Pradesh, Karnataka, Kerala and Tamil Nadu will account for only 13%. In comparison to the southern states, fertility has been significantly higher in the EAG states. Fertility has also begun to fall in the large in northern states mainly after 1986, but it was still relatively high in this region.TFR in UP and MP were 4.8 and 4.0, re- spectively in 2000.
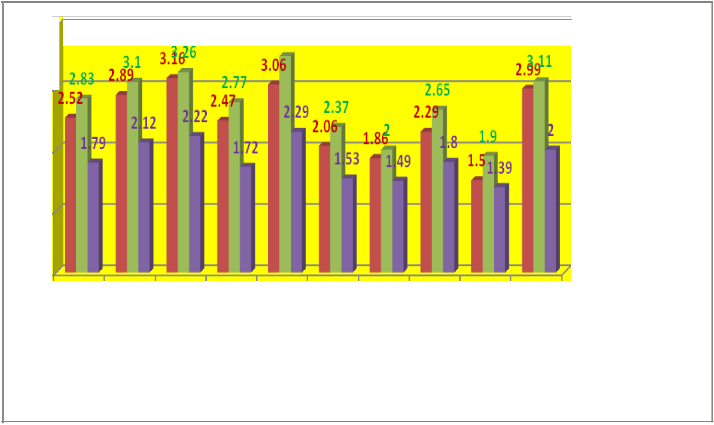
Fertility patterns widely vary within country. Racial and ethnic minorities have higher fertility rates than the majority, and families with low incomes or low levels of education typically have more children than those, who are affluent or well-educated.TFR for Scheduled Castes, Scheduled Tribes and Muslims are higher than all population in India. In rural areas TFR for all social groups are higher than urban areas. Women who work out-
side the home generally have fewer children than those who stay in home.
Total fertility rates by residence and social group-India : 2001 | |||||
Social group | Total | Rural | Urban | ||
All population | 2.52 | 2.83 | 1.79 | ||
Scheduled Castes | 2.89 | 3.1 | 2.12 | ||
Scheduled Tribes | 3.16 | 3.26 | 2.22 | ||
Hindu | 2.47 | 2.77 | 1.72 | ||
Muslim | 3.06 | 3.52 | 2.29 | ||
Christian | 2.06 | 2.37 | 1.53 | ||
Sikh | 1.86 | 2 | 1.49 | ||
Buddhist | 2.29 | 2.65 | 1.8 | ||
Jain | 1.5 | 1.9 | 1.39 | ||
Other R.C. | 2.99 | 3.11 | 2 |
IJSER © 2015 http://www.ijser.org
Internatio nal Jo urnal of Scientific & Engineering Research, Volume 6, Issue 1, January-2015
ISSN 2229-5518
2118
4 3.52
3
I Total fertili ty rates by residence and socialgroup-India :
2001TFR Total
2
1
0
e,r, e," 0 iS- - - - - (.,·
Total fertili ty rates by residence and socialgroup-India :
2001TFR Rural
0 § 'lj C.," o/ - I Total fertili ty rates
'lj c.,"r>
01\.
f " "' 0 \ t
0 e, e,
I(J
<().s
ovI(J
by residence and
socialgroup-India :
c., c.<, I 2001TFR Urban
4
3.5
3
2.5
2
1.5
1
3.52
Total fertility rates by residence and socialgroup India : 2001TFR Total
- Total fertility
rates by residence and socialgroup India : 2001TFR Rural
Total fertility
rates by residence and socialgroup India : 2001TFR
Urban
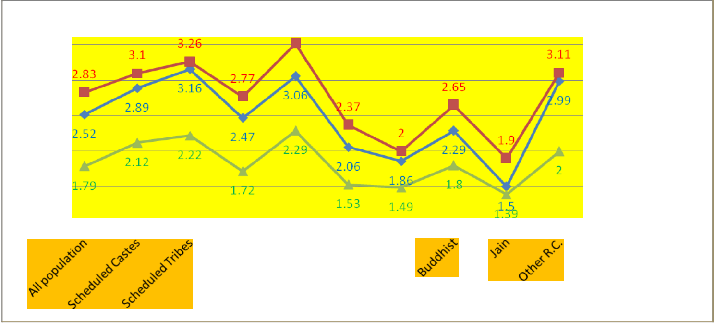
From above graph, it is very clear that TFR, in Muslim is highest and lowest in Jain communities, in rural as well as in urban areas. As per 2001 Census, Jain, Sikhs and Christians have already at tained replacement level (TFR 2.1). In urban areas of India, all population on average, Hindus, Christian, Sikh, Buddhist, Jain and other R.C. have already attained replacement level.
In India, fertility declined in term of TFR from 5.2 in 1971 to 2.9 in 2001 and 2.4 in 2012 & 2013 with varying pace in rural and urban areas of India and in different states. In 2012, TFR has been declined by 0.3 points at the National level. This decline in rural and urban areas has been observed,
1 --GER IS)2015
International Journal of Scientific & Engineering Research, Volume 6, Issue 1, January-2015 2119
ISSN 2229-5518
0.4 and 0.2 points, respectively, (SRS report). Projected TFR of India and its states are shown in fol- lowing graph.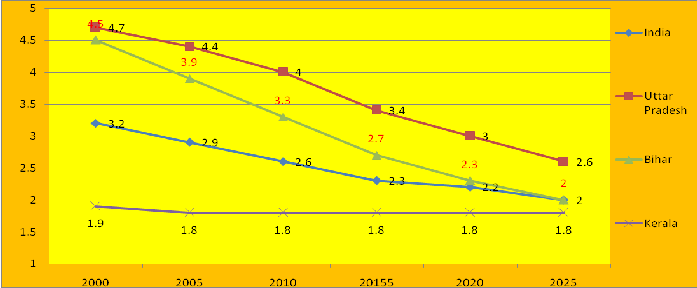
According to a recently-released health ministry report, 11 states (viz. Andhra Pradesh, Delhi, Goa, Himachal Pradesh, Karnataka, Kerala, Maharashtra, Punjab, Sikkim, Tamil Nadu and West Bengal) and three union terri- tories (Chandigarh, Pondicherry and Andaman and Nicobar Islands.) have attained the goal of replacement level (TFR, 2.1) before the 2010 deadline.
As per executive summary report 2012 of SRS, Total Fertility Rate (TFR) for the country is stable to 2.4 in 2011 and 2012. During 2012, Bihar has reported the highest TFR (3.5) while Himachal Pradesh, Punjab, Tamil Nadu & West Bengal has reported the lowest TFR (1.7). It is noteworthy that the replacement level of TFR, viz 2.1, has been attained by Andhra Pradesh (1.8), Delhi (1.8), Himachal Pradesh (1.7), Jammu & Kashmir (1.9), Karnataka (1.9), Kerala (1.8), Maharashtra (1.8), Punjab (1.7), Tamil Nadu (1.7), West Bengal (1.7) & Orissa (2.1).
ASFR OF INDIA-SRS | |||||||
Age-group | 15-19 | 20-24 | 25-29 | 30-34 | 35-39 | 40-44 | 45-49 |
2011-ASFR- SRS-INDIA | 0.032 | 0.192 | 0.155 | 0.065 | 0.024 | 0.008 | 0.002 |
2001-ASFR- SRS-INDIA | 0.049 | 0.216 | 0.177 | 0.099 | 0.05 | 0.021 | 0.007 |
1991-ASFR- SRS-INDIA | 0.076 | 0.234 | 0.191 | 0.117 | 0.067 | 0.031 | 0.012 |
1981-ASFR- SRS-INDIA | 0.09 | 0.247 | 0.232 | 0.168 | 0.103 | 0.044 | 0.02 |
ASFR OF INDIA-Census | |||||||
Age-group | 15-19 | 20-24 | 25-29 | 30-34 | 35-39 | 40-44 | 45-49 |
ASFR-Census of India 2011 | 0.031 | 0.197 | 0.153 | 0.07 | 0.026 | 0.009 | 0.003 |
ASFR-Census of India 2001 | 0.028 | 0.149 | 0.137 | 0.085 | 0.047 | 0.031 | 0.027 |
ASFR-Census of India1991 | 0.037 | 0.142 | 0.13 | 0.087 | 0.054 | 0.032 | 0.02 |
ASFR-Census of India 1981 | 0.056 | 0.188 | 0.186 | 0.137 | 0.088 | 0.046 | 0.021 |
ASFR for selected years during 1981-2011 for India has fallen for women at all ages, both in rural & urban are- as. The greatest fall however, has occurred at older ages within reproductive span, indicating that fertility is in-
creasingly being controlled within marriage through adoption of family planning. At the younger age group 15-
IJSER © 2015 http://www.ijser.org
International Journal of Scientific & Engineering Research, Volume 6, Issue 1, January-2015 2120
ISSN 2229-5518
19 fertility decline reflects mainly a rise in the age at marriage of girls which increased from 17 years in 1971 to
21.2 years in 2012.Furthermore, earlier fertility used to peak at 20-24 and 25-29 and it now peaks only at 20-24 imply that average span of child bearing has declined considerably. It is mainly due to improvement in women education level and improvement in socio economic condition of women.
Education plays a very important role in population control, especially; women education is the prominent fac- tor to control TFR and elimination of poverty. Education of girls at least up to the age of 14 can help stop early marriages, prevalent in rural areas. It has been shown that wherever girl’s literacy has been taken care of, a sig- nificant improvement in population control observed. Women education affects socio-economic and demo- graphic indicators which are essential for population stabilization. The Task Force of the National Commission on Population (NCP) has been already identified the following key social, economic and demographic indica- tors for population stabilization in India.
1. Total Fertility Rate.
2. Sex ratio.
3. Percentage of couples using family planning methods.
4. Child mortality up to the age of 2.
5. Maternal Mortality Rate.
6. Percentage of Women receiving skilled attention during deliveries.
7. Percentage of children (12-24 months) getting complete immunization.
8. Nutritional status of children below 6 years.
9. Percentage of girls marrying below 18 years of age.
10.Percentage of births, deaths and marriages registered.
11.Literacy rate-males and females.
12.Enrolment of children in schools up to the age of 14 and the rate of dropouts.
13.Percentage of households with safe drinking water.
14. Percentage of villages connected by pucca roads.
Among, above fourteen indicators, first thirteen indicators are directly or indirectly affected by women education level.
• Among various socio-economic and demographic determinants of fertility, education, especially female educa- tion, is the most prominent factor to reduce TFR. The Task Force of the National Commission on Population (NCP) has been already identified the fourteen key social, economic and demographic indicators for population stabilization in India.
• There are several arguments in the demographic literature, which explains the mechanism through which education has its impact on the other variables such as age at marriage, contraceptive behaviour, fertility and mortality.
• Higher levels of education lead to a greater awareness and also contributes to improve the economic condition of women. Education acts as a catalyst for social upliftment enhancing the returns on investment made in almost every aspect of developmental efforts.
IJSER © 2015 http://www.ijser.org
International Journal of Scientific & Engineering Research, Volume 6, Issue 1, January-2015 2121
ISSN 2229-5518

• “Educate one man, you educate one person, but educate a woman and you educate a whole civilisation”.
-Mahatma Gandhi

Literacy rate in India has improved over the years according to the estimates provided by successive Censuses. Table 1 depicts the rise in the literacy rates. Estimates from the recent Census 2011 indicate a significant rise in the literacy level. However, large gaps in the male and female literacy rates still exits and every effort must be made to decrease this gap.
Table 1: Literacy Rate (1951 -- 2001) in India. Difference in Male & Fe-
Year
Literacy Rate (%)
male Literacy Rates
1951
1961
1971
1981
1991
2001
2011
Literacy rate in Uttar Pradesh.
18.3
25.06
23.98
26.62
24.84
21.68
16.3
2001 | 56.27 | 68.82 | 42.22 | 26.6 |
2011 | 69.72 | 79.24 | 59.26 | 19.98 |
Note: Literacy Rate of India in 1951, 1961 and 1971,Censuses relate to population aged five years and above and literacy
rates for the years 1981 and1991, 2001 and 2011, Censuses relate to the population aged seven years and above.
Broad-based efforts made during the last sixty years have resulted in a massive expansion of the education sys- tem in the country, raising the overall status of educational provisions in terms of accessibility and participation. As per 2011 Census of India, male and female literacy rates of India are 80.9 and 64.6 percent, respectively and its gap is 16.3 percent. As compared with 2001 Census, male literacy rate improved from 75.96% to 80.9% in
2011Census i.e. 4.94% increase in male literacy rate and female literacy rate also improved from 54.28 to 64.6
IJSER © 2015 http://www.ijser.org
International Journal of Scientific & Engineering Research, Volume 6, Issue 1, January-2015 2122
ISSN 2229-5518
percent i.e. 10.32% increase in female literacy rate. Thus, percentage improvement in female literacy rate in In- dia is more than double to that of male. But female literacy rate in India is still low. On the other hand, in Uttar Pradesh, both Male as well as female literacy rates are very low as compared to national literacy rate. Female literacy rate of Uttar Pradesh in 2001 was 42.22% and gap in male and female literacy rate was 26.6 percent. In
2011 Census, female literacy improved to 59.26% and gap in male and female literacy also reduced to 19.98%. But this improvement is lower than improvement in national literacy rate. Small amounts of primary and middle level of education are not likely to have a significant impact. However, the threshold level varies from one so-![]()
cial setting to another. In highly gender-stratified societies, the threshold level is likely to be higher than in rela-
tively egalitarian societies. To achieve the goal of replacement level (TFR 2.1), special attention must be given for women education not only for increase in literacy rate but also for increase in qualitative higher education.
Women education level and their TFRs in India
India,SRS- 2012 | Total literate | Illiterate | Without any formal education | Below primary | Primary Class | Middle Class | Class X | Class XII | Graduate and above |
Total | 2.1 | 3.2 | 3.1 | 2.9 | 2.5 | 2.2 | 1.8 | 1.6 | 1.7 |
Rural | 2.3 | 3.3 | 3.2 | 3.0 | 2.6 | 2.3 | 1.9 | 1.7 | 1.9 |
Urban | 1.7 | 2.4 | 2.9 | 2.4 | 2.2 | 1.9 | 1.6 | 1.4 | 1.6 |
Diff.in TFRof R/U | 0.6 | 0.9 | 0.3 | 0.6 | 0.4 | 0.4 | 0.3 | 0.3 | 0.3 |
From above table, it is very clear that TFRs of Illiterate women in rural as well as in urban area of India is high- est.TFRs of women without any formal education is also very high but just lower than TFRs of Illiterate wom- en. TFRs at different educational levels declined with a constant rate up to educational level class XII, in rural as well as in urban India. The Graph of difference in TFR of women in rural and urban area of India with differ- ent educational levels, primary to graduate and above is a straight line parallel to x-axis (educational levels). Thus, above result shows a significant and inverse relationship between education levels and fertility of women. In this context, we should reconsider our efforts for a higher level of female education in India, especially in some northern states like UP., Bihar, M.P., Rajasthan etc., along with effective family planning-policies and its successful implementation; efforts to educate women beyond the threshold level must continue in order to re- duce fertility rates at an even pace. A reduction in the fertility rate is only one of the numerous positive effects of education. It affects the survival rates of children. Above all, education helps men and women to become ef- ficient and conscious citizens. The autonomy acquired through education helps individuals (both men and wom- en) to understand what their rights are and the range of options they have to solve or mitigate their problems and suffering in order to live a better life. It is for this reason that education is a basic human right, and it is the duty of world leader ship to ensure education for all.
Even after controlling for other relevant factors, the education of women stands out as a significant factor in de-
termining fertility. It was shown that the greatest impact of education on fertility occurs when levels of educa- tion are at secondary level. Small amounts of primary and middle level of education are not likely to have a sig- nificant impact. However, the threshold level varies from one social setting to another. In highly gender- stratified societies, the threshold level is likely to be higher than in relatively egalitarian societies. Education increases women's levels of autonomy in decision-making, in acquiring knowledge, in gaining access to eco- nomic resources, and in interacting with a wider social circle. It is through this autonomy that education exerts an impact on population dnamics.
As per available data from SRS, there has been a gradual decline in the share of population in the age group
0-14 from 41.2 to 38.1 per cent during 1971 to 1981 and 36.3 to 29.1 percent during 1991 to 2012, whereas, the proportion of economically active population (15-59 years) has increased from 53.4 to 56.3 percent dur-
IJSER © 2015 http://www.ijser.org
International Journal of Scientific & Engineering Research, Volume 6, Issue 1, January-2015 2123
ISSN 2229-5518
ing 1971 to 1981 and 57.7 to 62.6 per cent during 1991 to 2012. On account of better education, health facil- ities and increase in life expectancy, the percentage of elderly population (60+) has gone up from 5.3 to 5.7 percent and 6.0 to 8.3 percent respectively during the periods under reference. Marital status and female mean age at marriage are essential constituents to monitor fertility and population growth. The data on mari- tal status has been included in SRS from 1991, whereas on Female mean age at marriage is from 1990. There is a marginal increase in the proportion of married female from 45.7 in 1991 to 47.0 in 2012, whereas the proportion of widowed/divorced/separated female has remained stagnant at 5.2. The mean age at effec- tive marriage for female has improved from 19.3 years in 1990 to 21.2 years in 2012.
Age composition by residence and broad age groups 0-14, 15-59 and 60+ for the year 2012 at the National
level is shown below in table. The age group 0-14 is further sub-categorized into the age groups 0-4, 5-9 and
10-14. It is observed that for most of the age groups, male-female differences in the age distribution of pop- ulation are negligible except in the combined age-group of 0-14, 15-59, 60+, 15-64 & 65+. In the age- group 0-14, Male population is about one percent more than female, whereas in the age-group 60+ as also
65+, percentage of female is 0.7 percent more than Male. The proportion of young children in the age group
0-4 and also the proportion of population in the age group 0-14 are higher in rural areas than in urban areas both for male and female. A higher proportion of male and female in the working age group 15-59 live in urban areas as compared to rural areas. Percentage distribution of population by broad age groups to total population
Percent distribution of estimated population by age-group, sex and residence, 2012 | ||||||||
India | Uttar Pradesh | Bihar | Kerala | Jharkhand | Madhya Pradesh | Chhattisgarh | Rajasthan | |
0-14 | 29.1 | 33.1 | 37 | 23 | 33.3 | 31.5 | 31.2 | 31.9 |
15-59 | 62.6 | 59.8 | 56.1 | 64.1 | 60 | 61.2 | 61.4 | 60.6 |
65+ | 5.3 | 4.6 | 4.4 | 8.4 | 4.1 | 4.6 | 4.6 | 4.7 |
Percent distribution of estimated population by age-group, sex and residence, 2012 | ||||||||
India | Uttar Pradesh | Bihar | Kerala | Jharkhand | Madhya Pradesh | Chhattisgarh | Rajasthan | |
0-14 | 29.1 | 33.1 | 37 | 23 | 33.3 | 31.5 | 31.2 | 31.9 |
15-59 | 62.6 | 59.8 | 56.1 | 64.1 | 60 | 61.2 | 61.4 | 60.6 |
60+ | 8.3 | 7.1 | 6.9 | 12.9 | 6.7 | 7.3 | 7.4 | 7.5 |
Age structure is one of the most important characteristics of population composition. Almost all characteristics vary significantly with age statistics form an important component of population analysis. Most of the analysis is based on age-sex structure of the population. The usefulness of age data is more noticeable when it is cross classified by variables like marital status, literacy, educational attainment, economic activity which vary with age in different patterns.
Apart from purely demographic concerns, the age-sex data structure is required for age specific analysis of data for planning scientific, technical and commercial purposes. The dependency ratio, which is the ratio of econom- ically active to economically inactive persons, is dependent on age composition. India has one of the largest
IJSER © 2015 http://www.ijser.org
International Journal of Scientific & Engineering Research, Volume 6, Issue 1, January-2015 2124
ISSN 2229-5518
proportions of population in the younger age groups in the world i.e.35.3% of the population of the country has been in the age group 0-14 years at the Census 2011and 41% of the population account for less than 18 years of age. As per 2001 Census, out of 1028.6 million population of the country, 513 million (49.8%) have reported as never married, mainly due to high proportion of young people. The numbers of widowed persons, mostly fe- males are more than 44 million in the country. In the age group 15-49 years, the prime child bearing age group,
81.4% of the women are married. This percentage is high due to lower female age at marriage in many parts of the country. The mean age at marriage for females, who married in the last five years, has been 23.5 years in the country. Among females the mean age at marriage varied from 17.8 years(Rajasthan)to 24.0 years(Goa), while among males it varies from 20.5 years(Rajasthan)to 28.2 years(Goa).
Sex Ratio.
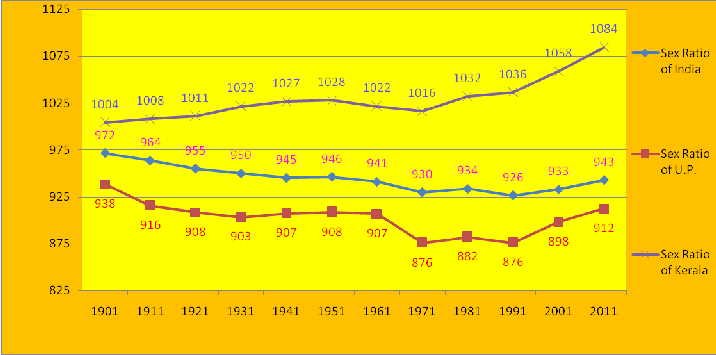
From above graph, it is very clear that sex ratio of the country has declined from 1901 to 1991, except in 1981
Census.But in last two decades1991to 2011, sex ratio of the country has increasing trend. Uttar Pradesh follows, similar trend. However, it is good news; the overall sex ratio at the national level has increased by 10 points
since the 2001 Census to reach 943 females per 1000 male at Census 2011.
This is the highest sex ratio recorded since 1961.In 2011 Census, increase in sex ratio has been recorded in 29
states and UTs while three major states - Bihar, Gujarat and Jammu and Kashmir have shown a decline in sex ratio as compared to Census 2001. Kerala with 1084 has the highest sex ratio followed by Pondicherry with
1038. Daman and Diu has the lowest sex ratio of 618.
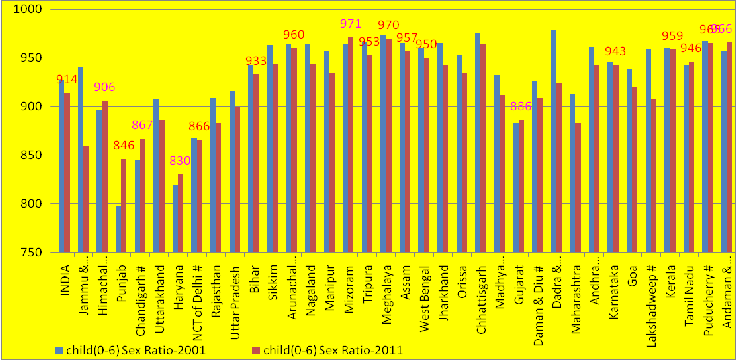
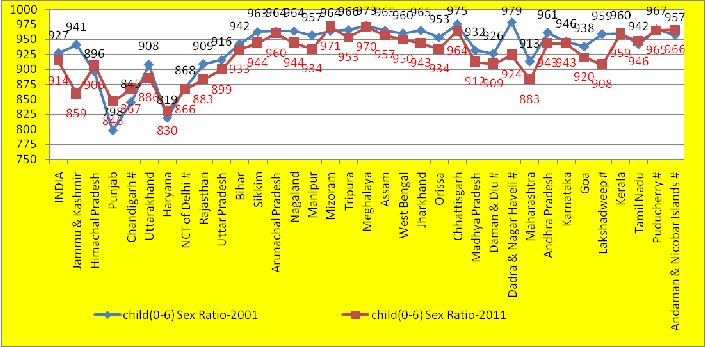
Child Sex Ratio in India.
IJSER © 2015 http://www.ijser.org
International Journal of Scientific & Engineering Research, Volume 6, Issue 1, January-2015 2125
ISSN 2229-5518
Despite a slew of laws to prevent female foeticide and schemes to encourage families to have girl child, the ra- tio has declined from 927 females against 1,000 males in 2001 to 914- the lowest since Independence, which was described as a "matter of grave concern" by Census Commissioner of India, Mr C. Chandramauli.
Though an increasing trend in the child sex ratio (0-6 years) has been found in Punjab, Haryana, Himachal Pra- desh, Gujarat, Tamil Nadu, Mizoram and Andaman and Nicobar Islands, on the other hand, the child sex ratio in all remaining 27 states and Union Territories declined over Census 2001.The highest child sex ratio has been reported in Mizoram (971 females against 1000 males) and Meghalaya (970).Notably, Punjab and Haryana, which have traditionally seen low sex ratio, have recorded an increasing trend but still remained at the bottom of the list. Haryana has 830 female children and Punjab 846 against per 1000 male child. Haryana's Jhajjar (774 females) and Mahendragarh (778 females) districts have the lowest sex ratio while Lahul and Spiti district of Himachal Pradesh has the highest sex ratio (1,013 females).
IJSER © 2015 http://www.ijser.org
International Journal of Scientific & Engineering Research, Volume 6, Issue 1, January-2015 2126
ISSN 2229-5518
Uttar Pradesh (29.7 million), Bihar (18.6 million), Maharashtra (12.8 million), Madhya Pradesh (10.5 million)
and Rajasthan (10.5 million) constitute 52 percent children in the age group of 0-6 years. Population (0-6 years)
2001-2011 registered minus 3.08 percent growth (i.e. -3.08%) with minus 2.42 for males and minus 3.80 for females. As per SRS, latest report, Sex Ratio at Birth for the country has gone up by 2 point to 908 in 2010-2012 from 906 in 2009-2011. Chhattisgarh has reported the highest Sex Ratio at Birth (979) while Haryana, the lowest (857). The Sex ratio of child (age group 0-4) for the country has been decreased to 912 in 2010-2012. The high- est and the lowest Child Sex Ratio have also been reported in Chhattisgarh (1011) and Haryana (837) respective- ly.
S ex r at io at bir t h ha s r e ce nt ly e mer g ed a s an ind ic at o r o f cer t a in k ind s o f se x d is cr iminat io n in so me st at es. Fo r inst ance, lo w s e x r at io at bir t h in so me st at es, viz, P a nja b, H a ya na, we st er n Ut- t ar P r ades h , et c. ar e no w at t r ibut ed t o se x- s e lect ive a bor t ion a nd infa nt ic ide due t o a st r ong pr e f- er e nce fo r so ns. T his w ill a ffe ct fut ur e mar r iag e pat t er ns a nd fer t ilit y pat t er ns. E ve nt ua lly, it co u ld cau se u nr est a mo ng yo u ng adu lt ma le s w ho ar e una ble t o find par t ner s.
To assess longevity in a society, demographers calculate life expectancy—the age that a new born would, on average, live to, assuming she were subject to a particular set of age-specific mortality rates—usually those pre- vailing in a particular year. Life expectancy is trending upward around the world, but a substantial gap remains between developing and developed countries. In 2006, life expectancies at birth ranged from the mid-30 in some African countries to (70 - 80) years in the United States. Life expectancy serves as a measure of the gen- eral health of the population, which depends on the satisfaction of many basic human needs such as adequate nutrition, clean water and sanitation, as well as access to medical services like vaccinations. Addressing these requirements reduces the incidence of many preventable illnesses. For example, nutritional deficiencies cause common illnesses like scurvy and pellagra, while dirty water and poor sanitation spread infectious agents such
as cholera and typhoid.
IJSER © 2015 http://www.ijser.org
International Journal of Scientific & Engineering Research, Volume 6, Issue 1, January-2015 2127
ISSN 2229-5518
Researchers are also gaining new insight into existing threats, such as indoor air pollution from combustion of primitive biomass fuels like crop waste and dung. Exposure to these pollutants is a major factor contributing to infant mortality and lower life expectancy in developing countries. Environmental investments, such as provid- ing cleaner energy sources and upgrading sewage treatment systems, can significantly improve public health. Another step that increases life expectancy is creating a public health infrastructure that can identify and re- spond quickly to disease outbreaks, famines and other threats.
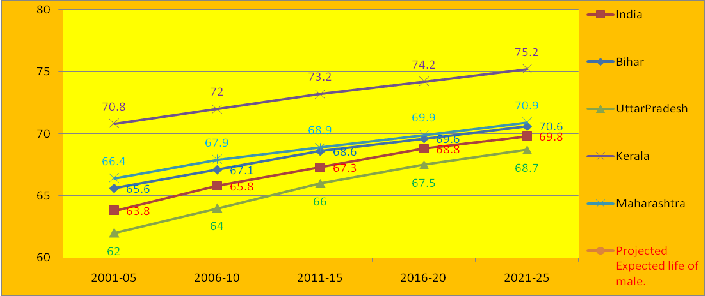
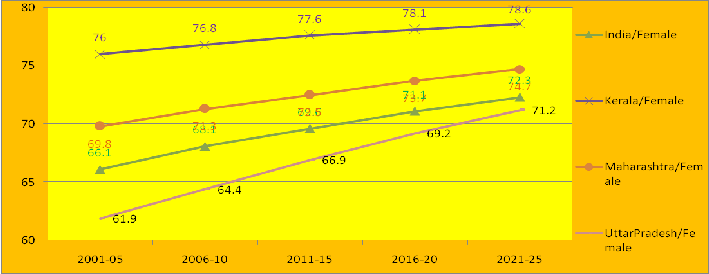
Life expectancy in India also differs by sex, which varies from state to state. In 1951, life expectancy for male and female were 38.7 and 37.1 years respectively. Life expectancy of male and female in India reversed in re- cent years, 2001-2006, It becomes 63.7 years and 66.9 years, for male and females, respectively. In Kerala, it
becomes 71.67years for males and 75.00 years for females.
IJSER © 2015 http://www.ijser.org
International Journal of Scientific & Engineering Research, Volume 6, Issue 1, January-2015 2128
ISSN 2229-5518
Urbanization in India was mainly caused after independence. Second five year plan of India focused on indus- trialization and emphasized, setup heavy industries in the country which gave rise to Urbanization at a faster
rate in India. The nation's economy saw a rise due to industrial revolution and the invention of new technologies
increased the standard of living of people living in urban areas. The growth of public sector resulted in devel- opment of public transport, roads, water supply, electricity, and hence the infrastructure of urban areas.
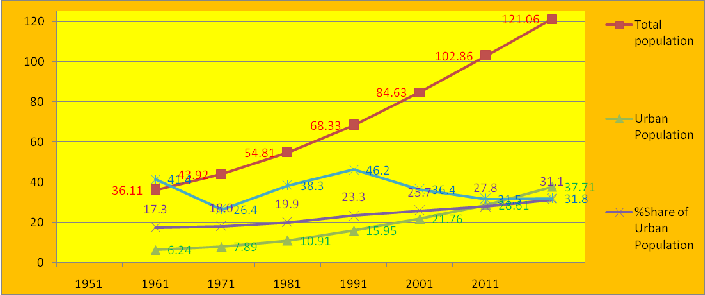
According to 1901 census, urban population of India was 11.4%, in 1951 it was 19%. This count increased to
28.53% according to 2001 census, and 31.16%., as per 2011 census. Maharashtra was the most urbanised state in India till 1991, stood behind Tamil Nadu in 2001 and third after it in 2011, with Kerala being first, with the urban-total state population ratio. However, Maharashtra's urban population of 41 million, far exceeds that of Tamil Nadu which is at 27 million, as per the 2001 census.
IJSER © 2015 http://www.ijser.org
International Journal of Scientific & Engineering Research, Volume 6, Issue 1, January-2015 2129
ISSN 2229-5518
As per World Bank report, India, along with China, Indonesia, Nigeria and the United States, will lead the world's urban population surge by 2050. Mumbai saw large scale rural-urban migration in the 21st centu-
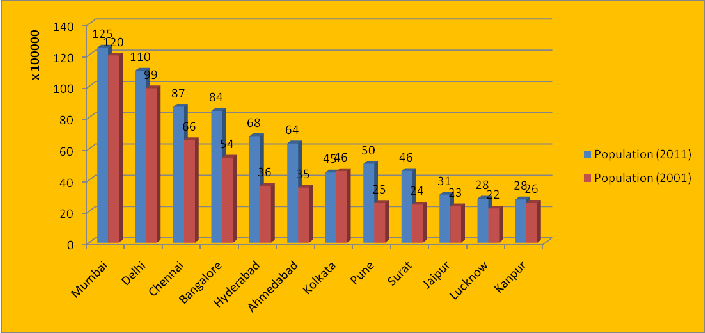
ry. Mumbai accommodates 12.5 million people, and is the largest metropolis by population in India, followed by Delhi with 11 million inhabitants. Witnessing the fastest rate of urbanisation in the world, as per 2011 cen-
sus, Delhi's population rose by 4.1%, Mumbai's by 3.1% and Kolkata's by 2% as per 2011 census compared to
2001 Census. Estimated population, at the current rate of growth, by year 2015, Mumbai stands at 25 mil-
lion, Delhi and Kolkata at 16 million each, Chennai, Bangalore and Hyderabad at 10 million.
In Melbourne: Prime Minister of India Mr Narendra Modi said a successful India will provide a vast oppor- tunity for the world and sought closer ties with Australia.
“India is experiencing urbanization at a rapid pace. Studies suggest that by 2031, 11 percent of the world’s ur- ban population might be in Indian cities,” He added that India already has over 50 cities with a population of over one million. Urbanization can be an enormous opportunity. He spoke of his plans to build 100 smart cities, revive heritage cities; build modern solid waste management and waste water treatment systems in 500 cities, and clean up the country’s rivers.

“This is part of our larger vision of a sustainable future for our country and transforming the quality of life of our people in cities and villages alike”. The prime minister said, “He wanted to build a future in which every Indian can say that his life has improved and his environment has become better, I am confident that we will achieve it with the support of the people of India,” By Agencies | Nov 18, 2014 03:47 pm
A slum in Chennai
Rapid rise in urban population, in India, is leading to many problems like increasing slums, decrease in standard of living in urban areas, also causing environmental damage. In slums generally, people do not access the bene- fits of city life, they live in crowded conditions without proper shelter, safe drinking water and toilet facilities. People in slum, generally suffers with malnutrition and having lower life expectancies than people of posh col- ony.
The third major factor that drives population trends is migration, which includes geographic population shifts within nations and across borders. Migration is less predictable over long periods than fertility or mortality, since it can happen in sudden waves—for example, when refugees flee a war—or slowly over many years. Im- migration often changes host nations' or regions' ethnic mixes and strains social services. On the positive side, it can provide needed labour (both skilled and unskilled). However, immigration may drain away valuable talent, especially since educated and motivated people are most likely to migrate in search of opportunities.
For a large country like India, the study of movement of population in different parts of the country helps in un- derstanding the population dynamics of the society better. When a person is enumerated in Census at a different place than his / her place of birth, she / he is considered a migrant.Migration in the Census of India is of two types – Migration by Birth place and Migration by place of last residence. The data on migration by last resi-
IJSER © 2015 http://www.ijser.org
International Journal of Scientific & Engineering Research, Volume 6, Issue 1, January-2015 2130
ISSN 2229-5518
dence in India as per Census 2001 shows that the total number of migrants was 31.4 crore. In the decade 1991-
2001, about 9.8 crore persons migrated to a new place from their place of last residence. Out of these migrants
by last residence, 8.1 crore were intra-state migrants, 1.7 crore inter-state migrants and 7 lakh international mi- grants.
The largest volume is confined to migration from one part of the State to another. Migration on account of change of residence by women after marriage constitutes significant proportion of these migrants. The most im-
portant component among the streams is the rural to rural migration. As per 2001 Drop-in-Article: Census of
India 2011 Page 2Census in 1991-2001, about 5.3 crore persons migrated from one village to another. The num-
ber of migrants from villages to towns was about 2.1 crore. Similarly, number of migrants from towns to villag- es was about 62 lakh and from one town to another about 1.4 crore.
Opportunities in urban areas for employment, education, etc have been a pull factor attracting migrants from rural to urban areas and from smaller towns and cities to larger urban areas. There is also migration in the oppo-
site direction from urban to rural areas due to various reasons.
Out of about 98 million, total intra-state and inter-state migrants in the country during last decade, 61 million have moved to rural areas and 36 million to urban areas. Migration stream out of rural areas (73 million) to an- other rural areas was quite high (53million) in comparison to from rural to urban areas (20 million). About 6 million migrants went to rural areas from urban areas. On the basis of net migrants by last residence during the past decade, i.e., the difference between in – migration and out – migration, in each state, Maharashtra stands at the top of the list with 2.3 million net migrants, followed by Delhi (1.7 million), Gujrat (0.68 million) and Har- yana (0.67 million) as per census. Uttar Pradesh (-2.6 million) and Bihar (-1.7 million) were the two states with largest number of net migrants migrating out of the state. There are various reasons for migration as per in- formation collected in Census 2001 for migration by last residence. Most of the female migrants have cited
‘Marriage’ as the reason for migration, especially when the migration is within the state. For males, the major reasons for migration are ‘work/employment’ and ‘education’. As per India Demographic Profile 2014, Net mi- gration rate is -0.05 migrants/1000 population observed.
Population policy in India.
If one were to recall the various stages of evolution of India's population policy over the years one would find that the basic thrust of the strategies pursued had all through been people oriented and motivational in nature, except for a brief period during the Emergency when State-driven coercion was unleashed with disastrous con- sequences.
While demographers viewed the 1991 census figures as heralding doom for India, Gowariker read in these a positive trend of population being under control. The point he made was that people on their own were choosing to have fewer children because they knew that was good for them. His thoughts presented at the 79th Indian Science Congress were brought out as a book titled “The Inevitable Billion Plus”.
After a detailed presentation of the views of academics, intellectuals and experts on the complexity of India's population dynamics, Gowariker presents his conclusion that demographic transition has already set in and is moving to its final stage and India has accomplished the first phase of transition, namely reduction of crude death rate to a level comparable to that of many European countries. Based on these, he predicts that with the birth rate of 21 per thousand, death rate of eight per thousand per year and the natural increase of 13 per thou- sand, India will reach the Net Reproduction Rate of one within a decade from 1999. According to him, the 2001
Census should clearly signify how close the country is to this momentous stage of demographic transition. He
rejects the prophecy that India will become the most populous country in the world. In his view, India's popula- tion will not exceed that of China. Gowariker suggests massive training of innovative communicators to convey population-related messages to the people, achievement of total literacy and making the country surplus in power for all times to come over the next five years.
Demographer & economist Julian L. Simon of the University of Maryland, who had challenged the Malthusian fear of the planet being devoured by a growing population way back in the 1980s. Simon viewed people to be
IJSER © 2015 http://www.ijser.org
International Journal of Scientific & Engineering Research, Volume 6, Issue 1, January-2015 2131
ISSN 2229-5518
the ultimate resource, “People do not come with just a mouth but also a mind. They are not just consumers, but also producers,'' says Mitra and quotes Simon to show that while population has increased, the natural resources have also become more abundant, instead of getting depleted. Mitra recalls how Simon genuinely rejoiced at the potential, which every new life brought. “He (Simon) wondered how many Michaelangelos or Newtons would be lost to the world because of misguided preference for birth control policies,'' observes Mitra.
It is basic assumption of the Indian Demographers that population explosion is the root cause of all the ills fac- ing the nation. But the thesis propounded by Lord Peter Bouer that rapid population growth has certainly not inhibited economic progress either in the West or in the contemporary, third World and the contention of Deepak Lal that population growth has had no impact on India's economy, particularly agriculture and the ar- gument of Sauvik Chakravarti that population growth causes prosperity and that urbanization and free trade are suited to absorb the diverse potential of the increasing numbers.
Agricultural mechanization increased agricultural productivity. As food supplies expanded, average level of
nourishment rose and vulnerability to chronic and contagious disease declined over succeeding generations. Im- provement in medical facilities and public health services also helped to people to live longer, so death rates fell. After several decades of lower death rates, specially declining infant and child mortality and improvement in women literacy rate helped to decline fertility, effectively resulting in a baby boom. This phased reduction in death and birth rates is a process called the demographic transition, which affects population growth rates in different stages. In these stages first mortality transition came after that fertility transition came. Population momentum (continued population growth after a fall in birth rates) accounts for a significant portion of popula- tion growth, even though fertility rates declined, especially in empowered action group (EAG) states.
To view population as a resource and not as a drain on our limited resources has been brought out around the time the Maharashtra Government announced its decision to deny a number of benefits, including rationed food and even healthcare, to families comprising more than two children. This is a disincentive policy for parents who do not adopt the small family norm. The underlying intention is understandable. However, this goes coun- ter to one of the lessons learnt over the past six decades of implementation of the population control programme that disincentives not only do not work but can also be counterproductive. The latest Population Policy-2000 statement avoids any mention of disincentives, though it envisages some incentives by way of rewarding the panchayats and the families adopting the small family norm. Its focus is on a range of programmes covering different sectors like strengthening the primary healthcare service, reducing maternal and child mortality, devel- opment of the girl child, complete immunization to all children, improving nutritional status of children below 6 years, improving access to education for all and meeting the unmet needs of contraception to motivate people in favour of the small family norm.
Developed nations have passed through the demographic transition and developing counties (like India) are at some point in the process. As a result, a “bulge” or baby boom, generation distinctly larger than those preceding or following it, is moving through the age structure of population. These large cohorts create both opportunities and challenges for society. As this cohort moves into working age group; it will be potentially higher share of workers as compared with dependent population.
The author concludes that Indian policy makers will need to recognize that the realization of the demographic dividend depends on an economy’s capacity to absorb workers into productive employment. This capacity would be strengthened by: Government’s revised Population Policy, with active participation of the public though National Population Commission. It appears, apparent that population of India will exceed to the popu- lation of the China. But special attention should be given on the EAG states to achieve the goal of replacement level (TFR 2.1) and the time will show whether the new population policy would deliver the expected result.
Ifworking ages Population can be productively employed according to their age structure with skilled develop-
ment, economic growth of India will be accelerated. They also can strain available resources and services, which in turn may cause shortages and economic disruption. Failure to take advantage of the opportunities in- herent in demographic change can lead to economic stagnation.
Our Prime Minister and chairman of the Population Commission of India Mr Narendra Modi, use to say in his speeches that India has youngest population in the world and she can achieve economic dividend by skill devel-
IJSER © 2015 http://www.ijser.org
International Journal of Scientific & Engineering Research, Volume 6, Issue 1, January-2015 2132
ISSN 2229-5518
opment and optimum use of our human resources. We can supply human resource to the whole world. He dif- fers from basic assumption of the Indian Demographers that population explosion is the root cause of all the ills, facing the nation. The contention of Deepak Lal that population growth has had no impact on India's economy, particularly agriculture and the argument of Sauvik Chakravarti that population growth causes prosperity and that urbanization and free trade are suited to absorb the diverse potential of the increasing numbers, supports, views of our Prime Minister Mr Narendra Modi. Different Ministries of the Government of India have started work on skill development. Thus, population of Indian will not be the root cause of all the ills, facing the nation, but it will be boon for development of the nation.
From above discussion and analysis, author concludes that complexity of the India’s population dynamics is at
some point of demographic transition, in the process and moving to its final stage. It varies from state to state in the country. All six southern states, (viz. Andhra Pradesh, Karnataka, Kerala, Tamil Nadu, Maharashtra, Goa) and two union territories (Pondicherry and Andaman and Nicobar Islands.) have already achieved replacement level before 2010 deadline, but EAG states, are far away from the target. India has already achieved the target of some demographic indicators, namely reduction of crude death rate to (7.0) and crude birth rate to (21.4) per thousand and TFR is 2.4. SRS result of 2013, clearly signify that country is very close to achieve replacement level. It appears, apparent that population of India will exceed to the population of the China. But special atten- tion should be given on the EAG states to achieve the goal of replacement level (TFR 2.1). Due to population momentum, a “bulge” or baby boom, generated distinctly larger than those proceeding or following it, is mov- ing through the age structure of population. These large cohorts create both opportunities and challenges for the country. As this cohort moves into working age group; it will be potentially higher share of workers as com- pared with dependents population. If working ages population can be productively employed according to their age structure with skilled development, economic growth of India may be accelerated. These population cohorts may give economic dividend for the country. They also can strain available resources and services, which in turn may cause shortages and economic disruption. Failure to take advantage of the opportunities inherent in demographic change can lead to economic stagnation of the country.
I would like to thanks my wife Mrs Indira Pandey, who motivated and inspired me with her ideas to write this paper; I would also like to thanks Dr Rupam Tiwari, Assistant professor of the Don Bosco Institute of Manage- ment & Research, Mumbai and Dr Anupama Choubey, Assistant professor of the Institute of leadership and en- trepreneurship Development, Kolkota for her innovative contribution as a co-author. I also thank Mr. A.K. Singh (DRG) (Retired) and Mr R.C. Sethi, Additional RGI (Retired) office of the Registrar General of In- dia,New Delhi, who motivated me for writing Research Paper. I would also like to thank Mr Gopal Mahto, As- sistant Director, DCO, Bihar, Patna who encouraged me to write this paper.
(1) International Journal of Scientific & Engineering Research, Volume 4, Issue1,January 2013,ISSN2229-5518, “Modification in P/F Ratio Technique due to change in assumptions”. By Manjul Mayank Pandey & Dr.Rupam Tiwari.
(2)Published report of ‘National Commission on population’ of India.
(3)U.N. Manual, Chapter II, estimation of fertility.
(4)Instruction manuals and published, F-series data of Census of India-2001 of Uttar Pradesh. and India.
(5)Population analysis spreed sheet (PAS) of U.S. Census Bureau, International Program Centre, with some modifications.
(6) “Women education level and their TFR in Uttar Pradesh.” by Manjul Mayank Pandey & Dr Rupam Tiwari.
(7) Bulatao, Rodolfo A. and Ronald Lee (1983). "Overview of Determinants of Fertility in Developing Coun-
tries. In Determinants of Fertility in Developing Countries. Vol. II, New York; London: Academic Press. Pp.
IJSER © 2015 http://www.ijser.org
International Journal of Scientific & Engineering Research, Volume 6, Issue 1, January-2015 2133
ISSN 2229-5518
757-787.
(8) Simmons, George B. (1985). "Research on the Determinants of Fertility". In Fertility in Developing Coun-
tries: An Economic Perspective on Research and Policy Issues. Ghazi Farooq and George B. Simmons (eds.). London: Macmillan. Pp. 67-108.
(9) Sandhu, Jasmeet (1996). Sociology of Fertility. Jaipur and New Delhi: Rawat Publications.
(10) Chandrasekhar,C.P.,Jayati Ghosh and Anamitra Roy chowdhary (2006). “The Demographic Dividend’ and
Young India’s Economic Future”. Economic and political WeeklyDec.9.Vol. 41,No.49.5055-5064.
(11) Jejeebhoy, Shireen J. (1995). Women's Education, Autonomy, and Reproduction Behaviour: Experience
from Develo ping Countrie s. Oxford: Clarendon Press.
(12)United Nations. Department for Economic and Social Information and Policy Analysis, Population Division
(1995). Wo men's Education and Fertility behaviour. New York: United Nations.
(13) Chaudhury, R. H. (1977). "Education and Fertility in Bangladesh". Bangladesh Development Stud-
ies (Jan.).
(14) Amin, Sajeda (1996). "Female Education and Fertility in Bangladesh: The Influence of Marriage and Fam-
ily". In Girl's Schooling and Autonomy and Fertility Change in South Asia. Roger Jeffery and Alaka M. Basu
(eds.). Thousand Oaks, C.A.: Sage Publications.
(15) SRS, Bulletins and executive summary, data on migration and SRS Statistical report published by ORGI, New Delhi.
(16). UNO, published data,on sex ratio of countries.
(17). Chowdhury, Mridul K. (1994). "Mother's Education and Effect of Son Preference on Fertility in Matlab, Bangladesh." Population Research and PolicyReview. Vol. 13: 257-273.
(16). John Cleland, “Education and future fertility trends, with special reference to mid-transitional countries.” (18). Human Population Dynamics by David E. Bloom.
(19). Lant Pritchett,” Desired Fertility and impact of Population Policies”, Population and Development
Review, Vol.1, No.20, March 1994, pp.1-55.
(20). “Population Dynamics in India and Implications for Economic Growth”, by David E. Bloom. (21).Bloom, David E,David Canning and G Fink,(2008).”Urbanization and the Wealth of Na- tions”,Science,February,772-775.
(22). Report of the steering Committee on urban development for eleventh five year plan (2007-2012), Gov- ernment of India, Planning Commission, New Delhi.
IJSER © 2015 http://www.ijser.org