International Journal of Scientific & Engineering Research, Volume 6, Issue 3, March-2015 682
ISSN 2229-5518
Phytochemical Analysis of Leaf-Extracts from Eight Tropical Trees: Prospects for Environmentally-Friendly Dye Compounds for Smart Windows
Temitope Abodunrin, Chidi Uhuegbu , Joseph Olugbuyiro
Temitope Abodunrin is running her Ph.D and works in the Department of Physics, Covenant University Ota, Nigeria Chidi Uhuegbu is a professor and works in the Department of Physics, Godfrey Okoye’s University Enugu, Nigeria Joseph Olugbuyiro works has a Ph.D and works in the Department of Chemistry, Covenant University Ota, Nigeria
Abstract—The crude extract of eight specimen leaf samples were studied by phytochemical analysis for investigating prospects of the extracts for environmentally-friendly dye compounds that could be useful for smart windows. The phytochemical analysis reveals the presence of phytoconstituents such as flavonoids, anthraquinones, tannins, saponins, thus suggesting presence of compounds that could be useful as dye for smart windows in the chromophore of the plant. As a preliminary test, dye pigment grown on glass from the extracts, using the Solution Growth Technique, exhibited low absorbance and high reflectance at transmittance set at 400 nm when studied using UV/VIS spectroscopy between 190 nm and 1100 nm wavelength i.e. within the visible range of light in the electromagnetic spectrum. These indicated suitability of the leaf-extracts from the studied plants for growing environmentally-friendly dye compounds that could be used for smart windows.
Index Terms— Anthraquinones, Chromophore, Percentage yield, Phytochemical screening, , Smart window, Solution Growth Technique (SGT), Spectrophotometry
—————————— ——————————
Energy budgeting is essential to drive technological innovation. Fossil fuel by its inherent nature is not billed to last forever. Hence, a need to depend on a clean-renewable energy source is salient to building a lasting energy supply. In 1991, Gratzel et al., [1] advanced the use of dye-sensitized solar cells. They used organic dyes to trap solar energy from the sun by growing the dye on a semiconductor substrate to generate electricity. In contrast to the challenges of silicon solar cells-high cost of production, dye pigments are readily available from leaves, stems, bark, pulp and plant seeds and seedlings. They represent an eco-friendly source of energy, cheaper and have increased trend in efficiency; 9. 8% in recent times [2]. These dyes are produced from efficient but simple laboratory procedures. Dye sensitized solar cells (DSSC) are fabricated from abundant and cheap materials (plants) using inexpensive processes similar to screen-printing. The DSSC shelf life may be low so also the yield, its non-toxic and easy decomposition makes it a cheaper, safer and viable option. Modern research shows that Perovskite sensitized solar cells (PSSC) has attained a power efficiency of almost 15% [3]. In spite of the qualities of PSSC (i.e. better efficiency and high durability) its shortcoming includes complicated synthetic routes, high cost of production, high environmental impact, and affinity for degradation when contaminated by water [4]. The advantage of non-toxic natural pigments as sensitizer over the PSSC is its economic and environmental benefit [4], [5], [6]. Though natural dye sensitizers may still produce marginal energy output, it is optimistic that high efficiency dye sensitized solar cells would become a reality with progressive studies and investigation [7], [22].
A number of natural dyes have been utilized as sensitizers for DSSCs. El-Agez et al. [13] researched on natural dyes extracted from dry and fresh plant leaves and observed that spinach oleracea extract has an improved efficiency after drying. In 2008, red Sicilian orange juice dye was used as a sensitizer and a conversion efficiency of 0.66% was reported [14]. Rosella used as a sensitizer for DSSCs with efficiency of 0.70% [15]. Roy et al. [16] reported that DSSCs sensitized with Rose Bengal dye can have conversion efficiency of 2.09%. The modified structure of coumarin derivative dye was proposed by Wang et al. [17] which provided an efficiency of 7.6%. Etula [18] and Ahmadian [19] studied the structure and the concentration of anthocyanins, respectively. In several sensitizers,
IJSER © 2015 http://www.ijser.org
International Journal of Scientific & Engineering Research, Volume 6, Issue 3, March-2015 683
ISSN 2229-5518
natural dyes are used in the manufacture of DSSCs. It was hypothesized, that natural dyes with higher anthocyanin concentration [20], such as those extracted from blueberry and black raspberry have higher fill factors and
efficiency. Chlorophyll (A) structure in Punica granatum peel extract gave a solar cell with 1.86% conversion efficiency. In general, natural pigments [34], such as anthocyanin, carotenoids, and chlorophylls’, have several advantages over rare metal complexes for DSSC sensitization. Recently, the nanostructure growth sensitized cells have been reported [21], [22], [23]. It processes high quality nanostructures- at reduced cost and high energy efficiency. Therefore, solution-based methods with the goal of low-cost nanostructure growth at low temperatures have been developed. The most important facet of DSSC is the thin film methodology - consolidation of a structure via adding ‘atom by atom’. This process requires a temperature that far exceeds thermodynamic equilibrium. It allows the creation of regulated metastable stages of nanocomposites [24].
DSSC has application in Smart Windows or switchable glass windows [4], [5]. Smart glass regulates the amount of
light transmitted by controlling or blocking out some or all wavelengths of the incident sunlight. Glass changes
from transparent to translucent when this control is activated.
Smart glass has found uses in [6], conventional architecture (housing), automobile (car windows and windshield),
aviation (Partition glass), rail, health and marine sectors. In hospitals where traditional blinds could become infected with dirt and bugs, smart windows present a safe alternative. Research [7], [8], [9] shows that, Patients health comfort is capable of restoring health speedily. Smart technology includes, electrochromic devices, liquid crystal (LC)/ Polymer dispersed liquid crystal (PDLC), suspended particle device (SPD), thermochromic devices, photochromic devices, the latest micro–blind and nanotechnology. They are classified as passive (thermochromic and photochromic): they react naturally to change in heat, or sunlight. Active ones such in electrochromic devices require an external source of stimuli such as voltage to change glass properties dynamically [7], [8], [9].
In this paper, eight plant samples were investigated. The phytochemical screening carried-out for eight leaf
samples, oil bean, newbouldia, mango, African apple, palm frond, bauhinia bowkeri, yellow trumpet bush and zobo leaf (as shown with yellow highlight on Table 1 and 2). We investigated the chromophores like flavonoids [3], tannins [3], cyanin [4], caponins and Saponins, anthraquinones [10]-indicating the suitability for use as an organic dye [11] which could function in DSSCs. Batch separation [3], [30] was carried-out on the dye extract to improve the purity of the dyes and identified the active samples of the dye. Six leaf samples tested negative for phytoconstituents (see olive green highlight on table 1 and 2). M. indica L. and P. macrophylla leaf samples showed the presence of the dye pigments. Their dye extract was characterized using UV-VIS absorption spectra. The optical characteristics were investigated for suitability to use as photochromic device [5].
The leaves of the eight leaf samples (see yellow highlight on Table 1 and 2) were air dried for some weeks. Each was milled to coarse particles, and spread out to dry to prevent it from becoming moldy. The phytochemical screening [5] was done on each of them. The leaf of M. indica L. and P. macrophylla was soaked in methanol for eleven days to extract the dye. The dyesol mixture was separated using plastic funnels and cotton wool. The filtrate was collected in large sample bottles and covered. This was poured periodically into a rotary evaporator, until all the dye was separated from dye solution and the methanol recovered for future laboratory use. The pictorial methodology is shown in figure [1] below.
IJSER © 2015 http://www.ijser.org
International Journal of Scientific & Engineering Research, Volume 6, Issue 3, March-2015 684
ISSN 2229-5518
2.748Kg ma
3.000Kg Oil bean
Crude extra
using a filter and cotton wool
Dry Crud
Mother Liquor
Batch separation with s
Hexane faction EthylAcetate
Thin film production
Fig. 1 showing the process of obtaining dye pigment from M. indica L. and P. macrophylla
A separating funnel was used to purify the feedstock. The crude extract (dye) was mixed with 40ml Hexane and 20ml Ethyl Acetate [3], [30]. This mixture was thoroughly mixed and poured into the flask of the separating funnel to obtain the different sections. The four portions obtained were:
a. The crude
b. Aqueous c. Hexane
d. Ethyl Acetate factions
The dry crude and hexane portions were the largest - confirming the organic nature of the dye. A phytochemical analysis is described below.
The crude methanolic extract (M.indica.L. and P. macrophylla) was mixed with 2.5ml of distilled water in a
25ml test tube. It was vigorously shaken together. Formation of persistent froth was taken as evidence for presence of saponins.
Emulsifying Property-Two drops of olive oil was added to 2.5ml of crude extract. This was shaken
vigorously for thirty minutes. A stable emulsion was observed (table 2).
IJSER © 2015 http://www.ijser.org
International Journal of Scientific & Engineering Research, Volume 6, Issue 3, March-2015 685
ISSN 2229-5518
0.5g of each sample (M.indica.L. and P. macrophylla) was extracted with 10ml of 80% ethanol for five minutes on a steam bath. The extract was filtered and diluted with an equal volume of distilled water. A few drops
of lead acetate solution was added, shaken and filtered after standing for a few minutes. The filtrate was then extracted with three aliquots; equal amounts of chloroform. The extract was divided into two portions in an evaporating dish and evaporated to dryness.
Keller-Killiani Test: one portion from above was dissolved in 3ml of Ferric Chloride reagent in a clean test
tube. 2ml of concentrated sulphuric acid was then poured from the side of the test tube to form a layer
below the acetic acid. A formation of purple or reddish brown colouration at the interface and a green colour in the acetic layer was taken for a positive result (table 2).
0.5g of crude extract was stirred with 5ml of 10% aqueous hydrochloric acid (HCl) in a steam bath for fifteen minutes and was filtered while hot and allowed to cool. 1ml filtrate was then heated with a few drops of each of the following reagents:
• Mayer’s reagent
• Wagner’s reagent
• Drangendorff’s reagent.
Turbidity or precipitation with any of these reagents was taken as preliminary evidence for presence of alkaloids in sample (table 2).
0.5g of the crude extract was mixed with 10ml of distilled water in a test tube and filtered. A few drops of ferric chloride was added and observed for a bluish; dark green colouration, indicating the presence of tannins (table 2).
The absence of the deposition of a red precipitate when an aqueous crude methanol extract of the sample was boiled with 5ml of 1% aqueous hydrochloric acid was taken for the absence of Phlobatannins.
The solution of the extract was tested with the following reagents:
Shinoda Test: 3ml of extract was added to a small quantity of magnesium turnings, and then a few drops of concentrated hydrochloric acid were run down the side of the test tube. At the upper phase, the appearance of three colour bands; orange, pink, reddish indicated the presence of flavonoid (table 1).
minutes and filtered while hot. The cool filtrate was partitioned against equal volume of chloroform (two volumes), avoiding vigorous shaking. A clean pipette was then used to transfer the chloroform layer to a test tube taking care not to include the aqueous layer. An equal volume of 10% ammonia was added to the chloroform extract. A pink, red or violet colour in the aqueous layer indicates the presence of combined anthraquinones (table 1).
Each of these factions was deposited on a glass substrate using [29] the solution Growth Technique (SGT). The glass slides were degreased then rinsed with warm distilled water before use. A pair of glass slides was dipped into a
IJSER © 2015 http://www.ijser.org
International Journal of Scientific & Engineering Research, Volume 6, Issue 3, March-2015 686
ISSN 2229-5518
beaker containing the dye solution (dyesocol). The vertical growth of dye is observed in-between the slides and the rate of growth was observed for a period of six days. The dye grows on the glass substrate by capillary action; a thin
coat of the dye is deposited on the glass. The UV-vis absorbance and transmittance spectra of the dye samples was done using Genesys10 UV/VIS single beam spectrophotometer, it gave the absorbance difference in part per million. The range of the scan was into two forms i.e. from 190nm to 1100nm and 300nm to 800nm wavelength.
The dye colouration of M. indica L. feedstock was light brown [4], P.macrophylla was dark green – it corresponds to the wavelength peak observed between 190nm to 664nm (figure 1). Fig.1 shows four prominent peaks between wavelengths 220nm to 664nm. The Absorbance percentage decreases as the peak increases. There is an inverse relationship between the absorbance peak value and the corresponding wavelength. At the highest wavelength peak, the radiation absorbed by M. indica dye is least. At the lowest wavelength peak-regardless of the radiation influx, absorbance is enhanced (see figure 2). The chromophores are highly sensitized [28, 31] at lower wavelength. At higher wavelengths, the excess energy is either reflected or transmitted [29]. The wavelength of visible light or UV absorbed by organic dye is a function of the measure of delocalization of the molecule. It depends on type of orbitals and their energy level. When light falls on organic dyes, energy to move from one orbital or energy level to another is available. Electrons jump from a bonding or non-bonding orbital into an empty anti-bonding orbital. Light of appropriate frequency and wavelength is necessary to precipitate this action. The relationship of incident light to electron jump is given by:
𝐸 = ℎ𝜈……… (I)![]()
However, 𝜆 = 𝑐 …….. (ii)
𝑣
Where :
𝐸 ∶ 𝑒𝑛𝑒𝑟𝑔𝑦 𝑜𝑓 𝑙𝑖𝑔ℎ𝑡
ℎ: 𝑝𝑙𝑎𝑛𝑐𝑘′ 𝑠𝑐𝑜𝑛𝑠𝑡𝑎𝑛𝑡
𝜈: 𝑓𝑟𝑒𝑞𝑢𝑒𝑛𝑐𝑦 𝑜𝑓 𝑙𝑖𝑔ℎ𝑡
𝜆: 𝑤𝑎𝑣𝑒𝑙𝑒𝑛𝑔𝑡ℎ 𝑜𝑓 𝑖𝑛𝑐𝑖𝑑𝑒𝑛𝑡 𝑙𝑖𝑔ℎ𝑡
𝑐: 𝑡ℎ𝑒 𝑣𝑒𝑙𝑜𝑐𝑖𝑡𝑦 𝑜𝑓 𝑙𝑖𝑔ℎ𝑡
Frequency increases as wavelength becomes smaller. Higher electron jumps, less is the wavelength of absorbed light. More
jumps require light of small wavelength with a lot of energy.
The groups which absorb light in a molecule are known as Chromophores. Large number of Chromophores increases absorbance. Absorbance is a measure of the amount of light absorbed of a particular wavelength. The sigma bond, pi-bond is strongly delocalized (certain electrons are not attached to particular molecules; not location – specific). Same structures with different arrangement and bond angles have disparate resonant stability. The greater the delocalization, the longer the wavelength of light absorbed thus, reducing the energy. Their spectral property is determined by resonant stability of each molecule. This depends primarily on the structure, energy and type of molecular orbital it has.
There are two major molecular orbitals: the Highest Occupied, HOMO and Lowest Unoccupied, LUMO.
The most important jumps are (Fig. 1) from:
IJSER © 2015 http://www.ijser.org
International Journal of Scientific & Engineering Research, Volume 6, Issue 3, March-2015 687
ISSN 2229-5518
• Pi bonding orbitals to pi anti-bonding orbitals;
• Non-bonding orbitals to pi anti-bonding orbitals;
• Non-bonding orbitals to sigma anti-bonding orbitals.
The type of bond present [9] in C19H18O11 is: C=O, C-O, C-OH, C=OH, C=C, C-C, single O lone pairs, double oxygen lone pair. C=C, C-C is common in all hydrocarbons so, it serves no unique value here.
The important bonds are C=O and C=OH since they are [9], [44] the pi bonds.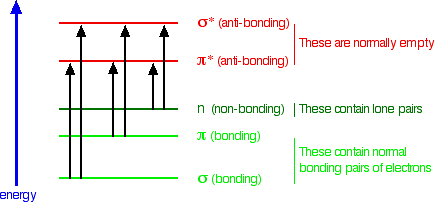
Fig. 1: The molecular orbitals and their energy level (whreusch@msu.edu. 30/10/14 at 9:00 a.m.)
Fig. 2 has four wavelength peaks. Wavelengths 220nm and 274nm does not lie in the visible spectrum of light. It is in ultraviolet (UV) range and so will not show any visible sign of light being absorbed. C19H18O11 has no non-bonding pair so; the electron jumps will be from pi bonding (double bond) orbitals to pi anti-bonding orbitals (see fig. 1).As
delocalization increases, wavelength increases and frequency decreases. Thus, less energy [9], [44] is required for absorption. In C19H18O11 molecule, there are seven pi-bonds. The sigma (single bonds) has a larger band gap requiring higher energy for electron jump.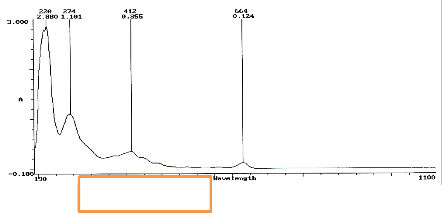
A b s o r b a n c e
![]()
Wavelength (nm)
Figure 3 has one prominent wavelength- peak. The other three peaks are not very distinct. This might be due to the grain morphology and texture [24] of the M. indica L. dye particles after deposition for two days. This is a function of the ratio of oxygen atoms on the slides impeding SGT of M. indica L.: J oxygen / J M. indica L. [36].
IJSER © 2015 http://www.ijser.org
International Journal of Scientific & Engineering Research, Volume 6, Issue 3, March-2015 688
ISSN 2229-5518
A b s o r b a n c
e
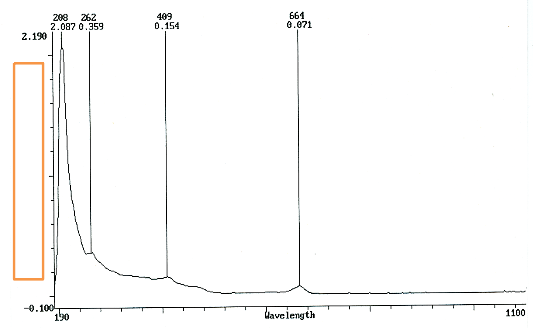
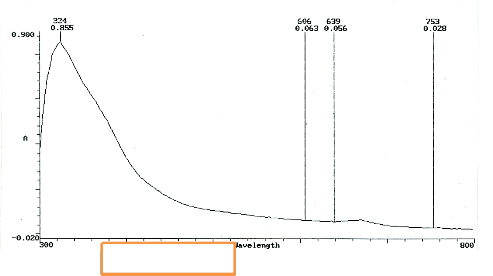
Figure 4 recognizes one prominent peak and three that are not distinct. A seemingly small peak goes unidentified (between
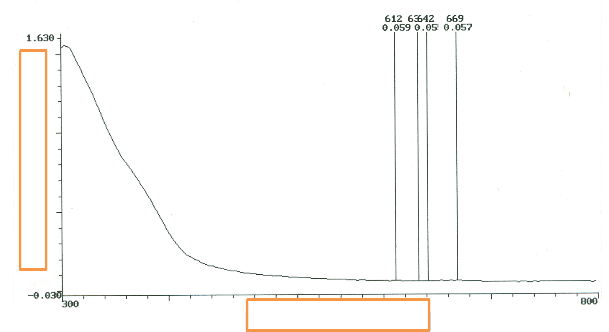
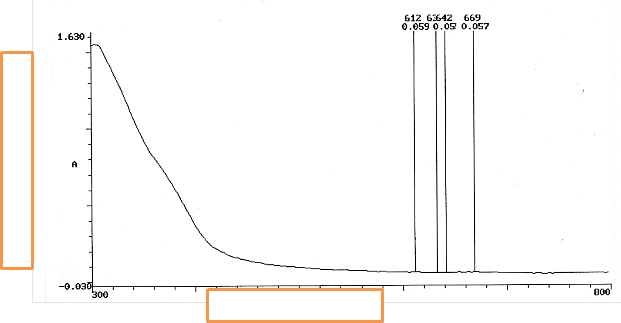
633nm and 795nm). This may be due to all aspects of homoepitaxial growth is influenced by small amounts of oxygen during the deposition. The partial pressure exerted by oxygen molecules influence this anomalous feature.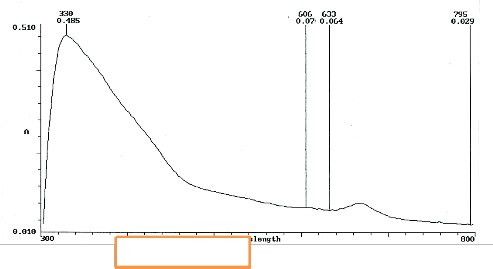
A b s o r b a n c
e
![]()
Wavelength (nm)
Fig. 4 UV/ Vis absorption spectra of M. indica L.
Figure 5 has one prominent wavelength- peak at 224nm. The remaining three peaks are not distinguishable. The undefined peak in fig. 3 is diminished [36], [37]. A strong possibility exists that the grain morphology combined with the surface structure of the substrate is responsible. Results [38], [39] show that molecules of gases show a tendency to adsorb. This has a high probability at sites of defects or Island edges. This is after six days of observation of SGT.
IJSER © 2015 http://www.ijser.org
International Journal of Scientific & Engineering Research, Volume 6, Issue 3, March-2015 689
ISSN 2229-5518
A b s o r b a n c e
![]()
Wavelength (nm)
Figure 6 is the UV/vis of P . macrophylla after 24 hours. It is parabolic in nature- half of a parabola. The set of all points equidistant from a given line should give a parabola. Disparity observed in the shape structure may be due to variation of shape with the edge of migration. Distance of adatoms is a function of diffusion- bulk migration.
A b s o r b a n c
e
Wavelength (nm)
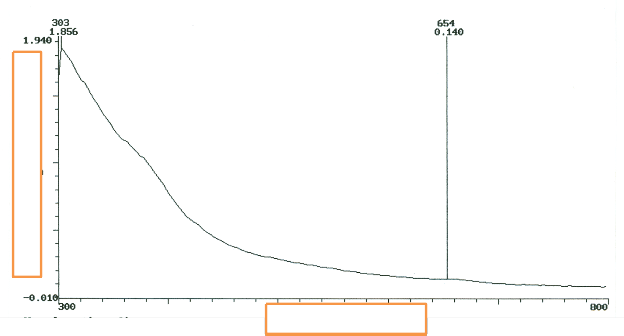
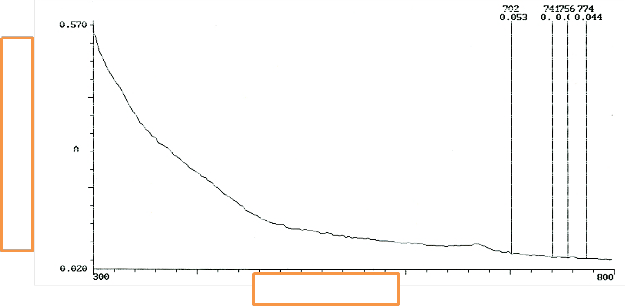
Fig. 7 retains the parabolic shape. The disparity here becomes more pronounced after 2 days of SGT. Atomic [38] process is because of nucleation and competitive growth of constituent’s phases.
IJSER © 2015 http://www.ijser.org
International Journal of Scientific & Engineering Research, Volume 6, Issue 3, March-2015 690
ISSN 2229-5518
A b s o r b a n c
e
Wavelength (nm)
Fig. 7. UV/vis of P. macrophylla
In Figure 8, the morphology of the molecules on P. macrophylla impinging on the surface of the glass [37], [38]
might be responsible for the variation of the shape.
A b s o r b a n c
e
Wavelength (nm)
In figure 9, the SGT has occurred for six days, the uneven slope is attributed to the orientation as well as the texture of the P. macrophylla particles.
IJSER © 2015 http://www.ijser.org
International Journal of Scientific & Engineering Research, Volume 6, Issue 3, March-2015 691
ISSN 2229-5518
A b s o r b a n c
e
Wavelength (nm)
The thin film characteristics vary with Phase state, morphology of particles and surfaces, chemical composition, homogenuity, substrate-film interface , structure of molecules ,texture and orientation of molecules of the M. indica L. or P. macrophylla dye pigments [39], [41]. In elemental thin films[41], results show that correlation exists between molecular size, morphology, surface topography and texture.
Table [1] shows the phytochemical screening [26], [27] of eight leaf samples. Flavonoids [3], and anthraquinones [10], were highly present in M. indica L. and P. macrophylla. The main components of these leaf extracts is chlorophyll embedded in the chromophores [13]. The chemical adsorption of these dyes is attributed to the condensation of the methanol bound with the interface of the hydroxyl group from the dye pigment on the glass substrate. This result is confirmed in the spectrographs [31], [33]. The Mayer, Wagner, Dragendorff’s test is to check for the presence of alkaloids. The shinoda test is to test for flavonoids, cardiac glycosides tests for anthraquinones. Tannins indicate if the plant part secretes resin or gum. Newbouldia, African Apple, Yellow trumpet bush, palm frond and, zobo leaf did not have flavonoids nor anthraquinones. Palm frond, Bauhinia Bowkeri and yellow trumpet bush have alkaloids in them, but they are low in chromophores.
Table 1 and 2 depicts the leaf samples in yellow. Olive green accent represents the leaf pigments where chromophores were absent (see table below). Red colour is for samples rich in chromophores. The pink hue shows the specific chromophores. UV spectra for this group correspond to the highest wavelength-peaks in nanometers. This group also has the highest absorbance. Sky–blue indicates samples-weak in chromophores.
IJSER © 2015 http://www.ijser.org
International Journal of Scientific & Engineering Research, Volume 6, Issue 3, March-2015 692
ISSN 2229-5518
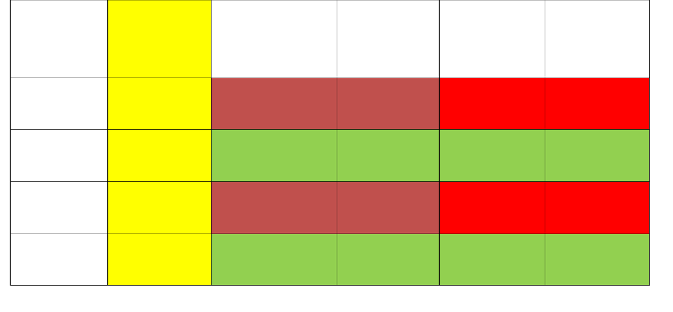
Sample | Name | Test for Tannins | Shinoda Test | Acid Test | Caponins | Cardiac Glycosides | Mayer Test | Wagner Test | Drangendorff Test |
5 | Palm frond | Nil | Nil | ++ | + | + | + | + | + |
6 | Bauhinia Bowkeri | Nil | ++ | +++ | Nil | + | ++ | ++ | ++ |
7 | Yellow trumpet bush | Nil | Nil | Nil | Nil | + | ++ | ++ | ++ |
8 | Zobo leaf | Nil | Nil | + | Nil | + | Nil | Nil | Nil |
+++ =very highly present; ++ = highly present; + = marginally present; - = absent
The percentage yield [16], [35] of the two most prominent samples is given below. The ratio [21] of the initial mass of the sample to the final mass of dye obtained is referred to as the percentage yield of the substance (compare Tables 3 and 4).
IJSER © 2015 http://www.ijser.org
International Journal of Scientific & Engineering Research, Volume 6, Issue 3, March-2015 693
ISSN 2229-5518
Faction | Mass (in g) |
Hexane | 78.264 |
Ethyl Acetate | 1.510 |
Aqueous | 10.000 |
Crude | 226.873 |
Total yield of mango layers | 316.647 |
% Yield | 11.5% |
Faction | Mass (in g) |
Hexane | 51. 030 |
Ethyl Acetate | 1. 456 |
Aqueous | 7. 999 |
Crude | 8. 940 |
Total yield | 69. 425 |
% Yield | 2. 3% |
M. indica has five times yield than P. macrophylla (see blue and olive green indicator on Table 3and 4). The percentage yield does
not have the same interpretation as the efficiency of a dye sensitized solar cell (DSSC), [21].
The relationship of Transmittance (T), Absorbance (A) and Reflectance (R) is given by the expression: T + A + R = 100% (law of conservation of energy; in a closed system, where there is no loss of energy to the surrounding). In Table 5, M. indica L.’s transmittance increases (purple highlight) while absorbance (pink highlight) decreases, the reflectance (yellow also decreases). We observed (table 6) an inverse relationship between the three parameters; T, A and R. When T is increasing (blue highlight), absorbance (orange accent) is decreasing, the reflectance (olive colour) is unpredictable, it depends on the incident radiation left after absorbance has occurred. The green colour indicates departure from norm in the result.
Sample Number | Transmittance (%) | Absorbance | Reflectance | ||||
Sample Number | Transmittance (%) | (Au) | (%) | ||||
B2 | 12.80 | 0.14 | 73.20 | ||||
B3 | 22.80 | 0.11 | 66.20 |
![]()
IJSER © 2015 http://www.ijser.org
International Journal of Scientific & Engineering Research, Volume 6, Issue 3, March-2015 694
![]()
ISSN 2229-5518
B4 | 27.40 | 0.097 | 62.90 | |||
B5 | 42.60 | 0.089 | 48.50 | |||
B6 | 59.60 | 0.013 | 39.10 | |||
B7 | 62.40 | 0.057 | 31.90 |
Table 6: Reflectance against Absorbance of P. macrophyllaThin film
Sample No | Transmittance (at 400nm) | Absorbance (nm) | Reflectance (%) |
A2 | 44.10 | 0.825 | -26.60 |
A3 | 52.30 | 0.07 | 40.70 |
A4 | 52.90 | 0.059 | 41.20 |
A5 | 56.10 | 0.051 | 38.80 |
A6 | 70.70 | 0.289 | 0.40 |
A7 | 76.80 | 0.047 | 18.50 |
This might be due to grain [42] boundaries-they act as defects within the molecular structure. They may also serve as localized
sites for defect collection (fig. 10) - there is improvement in quality of structure of dye molecule. In most thin film grain boundaries, atomic periodicity is interrupted on a free surface like this. This condition may account for such an occurrence. The graph (fig. 10) shows a negative slope, an inverse relationship between Reflectance and Absorbance for P. macrophylla. High absorbance yields low reflectance.
IJSER © 2015 http://www.ijser.org
International Journal of Scientific & Engineering Research, Volume 6, Issue 3, March-2015 695
ISSN 2229-5518
50.00%
40.00%
30.00%
20.00%![]()
Reflectance
10.00%
0.00%
-10.00%
-20.00%
0 0.5 1 1.5![]()
Reflectance against
Absorbance![]()
Linear ( Reflectance)
-30.00%
-40.00%
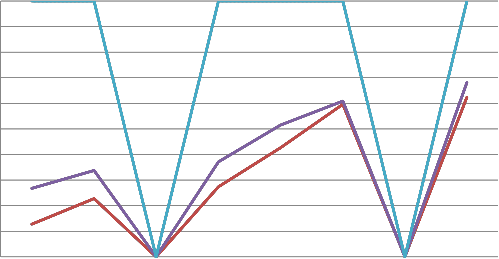
The inverse relationship between the transmittance and reflectance occurs when transmittance is at 400nm. We observed that, when the reflectance is minimal, absorbance is maximal. Also, Low reflectance occurs at high values of absorbance. An interesting discovery is a point of equality (Fig. 11) of transmittance and reflectance. Transmittance has a value of 45%; it implies the incident radiation is not the primary determinant at this point [15], [39], [40], [41]. The absorbance and reflectance also have three points of coincidences. After one, four and five days of SGT, absorbance/reflectance value(s) was 30%, 20%, and 10%respectively. At these points, transmittance experiences a
positive skew.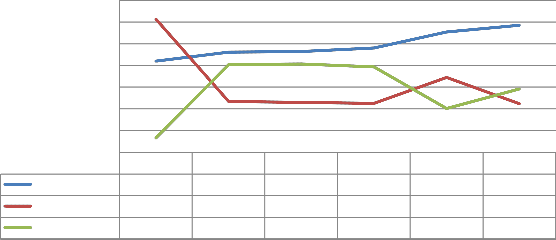
100.00%
80.00%
60.00%
40.00%
20.00%
0.00%
-20.00%
-40.00%
T against A and R for P.macrophylla
Fig. 11: Transmittance against Absorbance and Reflectance of P. macrophylla
IJSER © 2015 http://www.ijser.org
International Journal of Scientific & Engineering Research, Volume 6, Issue 3, March-2015 696
ISSN 2229-5518
From the graph of transmittance against absorbance, M. indica L. is high in transmittance at 400nm and low in absorbance at the same wavelength [17], [18], [19]. The transmittance increased with the number of days the glass slides were soaked, and it has
an inverse relationship with the absorbance difference.
In fig. 12, the trend is a direct relationship between the absorbance and reflectance values. A disparity occurs on day three and
seven, the transmittance, reflectance and absorbance coincide. This condition might be explained by various analytical methods [41], [42], [43], [44] like Scanning Capacitance Microscopy (SCM), Scanning Kelvin Probe Microscopy (SKPM), Conductive probe atomic force microscopy (CP-AFM) and Orientation Imaging Microscopy (OIM). The missing link to understanding the relationships-film processing, deposition and photovoltaic performance is given by the measurements from these instruments.
100%
90%
80%
70%
60%
50%
40%
30%
20%
10%
0%
Reflectance, 31.90%
Abs nm, 0, 0.057
T in%, 62,.040%
1 2 3 4 5 6 7 8
Eight tropical plant leaves extract were tested for chromophores. The M. indica L. and P. macrophylla showed the presence of flavonoids, anthraquinones. The M. indica L. and the P. macrophylla is high in transmittance of incident radiation and low in absorbance. The M. indica dye thin film would be more economical for use due to its higher yield (see table 2). The two thin films have widely varying properties [42], [43], [44] at 400nm- molecular structure, grain size and grain boundary character. However, M. indica L. would suit a wider range of purposes than the P. macrophylla, (fig. 6). P. macrophylla has a constant value for minimum range - where there is a need for regulated temperature over a long period of time.
ACKNOWLEDGEMENT
The authors wish to thank the staff of the chemistry research laboratory and instrumentation laboratory of the chemistry department of the Covenant University.
IJSER © 2015 http://www.ijser.org
International Journal of Scientific & Engineering Research, Volume 6, Issue 3, March-2015 697
ISSN 2229-5518
REFERENCES
[1] O’Reagan, B., Grӓtzel, M. A low cost, high efficiency solar cell based on dye-sensitized colloidal TiO 2 films, Nature 353 (1991) 737-740.
[2] Zhang, G., Bal, H., Cheng, Y., Shi, D., Lv, X., Yu, Q., Wang, P. High efficiency and stable dye-sensitized solar cells with an organic chromophore
featuring a binary π-conjugated spacer, chem. commun. (2009) 2198-2200.
[3] Selles, A. J. N., Castro, H. T. V., Aguero-Aguero, J., Gonzalez-Gonzalez, J., Naddeo, F., de Simone, F, and Rastrelli, L. Isolation and quantitative analysis of phenolic antioxidants, free sugars, and polyols from mango (Mangifera indica L.) stem bark aqueous decoction used in Cuba as a nutritional supplement. J. Agric. Food Chem. (2002), 50, 762–766.
[4] Lamontagne, B., Pedro Barrios, P., Py ,C., and Nikumb, S. (2009) . "The next generation of switchable glass: the Micro-Blinds". GLASS PERFORMANCE DAYS (2009) 637–639.
[5] Knittl, Z. (1981). Optics of Thin Film. (An Optical Multilayer Theory).
[6] Moreno, Ivan; Araiza, JJ; Avendano-Alejo, M (2005). "Thin-film spatial filters". Optics Letters 30 (8): 914–6.
[7] Huiberts, N.; Griessen R., Rector J. H., Wijngaarden R. J., Dekker J. P., De Groot D. G., Koeman N. J. (1996). "Yttrium and lanthanum hydride films with switchable optical properties". Nature 380: 231–234.
[8] Smart Glass Market by Technology (Electrochromics, SPD, Liquid Crystal, Microblinds, Thermographic and Photochromics), Application
(Architectural, Transportation, Solar power generation, Electronics & others), & by Geography – Global Forecast to 2014 – 2020 [9] Petrucci, R. H., Herring, F. G., Madura, J . D., Bissonnette.C. (2014). General Chemistry: Principles and Modern Applications
[10] Zhou, H. , Wu, L. ,Gao, Y, and Ma, T. “Dye-sensitized solar cells using 20 natural dyes as sensitizers,” Journal of Photochemistry and Photobiology
A, (2011) , 219: 2-3, 188–194.
[11] Zhang, D. , Lanier, S. M., Downing, J. A. , Avent, J. L., Lum, J., and McHale, J. L. “Betalain pigments for dye-sensitized solar cells,” Journal of
Photochemistry and Photobiology A, (2008) 195: 1, 72–80.
[12] Law M., Greene L. E. , Johnson J. C. , Saykally, R. andYang P. , Nat Mater. (2005): 4, 455-59.
[13] Batniji, A. Y., Morjan, R., Abdel-Latif, M. S., El-Agez, T. M. , Taya, S. A. , and Hatem S. El-Ghamri, “Aldimine derivatives as photosensitizers for dye-sensitized solar cells”, Turkish Journal of Physics (2014) : 38, 86–90.
[14] Calogero, G and Di. Marco, G. “Red Sicilian orange and purple eggplant fruits as natural sensitizers for dye-sensitized solar cells”, Sol. Energ. Mat. Sol. C. (2008): 92, 1341–1346.
[15] Wongcharee, K.,Meeyoo, V and Chavadej, S. “Dye-sensitized solar cell using natural dyes extracted from rosella and blue pea flowers”, Sol. Energ. Mat. Sol. C. (2007): 91, 566–571.
[16] Roy, M. S. ,Balraju, P. , Kumar, M and Sharma,G. D. “Dye-sensitized solar cell based on Rose Bengal dye and nanocrystalline TiO2”, Sol. Energ.
Mat. Sol. C. (2008): 92, 909–913.
[17] Wang, Z., Cui,Y., Hara,K., Dan-oh,Y., Kasada, C and Shinpo, A. “A high-light harvesting-efficiency coumarin dye for stable dye-sensitized solar cells”, Adv. Mater. (2007):19, 1138-1141.
[18] Etula, J. “Comparison of three Finnish berries as sensitizers in a dye-sensitized solar cell”, European Journal for Young Scientists and
Engineers, (2012): 1, 5-23.
[19] Ahmadian,R. “Estimating the impact of dye concentration on the photo electrochemical performance of anthocyanin-sensitized solar cells: a power law model”, Journal of photonics for energy. (2011): 1, 12-15.
[20] Hernández-Martínez, A. R., Estevez , M. , Vargas,S. , Quintanilla,F and Rodríguez, R. “Natural Pigment-Based Dye-Sensitized Solar Cells”, 1st
international congress on instrumentations and applied sciences, (2012) : 10, 1665-6423. [21] O’regan B and Gratzel M. Nature. (1991): 353, 737-40.
[22] Stathatos E., LianosP. ,Zakeeruddin, S., Liska,P. and Gratzel, M. Chemistry of materials. (2003): 15, 1825-29.
[23] Greene L. E. et. al. AngewandteChemie International Edition. (2003): 42, 3031-34.
[24] Konno, T. J., and Sinclair, R. "Crystallization of Silicon in Aluminum/Amorphous-Silicon Multilayers", Philos. Mag. B (1992): 66, 749-765.
[25] Burschka, J., Pellet, N., Moon, S. et al. “Sequential deposition as a route to high-performance perovskite-sensitized solar cells.” Nature (2013:
vol. 499 (7458), 316–319.
[26] Benmehdi, H., Hasnaoui, O., Benali, O., Salhi, F. Phytochemical investigation of leaves and fruits extracts of Chamaeropshumilis L. J. Mater. Environ. Sci. 3 (2) (2012) 320-237.
[27] Ajayi I. A., Ajibade O. and Oderinde R. A. Preliminary Phytochemical Analysis of some Plant Seeds . Res. J. Chem. Sci. Research Journal of
Chemical Sciences (2011): 1 (3).
[28] Hao, S., Wu, J., Huang, Y. and Lin, J. Natural dyes as photosensitizers for dye-sensitized solar cell, Sol. Energy 80 (2006) 209-214.
[29] Yongan, C., John C. W. H., Sudip K. B., Wei, L., Yun, S., Subodh, G. and Lydia H. W. Nanoparticle-Induced Grain Growth of Carbon-Free
Solution-Processed CuIn (S,Se) 2 Solar Cell with 6% Efficiency. Applied materials and interfaces, ACS Appl. Mater. Interfaces (2013): 5 (5), 1533–1537.
IJSER © 2015 http://www.ijser.org
International Journal of Scientific & Engineering Research, Volume 6, Issue 3, March-2015 698
ISSN 2229-5518
[30] Jafarzadeh, S. Shafiei, A. Ebadi, M. and Abdoli: Batch Separation of Styrene/Ethyl Benzene/Water Dispersions; Iranian Journal of Chemical
Engineering (2010): 7 (4), NoIAChE.
[31] Buscaino, R., Baiocchi, C., Barolo, C., Medana, C., Grӓtzel, M., Nazeeruddin, Md. K. G. and Viscardi, G. A mass spectrometric analysis of sensitizer solution used for dye- sensitized solar cell, Inorg. Chim. Acta 361 (2008) 798-805.
[32] Tiwari*, P., Kumar . B., Kaur, M., Kaur, G and Kaur, H: Phytochemical screening and Extraction: A Review; INTERNATIONALE PHARMACEUTICA SCIENCIA (2011): 1 (1)
[33] Barreto, J. C., Trevisan, M. T. S., Hull, W. E., Erben, G., de Brito, E. S., Pfundstein, B., Wurtele, G., Spiegelhalder, B. and Owen, R. W.
Characterization and quantitation of polyphenolic compounds in bark, kernel, leaves, and peel of mango (M. indicaL.) . J. Agric. Food Chem. (2008):
56, 5599–5610.
[34] Berardini, N., Knodler, M., Schieber, A. and Carle, R. Utilization of mango peels as a source of pectin and polyphenolics. Innov. Food Sci. Emerg. (2005): 6, 442–452.
[35] Luo, F. , Lv, Q. , Zhao, Y. , Hu, G. , Huang , G. , Zhang ,J. , Sun, C. , Li, X. , and Chen , K. Quantification and Purification of Mangiferin from Chinese Mango (M. indica L.) Cultivars and Its Protective Effect on Human Umbilical Vein Endothelial Cells under H2O2-induced Stress; Int. J. Mol. Sci. (2012): 13, 11260-11274.
[36] Barna, P. B., Adamik, M., Petrov, I., Barna, P. B., Hultman, L. and Greene, J. E. Thin Solid Films, (1998): 31727; J. Vac. Sci. Technol. (2003): 21, S117.
[37] Kalff, M. , Comsa, G. and Michely, Th. Effect of CO adsorption on the growth of Pt on Pt (111) surface at 400 K (1998) : PRL 81,1255.
[38] Barna, P. B. History of Thin Films, (2005). Advanced Materials Science and Electron microscopy.
[39] Kalff, M., Comsa, G. andMichely, Th. Effect of CO adsorption on the growth of Pt on Pt (111) surface at 400 K (1998): PRL 81, 1255. [40] Eckertova, Ed. L., Ruzicka, I. P. and Barna, P. B. In Diagnostics and Application of thin films, IOP (1992) 295.
[41] Barna, P. B. Proceeding 9th International Vacuum Congress, Madrid (1983) 382.
[42] Feibelman, P. J. P R B (1999) : 60, 4972.
[43] Nowell. M. M. Microstructural Characterization of Thin Film Photovoltaics using Electron Backscatter Diffraction. EDAX-TSL
INTERNET LINKS
[44] http://www2.chemistry.msu.edu/faculty/reusch/virttxtjml/spectrpy/uv-vis/spectrum.htm
DETAILED SUBMISSION GUIDELINES CAN BE FOUND ON THE AUTHOR RESOURCES WEB PAGES. AUTHOR RESOURCE GUIDELINES ARE SPECIFIC TO EACH JOURNAL, SO PLEASE BE SURE TO REFER TO THE CORRECT JOURNAL WHEN SEEKING INFORMATION. ALL AUTHORS ARE RESPONSIBLE FOR UNDERSTANDING THESE GUIDELINES BEFORE SUBMITTING THEIR MANUSCRIPT. FOR FURTHER INFORMATION ON BOTH SUBMISSION GUIDELINES, AUTHORS ARE STRONGLY ENCOURAGED TO REFER TO
IJSER © 2015 http://www.ijser.org