modern instrumentation techniques like FTIR, X-ray diffraction, scanning electron microscopy [SEM]. An attempt also was made to study the effect of liquid NBR as dispersion media for nano-silica.
International Journal of Scientific & Engineering Research, Volume 5, Issue 2, February-2014 856
ISSN 2229-5518
1Indian Rubber Manufacturer’s Research Association, Thane- M.S., 400604, India
2* R&D Centre, Bharathiar University, Coimbatore, T N, India
*Corresponding Author: rk@irmra.org
IJSER © 2014 http://www.ijser.org
International Journal of Scientific & Engineering Research, Volume 5, Issue 2, February-2014 857
ISSN 2229-5518
Polymer-silica nano-composites have drawn great interest from both industry and academia, because they often produce remarkable improvement in material properties at very low silica loading in contrast to the traditional fillers like carbon, silica etc., nano-fillers are found to be effective even at as low as 5-wt% loading. Polymer nano-composites having a two phase materials with the reinforcing phase having at least one dimension in the range of 10-9 m scale. The outstanding reinforcement of nanocomposites is primarily attributed to because of their very high surface area to volume ratio and exceptional properties. The reinforcing components are mostly nanoclay, nano silica, graphite, carbon nanotubes (CNT) etc. Materials with combination of nano-sized organic / inorganic materials and polymers expected to give the properties that are synergistic combinations of the individual components. Thermodynamic compatibility between the two phases, achieved through component selection or the introduction of functional groups at the interface, both strengthens the interface and reduces phase size. While this may be true, with the introduction of the new generation of nano-fillers comes with the possibility of enhancing the polymer-nano particle interaction by orders of magnitude. The resulting polymer nano composites thus comprise fillers embedded in a polymerized medium which can be subsequently cross linked, to obtain vulcanized rubber. K.Rajkumar et al studied the effect of increasing nanographite loading in NBR based polymer Nano composites on mechanical properties like tensile strength, modulus and Elongation at break, thermal stability etc has been studied. Elastomers are reinforced with fillers to improve their performance by incorporating materials conventional fillers such as carbon blacks, silica, clay, talc and
calcium carbonate etc. In recent trends,
Nanocomposites made out of nano fillers have been shown to afford remarkable property enhancements compared to conventional micro composites [1–3] which are made using conventional fillers. Polymer nanocomposites with layered silicates [4–9] and carbon nanotubes [10–12] have attracted major interest for the improvement of structural properties and the development of new materials having different functional properties. Nano-graphite is a layered material with high aspect ratio in its exfoliated state; it is also considered as one of the strongest materials per unit weight and has unique functional properties (e.g. good electrical and thermal conductivities, and good lubricating properties). Rajkumar et al studied that NBR-Nano graphite polymer nano composites were found to increase its thermal stability [13]
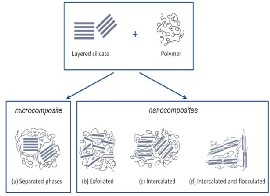
This new class of material involves nano-scale dispersion in a polymer matrix, which lead to improved properties over regular composites. Complete dispersion or exfoliation of clay layers in monomer or polymer may comprise up to three steps similar to dispersion of powder in liquid described by Parfitt [14]. The first step is wetting the surface of nano silica by polymer molecules. Secondly, intercalation or infiltration of polymer takes place, followed by third step, exfoliation of clay layers. Thermodynamic control the first and second steps, while mechanical and reaction driving forces determine the extent of third step. Depending upon the strength of interfacial interaction between a polymer matrix and the silicate layers, three types of polymer composites may be formed as shown in Fig. 1
IJSER © 2014 http://www.ijser.org
International Journal of Scientific & Engineering Research, Volume 5, Issue 2, February-2014 858
ISSN 2229-5518
modern instrumentation techniques like FTIR, X-ray diffraction, scanning electron microscopy [SEM]. An attempt also was made to study the effect of liquid NBR as dispersion media for nano-silica.
Silica nano-composites contain individual nano-layers separated in a continuous polymer matrix by average distance which depends on the loading of silica. There are very few studies on using hydrogenated nitrile rubber and nano fillers [15].
The effect of curative package shows an interesting effect on the morphology of nano-composites. The sulfur vulcanization in combination with primary amine intercalants of silica produces a confined silica structure, while the peroxide curing yields well-ordered intercalated nano-composites.
In this research work HNBR-based Nano-composite was prepared using nano-silica as thermal resistant filler and they are characterized using mechanical, thermal properties and morphological studies. The dispersion of the filler in the polymer matrix was studied using the
Hydrogenated Acrylonitrile Butadiene Rubber, Liquid NBR, Nano-silica powder, obtained from Nano-shell USA, vapourlink [from 20 micron], and other ingredients like Clay, DCP 40, Stearic Acid, ZnO etc were obtained from reputed manufacturers and used for studies.
Product Name | HNBR |
Mooney Viscosity, ML1+4@100o C | 68 |
Bound CAN content, Wt. (%) | 34 |
Ash Content, Wt. (%) | 5.5 |
Product Name | Nano Silica |
Surface Area | 300 (270-330) m2/g |
PH | 3.4-4.7 |
Moisture Content | <2 % |
SiO2 Content | 99.8% |
3186. The mill opening was set at 0.2 mm and the elastomer was passed once through the nip without banding. Then the rubber was banded on the front roll with mill opening at 1.4mm. The temperature of the rolls was maintained at 70+/-50 C. After the band became smooth, the nip gap was set to 1.9 mm. The compounding ingredients were added as per ASTM D
3186. Mixing of nano-silica filler in polymer were
carried out in two stages. In the first stage, the nano-
IJSER © 2014 http://www.ijser.org
International Journal of Scientific & Engineering Research, Volume 5, Issue 2, February-2014 859
ISSN 2229-5518
silica at different loading 1, 3 and 5 phr were mixed at ambient temperature in highly viscous liquid Nitrile Rubber [20 phr] and made into a paste like material which is known as “NBR-Nano-silica masterbatch”. In the second stage, the NBR-Nano-Silica masterbatch” was blended with HNBR base polymer and then mixed with other rubber compounding chemicals, as per the formulation given in table 2. During mixing sulphur was added in the polymer at initial stage as per conventional mixing cycle followed for NBR. The rubber compound mixes were then passed six times in two roll mill at nip gap of 0.8mm to get uniform HNBR nano-silica based rubber compound and finally sheeted out at a nip gap of 6mm by passing through the roll four times, folding it back on itself each times.
a Parts per hundred of rubber ;
b Hydrogenated Nitrile Rubber
The rheological properties of polymer nano compounds
were studied using Rubber Process Analyzer [RPA -
2000 Alpha Technologies] 150°C. The samples were allowed to heat at 1500C for 60 min at 100 cpm frequency and 3° strain and minimum torque, maximum torque, scorch time Ts2, optimum cure time were
recorded. The dynamic properties like minimum Tan
delta and maximum Tan delta of polymer nano compounds were also studied in the RPA study at 100 cpm frequency and 3°strain.
Polymer Nano compounds was kept for maturation for
16 hrs. Then the compounds were used for compression molding of sheets of 150 mm X 150 mm X 2mm thickness as per ASTM standard using hydraulic press at a temperature 150°C and the curing time as per the RPA data. The compression moulded sheets were used for various tests as per the ASTM standard.
3.3.3 Physical-mechanical properties
The tensile test specimen i.e dumbell punched out from the compression molded sheet using Die C as per ASTM D 412-98 method in a Universal Testing Machine (Zwick, UTM, Germany) for determining physico-mechanical properties at the cross head rate of
500 mm per minute at 250C. The average of three tests
is reported here. The ageing studies were carried out using hot air ageing oven at 200 °C for 24 hrs as per ASTM D 573 and changes in physico-mechanical properties were calculated.
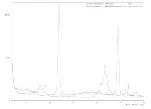
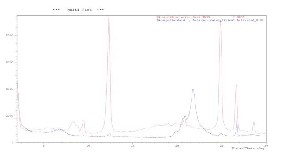
For characterization of silica and rubber nano-
composites X-ray diffraction studies were performed at room temperature using a Shimadzu X-ray Diffractometer [Model- XRD- 6000] as shown in Fig. 3 in the angular range of 0˚ to 30˚ of 2θ (SAXD). The data was analyzed in the range of 2˚ to 30˚ of 2θ for nano- composites. The d-spacing of the silica nano particles is determined as shown in Fig. 2 was calculated using Bragg’s law. The samples were placed vertically in front
IJSER © 2014 http://www.ijser.org
International Journal of Scientific & Engineering Research, Volume 5, Issue 2, February-2014 860
ISSN 2229-5518
of X-ray source. The detector was moving at an angle of
2θ, while the sample was moving at an angle of θ.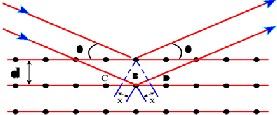

[XRD 6000]
The target was copper and (Cu Kα) radiation (λ=
1.540598˚A) was obtained on applying 40 KV voltage to the generator and the current was 30 mA. The basal spacing of nano graphite layers was estimated from the position of the plane peak in the SAXD intensity profile.
of Polymer nano composites:
The surface morphology of the various blends was investigated by EVO 18 series Scanning Electron Microscope (SEM) model of Zeiss make operating at an accelerated voltage of 20kv as shown in Fig.4. The samples surfaces were made conductive by sputter coating with gold and then examined under the SEM. The images were obtained at a tilt angle of 0o.
nano-composites was also performed in an Oxford EDX
system attached to the Scanning Electron microscopy.
Fourier transform infra-red spectroscopy study was done in Perkin-Elmer Spectrum RX1 (UK) as shown in Fig. 5 in a range of 400-4000 cm-1 by casting a very thin film on potassium bromide (KBr) pellet from the solution of rubber-nanocomposites.
Thermo gravimetric analysis was done using Perkin Elmer Instrument, Diamond TG-DTA,(Waltham, MA, USA) The samples (3-5 mg) were heated from ambient temperature to 800 °C in the furnace of the instrument under oxygen atmosphere at 100 ml/min and at a heating rate of 20 °C/min and the data of weight loss vs temperature were recorded. Although the experiments were recorded in nitrogen as well as air, there was a major difference amongst the samples when oxygen was used as the medium. The analysis of the thermo- gravimetric (TG) and derivative thermo-gravimetric curves (DTG) was done in oxygen and the onset temperature, weight loss at major degradation steps and temperature corresponding to the maximum value in the derivative thermograms were recorded. The temperature at which maximum degradation took place is denoted as Tmax and onset temperature of degradation is denoted as Ti.
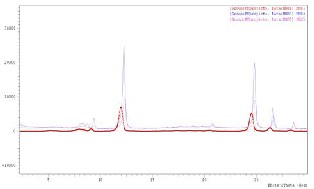
The X-Ray Diffractogram of different loading of the polymer nanocomposites are shown in Fig 4. As seen
spectra analysis d-spacing peaks of the polymer
IJSER © 2014 http://www.ijser.org
International Journal of Scientific & Engineering Research, Volume 5, Issue 2, February-2014 861
ISSN 2229-5518
nanocomposites are gradually increases on higher side | 35 |
this is due to the intercalation of the silica nano particles | 30 |
in the rubber composites. As seen from Fig. 4 (a), (b) | 25 |
nanocomposites and silica particles it can be seen that
indicate that the rubber chain enter the silicate layers, expanding the silicate gallery spacing.
15 Scorch Time
Cure Time
5
HNS-0 HNS-1 HNS-3 HNS-5
Nano Silica Loading
Polymer Nano-composites
Un-vulcanized properties of the nano-composites are given in table 3 as seen in the Fig. the results there is improvements in the scorch properties of the composites with the increasing loading of the nano fillers. As seen from the Fig. 5 cure time for the nano-composites is increases with increasing loading of the nano silica.
The physical properties like tensile strength, modulus and hardness of HNBR nanocomposites having increasing nano silica loadings are represented below in table 4. It can be observed that there is a steady increase in tensile strength with filler loadings of Nano-silica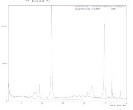
filler. Tensile strength can be regarded as catastrophic tearing of cracks initiated by micro voids, from filler surface. If the elastomeric network is capable of dissipating the input energy into heat, then less elastic energy will be available to break this polymer network.
IJSER © 2014 http://www.ijser.org
International Journal of Scientific & Engineering Research, Volume 5, Issue 2, February-2014 862
ISSN 2229-5518
Incorporation of fillers is the major source of energy dissipation. Increasing amounts of filler load to a large number of polymer chains to get adhered to the polymer. The increase in loading of nano-silica showed increase in Tensile strength and modulus properties due to reinforcement effect of filler-polymer interaction. Elongation at break also increases with loading of nano- filler because of the layer of silicate structure restrict the tearing of polymer molecules under stretching during tensile test. The hardness of nanocomposites increases with the increasing loading of fillers.
Mechanical Properties | Unit | HNS 0 | HNS 1 | HNS 3 | HNS 5 |
Tensile Strength | Mpa | 6.38 | 7.84 | 8.87 | 8.86 |
Modulus @ 100% | Mpa | 2.41 | 2.35 | 2.34 | 2.81 |
Elongation @ Break | % | 600 | 740 | 850 | 860 |
Hardness | Sh A | 55 | 59 | 65 | 69 |
In general, HNBR polymer is recommended for high temperature application, whereas in our study the heat resistance was also carried out at 200°C for 24 hrs and the results were tabulated in table 5. The results showed that retention of its tensile strength of polymer nanocomposites were much higher than that of unfilled HNBR vulcanizate due to effective polymer filler interaction. Polymer molecules were protected by the nano-silica filler layer with reaction of Nitrile group of HNBR and with silicate structure. Hence the degradation of polymer molecules was considerably reduced. The changes in hardness after ageing at 200°C for unfilled polymer was found to be much higher than
that of nano filled polymer composites. This
corroborates other finding of protection of polymer layers by the nano-Silica. Elongation at break for all composites was found to be less than 10 % after ageing due to conventional thermal ageing effect of polymers.
% Changes in properties | HNS 0 | HNS 3 | HNS 5 | HNS 7 |
Tensile Strength | -39 | -46 | -46 | -26 |
% Elongation at break | -83 | -85 | -88 | -93 |
Free energy of the mixing can be interpreted by the following;
By definition,
Where, ΔHg, ΔHC, ΔS g and ΔSC are the enthalpy and entropy increments associated with the mixing process for the elastomer and nano-fillers respectively.
From above equation, we can write free energy change of the system during mixing is;
ΔGS = ΔGE + ΔGC
= ΔHE + ΔHC – T (ΔSE + ΔSC )
= ΔHS -TΔSS
From the expression, ΔGS value will be negative and hence most favorable interaction between the nano- fillers and the rubber will take place, when ΔHS is negative and ΔSS is positive. ΔHS of the above equation has been calculated from different nano-composites from the FT-IR Spectra as shown in Fig.6 using Fowkes’s equation and the value are tabulated in
ΔHS = 0.236 x Δv
IJSER © 2014 http://www.ijser.org
International Journal of Scientific & Engineering Research, Volume 5, Issue 2, February-2014 863
ISSN 2229-5518
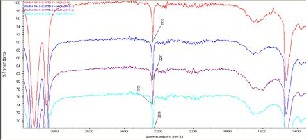
As depicted in Fig 6 the peak for acrylonitrile group of unfilled rubber H-0 appears at 2235 cm-1. However, for the nano-composites, this peak is shifted to 2237 cm-1,
2238 cm1 2239 cm-1 respectively. The shift in the peak
indicates the level of interaction between the polymer and the filler in line with the observation on the system. The above thermodynamic phenomenon explains why improvement of mechanical and thermal ageing properties. It is well known that mixing of two components is most favorable when free energy change of the system is negative.
Table 6: Values of ΔHS for different nanocomposites
HNBR and its nano-composites is done.. The value of Ti, (initial) and Tmax, (maximum) temperature of degradation after complete degradation tabulated in table 7. As evident from the results & DTG curves degradation temperatures for the neat rubber one at
4960C. The occurrence of small humps in the case of
neat HNBR indicates formation of different stable intermediate products during oxidation.
The nanocomposites, shows almost the single step degradation with well-defined initial and final degradation temperature, which may be results of scission of main macromolecular chains. Shift in Tmax value towards higher
i max
studies
Understanding the effect of unfilled and nano-silica filler on the kinetics of degradation of HNBR nano- composites is included in the scope of the present study. Emphasis has also been given to find out the degradation mechanism of HNBR in presence of these special fillers by allowing the polymer to degrade in severe as well as degradation kinetics of HNBR-filler
nanocomposites. Heating rate of 200C/min for neat
Mapping
IJSER © 2014 http://www.ijser.org
International Journal of Scientific & Engineering Research, Volume 5, Issue 2, February-2014 864
ISSN 2229-5518
The effect of addition of nano-silica fillers in HNBR Nanocomposites using liquid NBR as dispersion media was investigated. Thermo-gravimetric analysis, it has been found that addition of nano-silica increases thermal stability which is also corroborated by the retention of physico-mechanical properties even after ageing at 200° C for 24 hrs. The improvement in dispersion of nano silica using liq. NBR as dispersion media has been confirmed through FTIR studies wherein shifting of characteristic peaks of HNBR towards higher side, indicates the level of interaction between the polymer and the filler. Using FTIR based Fowkes equation explained that mixing of two components is most favorable when free energy change of the system is negative, which was characterized by mechanical properties. Polymer nanocomposites were further characterized by X ray Diffraction studies, which showed that there is a shift in the 2θ value towards higher side, indicating intercalation of rubber chains in the silicate layers, expanding the silicate gallery spacing. EDS mapping of SEM image showed the well distributed nano silica particles in the polymer matrix also confirms the findings of FTIR and thermal characterization of polymer nanocomposites.
IJSER © 2014 http://www.ijser.org
International Journal of Scientific & Engineering Research, Volume 5, Issue 2, February-2014 865
ISSN 2229-5518
1. B.M.Novak, Adv. Mater. 5, 422 (1993)
2. J.E. Mark, Polym Eng Sci. 36, 2905 (1996)
3. D.Vollath and D.V.Szabo, Adv Eng Mater. 6,117 (2004)
4. P.B.Messersmith, E.P.Giannelis. Chem Mater.5, 1064 (1993)
5. E.P.Giannelis, Adv Mater. 8, 29 (1996)
6. C.Zilg, R.Thomann, J.Finter, R.Mulhaupt, Macromol Mater Eng, 41, 280 (2000)
7. S.S.Ray and M.Okamoto. Prog Polym Sci, 28,1539, (2003)
8. A.Usuki, N.Hasegawa, M.Kato. Adv Polym Sci, 179,135 (2005)
9. Y.P. Wu, Y.Q.Wang, H.F.Zhang, Y.Z.Wang, D.S.Yu, L.Q.Zhang. Compos Sci Technol, 65, 1195 (2005)
10. P.M.Ajayan, O.Z. Zhou.Topics Appl Phys,80, 391(2001)
11. L. Dai, A.W.H. Mau. Adv Mater, 13,899 (2001)
12. J.N.Coleman, U.Khan, Y.K.Gunoko. Adv Mater, 18, 689 (2006)
13. K.Rajkumar et al /Int.J. ChemTech Res. 2011, 3(3) Vol. 3, No.3, pp 1343-1348,
14. S.Stankovich, D.A. Dikin, G.H.B.Dommett, K.M.Kohlhaas, E.J.Zimney, E.A.Stach. Nature
442,282(2006)
15. J.W. Shen, X.M.Chen, W.Y.Huang. J Appl Polym Sci, 88, 1864 (2003)
IJSER © 2014 http://www.ijser.org