International Journal of Scientific & Engineering Research Volume 2, Issue 7, July-2011 1
ISSN 2229-5518
Photovoltaic Systems in Existing Residential
Building in Egypt
Adel El-Menchawy, Hesham Bassioni, Abdel-Aziz Farouk
Abstract - Recently, world has become more conscious about the environment, changes occurring in climate and in earth in general. It started to pay more attention to the impact of the technological and industrial revolution on the ecology and human health, which resulted in directing all the new researches towards renewable energy and recycling mat erials. In the developm ent of energy sources in Egypt of the 21st century, it is necessary to view the use of solar energy in all applications as one of the most promising new and renewable energy sources. This paper presents a study and design of a com plete phot ovoltaic system for providing the electrical loads in an existing family house according to their energy requirem ent. It is found that providing electricity to a family house in a rural zone using photovoltaic system s are very beneficial and com petitive with the other types of conventional energy sources, especially considering the decreasing prices of these systems and their increasing efficiencies and reliability. They have also the advant age of maintaining a clean environment. These principals are applied in the case study (Renovation of the
existing staff housing unit at Wardan railways training institut e, 6 of October, Egypt) and calculated the life cycle cost of the proposed alternatives.
Keywords - Ecology, Life Cycle Cost, Photovoltaic, Renewable Energy
1 INTRODUCTION
—————————— • ——————————
ttention to living sustainably requires us to actively be aware of the environmental, social and economic needs of our present generation. Solar energy is expected to play a very important role in meeting energy demands
in the near future.
Since it is a clean type of energy with a diversity of applications, decentralized nature and availability, solar energy will represent a suitable solution for energy
requirements especially in rural areas and new urban communities. It is important to state that the use of solar energy will protect these areas from pollution, since the use of solar home systems avoids large amounts of CO2 emissions [1]. In Egypt, there are many new projects such as those carried out in the new valley in the western desert of Egypt and those on the northern coast of Egypt, which will be accompanied by a new population who
require energy for principle life requirements
A | Initial cost | MTOE | Million Tons Oil Equivalent |
BCC | The batteries charge controller | n | Number of years |
d | The market discount rate | N C | Number of continuous cloudy days |
DOD | The allowable depth of discharge for the batteries | P e | Electrical power (W) |
EL | The average daily load energy (kWh/day) | PSI | Peak solar intensity at the earth surface (1000 W/m2) |
g | 9.81 m/s2 | PV | Photovoltaic panels |
G.S. | The Government Subsidization | PW | Present worth of total cost |
H | Average solar energy input /day (kWh/m2/day) | Q | Water discharge (m3/h) |
h | Total head (m) | TCF | Temperature correction factor |
i | The annual inflation rate | P | Water density (kg/m3) |
![]()
• I Adel El-Menchawy, Professor of Architecture & Urban Design Department of Architectural Engineering, College of
Engineering & Technology, Arab Academy for Science & Technology and Maritime Transport (AASTMT)
• Hesham A. Bassioni, Associate Professor of Building & Construction Engineering Department , College of Engineering
& Technology, AASTMT
• Abd El-Aziz Farouk, M.Sc. Student, Department of Architectural & Environmental Design, College of Engineering & Technology, AASTMT, abdelazizfarou k2001@yahoo.com
JSER © 2011
h ttp://www.ijser.org
International Journal of Scientific & Engineering Research Volume 2, Issue 7, July-2011 2
ISSN 2229-5518
• This research aims at introducing the specific architectural design elements of the existing residential buildings according to the surrounding environmental elements.
• Introduce a model for a family house that depends mainly on solar energy to run the electrical appliances.
• Encourage owners and operators of existing buildings to implement sustainable practices and reduce the environmental impacts of their buildings over their functional life cycles.
1. The increase in population (1.3 million/year)
2. Over concentration of population on 5% of total area of Egypt
3. An extra infrastructure system for about 60 million
(2035) peoples are needed concentrated most probably in the desert and this requires a big amount of embodied energy as well as operating energy and effort [2].
4. The limitation of conventional energy resources in
Egypt
5. Conventional technology as well as the use of high intensive energy industrial construction for production of building material
6. The construction sector produced around 30% of solid waste generation and this is considered one of the biggest challenges facing the population cities
Energy is a critical resource needed for development. Apart from small quantities of coal in Sinai, fossil fuels in the form of oil and gas are known to exist around Gulf of Suez and the northern part of the western deserts. With the present increase in oil prices and its unsustainable production, as well as the international move against CO2 evolution
caused by burning fossil oils, it is imperative that Egypt must devote more efforts to promoting the use of
renewable energy (solar, wind, biogas, and biomass)
The changes in production and consumption of oil & gas are showed in table 1 over the period from 1991 to 2020. Although the balance shows an increase, it should be emphasized that Egypt in most cases has to pay 50% of the production to the foreign partner [3].
In 2007, Egypt's primary energy total consumption was 63
MTOE. This is expected to reach 210 MTOE by 2030. In
2007, primary energy consumption was mainly in industry (34%) and residential and commercial buildings (23%). The later is expected to reach more than 35% by 2030. Different studies have shown that the primary energy supply will not meet demand starting from 2015; this gap is widening after
2020 [2].
In 2007, current installed capacity was 22000 MW. This is expected to reach 74000 MW by 2030. This would require the addition of more than 50000 MW. The peak demand was 18500 MW. It is expected that this demand will reach
62000 MW by 2030 [2].
In 2010, electricity consumption in residential (39.9%), industry (32.7%), commercial (8.1%) and governmental (4.6%), buildings reached 58% of total electric energy demand in Egypt [4].
Table 1
Yearly energy production & consumption in Egypt
Year | 1991/ 1992 | 1999/ 2000 | 2004/ 2005 | 2019/ 2020 |
Production | 55.10 | 60.70 | 69.70 | 104.0 |
Consumption | 31.90 | 38.70 | 43.70 | 70.00 |
Balance | 23.00 | 22.00 | 26.00 | 34.00 |
(Unit = MOTE) Source Beshay, 2010
IJSER © 2011
h ttp ://www.ijser .org
International Journal of Scientific & Engineering Research Volume 2, Issue 7, July-2011 3
ISSN 2229-5518
4.60% 4.10% Residential
8.10%
Industry
10.60%
39.90%
Puplic Lighting
Commercial
32.70%
Government Services Agriculture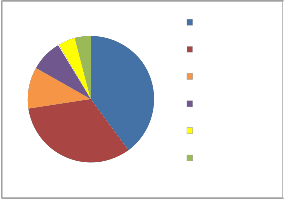
Fig. 1. Electricity consumption in Egypt (Ministry of Energy and
Electricity, 2010
Renewable energy represents an important option for the change in energy mix. In 2009, renewable energy, mainly hydropower, accounted for 12 per cent of Egypt’s electricity generation. Egypt’s hydropower potential is about 3,664
MW with an estimated energy of 15,300 GWh per annum. Renewable resources wind and solar energy offer significant potentials [5].
Egypt is endowed with an abundance of wind energy resources especially in Suez Gulf area which considered one of the best sites in the world due to high and stable wind speeds. The west of Suez Gulf zone is the most promising sites to construct large wind farms due to high wind speeds which ranges between 8-10 meter/second in average, proximity to load centers and transmission infrastructure, and availability of large uninhabited desert area. There are also other promising sites having wind speed of 7-8 meters/second in the east and west of Nile River near Beni-Suef, Menia and El-Kharga Oasis in theNew Valley [5].
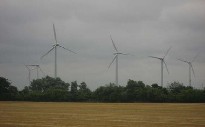
Fig. 2. Wind energy, Red Sea, Egypt
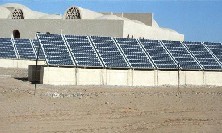
Solar energy is also rather abundant. Due to its geographic location, Egypt enjoys sunshine all year, with direct solar radiation which reaches 6 KWh/m2/day [6].The present energy strategy (the resolution adopted by supreme council on energy in 2007) aims at increasing the share of renewable energy to 20 percent of the energy mix by 2020.
Fig. 3. Solar energy, El-Sadat City, Egypt
This target is expected to be met largely by scaling-up of wind power as solar is still very costly and the hydro potential is largely utilized. The share of wind power is expected to reach 12 percent, while the remaining 8 percent would come from hydro and solar.
This translates into a wind power capacity of about 7200
MW by 2020. The solar component is at this stage
considered to start with 100MW of CSP and 1 MW of PV
power [5].
Photovoltaic cells convert sunlight directly into electrical energy. The electricity they produce is
DC (direct current) and can either be used directly as DC power; converted to AC (alternating current) power; or stored for later use. The basic element of a photovoltaic system is the solar cell that is made of a semiconductor material, typically silicon.
IJSER © 2011
h ttp ://www.ijser .org
International Journal of Scientific & Engineering Research Volume 2, Issue 7, July-2011 4
ISSN 2229-5518
Because sunlight is universally available, photovoltaic devices have many additional benefits that make them not only usable, but of great value, to people around the world. They are the future and by 2020, when the conventional oil supplies begin to really dry up, they will be everywhere [7].
As shown in fig. 4. The PV system can either depend on a
PV array, charge controller, batteries and DC/AC inverter.
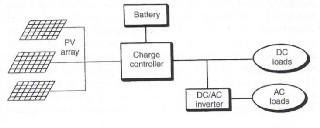
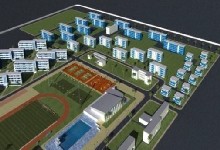
Fig. 6. Residential zone & Executive villas (a) (Abou-Gad, 2008)
Executive villas Area consists of:
- 8 villas with 2 floors (total area 360 m2) villa (a)
- 3 villas with 2 floors (total area 600 m2) villa (b)
Fig. 4. Photovoltaic Systems (Roaf, 2001)
Renovation of Wardan staff housing unit, Wardan, 6 of
October City, Egypt
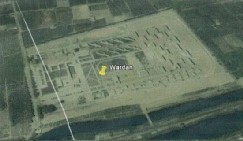
Fig. 5. Wardan institute site (Google earth, 2010)
Wardan Training Institute is located at kilo 58
Cairo/Alexandria desert road, 6 of October, Egypt.
It is located at latitude 30o 22’N, and longitude 30o 27’E, and it is 50 kilometres north-west Cairo. (Rural zone) Design
Architect: Ezat, H. Abougad, Alexandria, 1964
Institute Area is 150 acres and farm area is 20 acres.
Educational zone, residential zone, recreational zone and services zone
office room, kitchen, house keeper room, toilet, and terraces
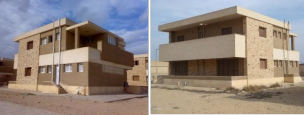
Fig. 7. West perspective Fig. 8. North perspective
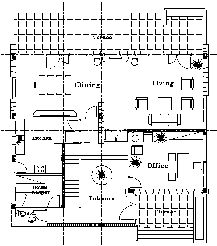
Fig. 9. Existing villa (a) ground floor plan
IJSER © 2011
h ttp ://www.ijser .org
International Journal of Scientific & Engineering Research Volume 2, Issue 7, July-2011 5
ISSN 2229-5518
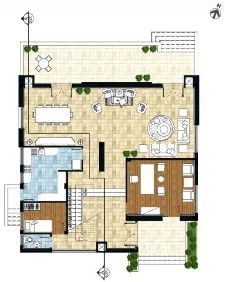
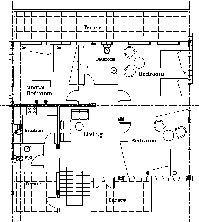
Fig. 10. Existing villa (a) first floor plan
The Wardan residential unit was modified as follows:
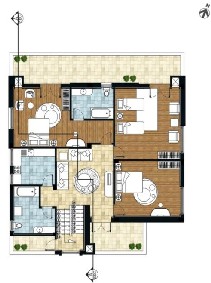
Fig. 11. Proposed ground floor plan
Fig. 12. Proposed first floor plan
Using photovoltaic panels to generate electricity & hot water
The average solar input over the year, H (kWh/m2/day):
According to the fig. 12, the average solar input over the year at Cairo region and its environs is 19.11 MJ/m2/day [8]. To transfer the loads from MJ to kWh use the following equation:
Average H = 19.11 MJ/m2 ×0.2778 = 5.31 kWh/m2/day
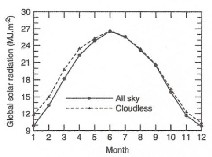
Fig. 13.The monthly average values of daily solar energy (MJ/m2/day)
in the Cairo region
IJSER © 2011
h ttp ://www.ijser .org
International Journal of Scientific & Engineering Research Volume 2, Issue 7, July-2011 6
ISSN 2229-5518
Table 2
The monthly mean values of cloudiness in the Cairo region
Month | Jan | Feb | Mar | Apr | May | Jun | Jul | Aug | Sep | Oct | Nov | Dec | Mean |
Clear Sky | 22 | 21 | 26 | 28 | 29 | 30 | 31 | 31 | 30 | 29 | 26 | 25 | 27 |
Cloudy Sky | 2 | 1 | 0 | 0 | 0 | 0 | 0 | 0 | 0 | 0 | 0 | 1 | 0 |
Partial cloud sky | 7 | 6 | 5 | 2 | 2 | 0 | 0 | 0 | 0 | 2 | 4 | 5 | 3 |
Season | Winter | Spring | Sumer | Autumn | |||||||||
Clear Sky | 23 | 28 | 31 | 28 | |||||||||
Cloud Sky | 1 | 0 | 0 | 0 | |||||||||
Partial cloud Sky | 6 | 3 | 0 | 2 |
Source: Robaa, 2006
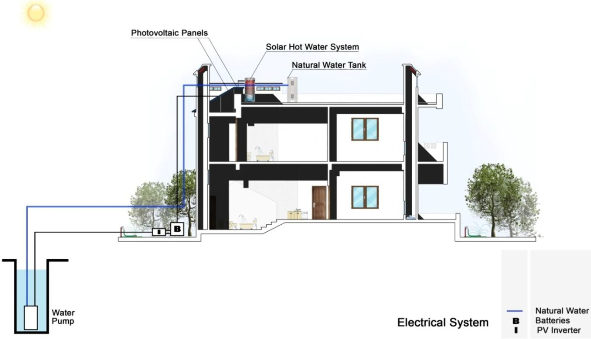
Fig. 14. Proposed photovoltaic and solar hot water system (water is taken from 25m underground) “Sec. A-A”
Water pumping is an important item in designing PV
systems; the depth of the water level in Wardan campus is
25m under ground level. Water required in the villa = 2 m3/day
![]()
p gh Q
Pe = l]pl]m (1)
Assuming that fJp = 0.45 and fJm =0.85, Q=0.5 m3/h
and h= 33.5 m
Pe(Electrical Power) = 120 W
IJSER © 2011
h ttp ://www.ijser .org
International Journal of Scientific & Engineering Research Volume 2, Issue 7, July-2011 7
ISSN 2229-5518
Table 3
The daily load energy requirement for Wardan residential unit
Load | No. of units | Load power (W) | Winter operating periods/day | Spring operating periods/day | Summer operating periods/day | Autumn operating periods/day |
DC lamps (light) | 18 | 6×60 12× 40 | From 17.00 to 22.00 | From 19.00 to 23.00 | From 20.00 to 24.00 | From 19.00 to 23.00 |
Refrigerator AC | 1 | 100 | 24 h/day | 24 h/day | 24 h/day | 24 h/day |
TV & Receiver DC | 1 | 80 | From 17.00 to 22.00 | From 18.00 to 23.00 | From 17.00 to 24.00 | From 18.00 to 23.00 |
Computer & Printer DC | 1 | 100 | From 17.00 to 19.00 | From 18.00 to 20.00 | From 19.00 to 21.00 | From 18.00 to 20.00 |
Washing machine AC | 1 | 250 | From 12.00 to 14.00 | From 12.00 to 15.00 | From 12.00 to 16.00 | From 12.00 to 15.00 |
Electric Fan DC | 8 | 45×8 | _ | From 12.00 to 17.00 | From 11.00 to 19.00 | From 12.00 to 17.00 |
Motor + Pump AC | 1 | 120 | From 12.00 to 14.00 | From 11.00 to 14.00 | From 10.00 to 14.00 | From 11.00 to 14.00 |
Total Energy (W h/day) | 7940 | 9020 | 10880 | 9020 |
(Calculated by the researcher)
From table 3 the average daily load energy of villa “A” =
9.215 kWh/day
- PV Array Sizing
PV (Area) = EL/ H × fJ PV × TCF × fJ out (2) If the cell temperature is assumed to reach 60 Co, then the temperature correction factor (TCF) will be 0.8 [9]. Assuming fJ PV = 17%, fJ out = 0.85 × 0.9 = 0.765
PV (Area) = 9.215 / 5.31 × 0.17 × 0.8×0.765 = 16.6 m2 (3) PV cost according to the market price = 9215 w/h × 1.1$=
10136$ (4)
Battery storage = NC EL / DOD × fJ out (5) NC : Number of continuous cloudy days according to table (5.1) = 2days
Battery storage = 9.215×2/0.8×0.765 = 30114 W h
If a 24 V system is chosen the required amp. Hours of batteries = 30114/24= 1254 AH
If 2V blocks with 1254 AH each are chosen, 12 batteries (2V, 1254 AH) connected in a series are needed. This battery bank can drive the loads for continuous 2days without any sunshine.
The battery charge controller is chosen to maintain a longer lifetime for the batteries.
- DC/AC Inverter
The inverter has to be capable of handling the maximum expected power of AC loads. Thus, it can be chosen 20% higher than the rated power of the summation of AC loads.
Total power of AC loads = 100+250+120=
470 × 1.2 = 564 W (6) The specifications of inverter will be 564W, 24 VDC, and
220 VAC.
IJSER © 2011
h ttp ://www.ijser.org
International Journal of Scientific & Engineering Research Volume 2, Issue 7, July-2011 8
ISSN 2229-5518
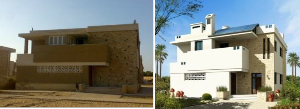
Fig. 15. Proposed photovoltaic panels in the south elevation (before
& after)
From the economical viewpoint, photovoltaic energy systems differ from conventional energy systems in that they have high initial cost and low operating costs.
The price of the PV system and its installation are important factors in the economics of PV systems. These include the prices of PV modules, storage batteries, and the control unit, the inverter, and all other auxiliaries. The cost of installation must be taken into consideration.
For the present PV system, the life cycle cost will be estimated as follows. The lifecycle of the system components will be considered as 25 years except for the batteries, which will be considered to have a lifetime of 8 years. In addition, the annual inflation rate in batteries prices is considered 8.58% and the market discount rate as 8.5% [10].
The cost of the first group of batteries (A) =
No. of batteries × cost of battery = 12×250$ = 3000$
The present worth of the second group of batteries (after![]()
A (l+i)n-1
8 years)
(l+d)n
3000(l+0.0858 7
Life cycle cost = initial cost of PV system + installation cost + maintenance and operation cost = 14986 + (0.1×
14986) + (2763 + 2557) + (0.01×25×14986) = 25549$ (10)
The life cycle output energy = 9.215×365×25 = 84086
kWh (11)
The cost of 1 kWh from the PV generator = 25549/ 84086
= 0.30$
If a diesel generator is used to feed the house in question with its energy requirements, then it is important to estimate its life cycle cost. This will give an indication of the difference in energy cost between PV systems and diesel generator systems.
To estimate the diesel generator life cycle cost, there are some assumptions:
1. Two diesel generators will be used, each with a power capacity of 5 kW.
2. The diesel generators need reviving every 4 years. The cost of reviving is about 20% of their initial price.
3. The cost of annual maintenance, operation and oil changing is about 5% of the initial price.
4. Fuel consumption is about 10 l/day.
5. The inflation rate in prices is about 8.58%, while
= (l+0.085)8
= 2763$ (7)
the market discount rate is about 8.5 % [10].
The life cycle cost of diesel generator system = initial cost
The present worth of the third group of batteries (after 16
years)
3000(l+0.0858 15
+ (present worth of 20% from the initial cost x 6 times reviving) + (present worth of 5% from the initial cost for maintenance, operation and oil changing) + (present
= (l+0.085)16
= 2557$ (8)
worth of fuel consumption for 25 years) (12)
The initial cost of PV system = PV array cost (according to the market price) + first group of batteries cost + BCC cost
+ inverter cost + auxiliaries cost
Substituting from (4),(5),(6) into (9):
Initial cost (according to the market price) = 2×2000$/
unit = 4000$ (13)
A (l+i)n-1
A = 10136+3000+1000+600+250 = 14986$. (9)![]()
Present worth of reviving =
(l+d)n
for
The PV system installation cost can be estimated as 10% of the initial cost. Also, the annual maintenance and operation cost is about 1% of the initial cost.
Substituting from (7), (8), (9) into (10):
N= 4,8,12,16,20,24 where, in this equation,
A= 20% from the initial cost:
IJSER © 2011
h ttp ://www.ijser.org
International Journal of Scientific & Engineering Research Volume 2, Issue 7, July-2011 9
ISSN 2229-5518
![]()
Present worth of reviving = (0.2 × 4000) (l+0.0858) +
(l+0.085)4
1+0.085871+0.0858 + 1+0.0858111+0.08512 +
1+0.0858151+0.08516 + 1+0.0858191+0.08520
+ 1+0.0858231+0.08524 =4420$ (14)
where N from 1 to 25 years, and A = first year fuel cost =
10 L/day
A= 10× 365×0.24 = 876 $
Present worth of fuel consumption for 25 years =
876 (l+0.0858)n-1
Present worth of maintenance, operation and oil![]()
n=25 n=l
(16)
(l+0.085)n = 19342$
changing
Substituting from (13), (14), (15) and (16) into (12):
n=25
![]()
= × A (1 + i)
n-l
n
The life cycle cost of diesel generator system =
n=l
(1 + d)
4000+4420+4425+19342=32187$
Where N from one to 25 years, and A = 5% from initial
cost.![]()
n-1
(l+0.0858)n = 4425$ (15)
Present worth of fuel consumption for 25 years:
The life cycle output energy=9.215×365×25= 84086.8 kWh
The cost of 1 kWh from the diesel generator =
32187/84086.8 = 0.39 $/kWh
Table 4
Comparing between electricity cost (kWh) using PV panels & diesel generator
Items | Photovoltaic Panels | Diesel Generator |
Electricity Cost (kWh) | 0.30$ | 0.39$ |
To feed Wardan institute with the local electricity it will cost approximately 4$ million [11].
4$million / 100000 m2 (The total of Wardan campus built area) = 40$/ m2 [12].
Villa (a) Electricity cost = 360 m2 × 40$ = 14400$
Initial cost = 14400$ (17) Yearly electricity Bill without G.S.= 9.125 × 365 × 0.17$ =
567$ (18) Present worth of electricity consumption for 25 years
=Ln=25× A (l+i)
The life cycle output energy = 9.215×365×25 = 84086.8 kWh
The cost of 1 kWh from the electricity without
government support = 26930/84086.8 = 0.32 $/kWh
Initial cost of local electricity = 2000$ [11].
Yearly electricity Bill with G.S. = 9.125 × 365 × 0.05$ =
167$ (20) Present worth of electricity consumption for 25 years
n=25
167(1 + 0.0858)n-l
![]()
n=l
n=25
(l+d)n
n-l
P = ×
n=l
(1 + 0.085
![]()
)n = 3690$
![]()
567(1 + 0.0858)
(1 + 0.085)n = 12530$
n=l
The life cycle cost of electricity without G.S. =
14400+12530=26930$ (19)
The life cycle cost of electricity with G.S. =
2000+3690=5690$
The cost of 1 kWh from the electricity with G.S. =
5690/84086.8 = 0.07 $/kWh
Table 5
Comparing between electricity cost (kWh) using PV panels, diesel generator and unavailable local electricity supply versus
in case the local electricity supply is valid (with/or without G.S. government subsidization)
Items | Photovoltaic Panels | Diesel Generator | Unavailable Local Electricity without G.S. | Local Electricity with G.S. |
Electricity Cost (kWh) | 0.30$ | 0.39$ | 0.32$ | 0.07$ |
IJSER © 2011
h ttp ://www.ijser.org
International Journal of Scientific & Engineering Research Volume 2, Issue 7, July-2011 10
ISSN 2229-5518
The life cycle cost of the photovoltaic system is less than that of the diesel generator system or local electricity supply (without the government subsidisation) for providing Wardan staff housing unit with the energy supply. On the other hand, diesel generators cause noise and pollution (it produces gases and smoke)
The life cycle cost of the available local electricity (when is valid) is less than photovoltaic system but this case in not permanent in the nearest future in Egypt.
• Renewable energy is the actual solution to face the future challenges in the Egyptian energy demands. Specially, solar energy and wind energy.
• Photovoltaic systems are clean and renewable sources of energy; they do not cause pollution during their use.
• From an economical point of view using PV
systems in feeding rural zones is
very important, especially when their life cycle
costs are competitive with the other types of conventional energy sources.
Photovoltaic Panels
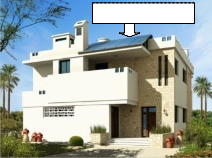
Fig. 16 Proposed south elevation with PV panels
• Energy efficiency through a set of design principles for renewable energy resources
• Applying economical but ecological design factors and through selecting an economical system that uses local and natural building features.
• In order to achieve an ecological, economical house; life cycle cost should be apply throughout all the design and renovation
processes
[1] Wouters FPH, Loois G, Van der Weiden TCJ, Adam HG, Rentz H. (1997). “Joint implementation and the role of utilities in the dissemination of solar home systems in developing countries”, in: Proceedings of 14th European Photovoltaic Solar Energy Conference, Barcelona
[2] Soliman Beshara, A. (2008). “Energy Efficiency in the Buildings”, Sector: Egyptian Experience, Euro- Mediterranean Day (11 December 2008)
[3] Bishay, A. (2010). “Future Intermediate Sustainable Cities”, a message to future generations. First International Conference Sustainability and the Future: BUE the British University in Egypt, 23-25 November
2010.
[4] Ministry of Energy and Electricity, (2010). Energy in
Egypt Annual Report 2009/2010
[5] Med-Enec, (2010). “Energy Efficiency in the Construction Sector in the Mediterranean” http://www.medenec.com/sites/default/files/userfile/ downloads/pilotprojects.pdf. Accessed in April 2011
[6] Ahmad, G.E., (2002). “Photovoltaic-powered rural zone family house in Egypt” Renewable Energy: An International Journal: 379. Academic Search Complete, EBSCO. 15 November 2010
[7] Sue Raof, et al (2001). “Eco House 1: A Design Guide”, Architectural Press, Oxford, UK
[8] Robaa SM. (2006). “A Study of Solar Radiation Climate at Cairo Urban Area, Egypt and its Environs”
International Journal of Climatology, 26: 5 June 2006
[9] Buresch M. (1983). “Photovoltaic energy systems”, New York: McGraw–Hill
[10] Central Bank of Egypt (2010). “Monthly Report”, 16-
12-2010
[11] Egyptian Railways Authority, (2010). “Wardan Renovation Project Documents”, Constructions and environmental Department, Cairo, Egypt
[12] Abou-Gad, K. H. (2008). “Wardan Project Documents”, Architectural Consulting Firm, Alexandria, Egypt.
IJSER © 2011
International Journal of Scientific & Engineering Research Volume 2, Issue 7, July-2011 11
ISSN 2229-5518
![]()