International Journal of Scientific & Engineering Research Volume 4, Issue3, March-2013 1
ISSN 2229-5518
Performance analysis of third order nonlinearities in optical communication system
B.K.Mishra, Lochan Jolly, Karishma Mhatre
Abstract— Nonlinear effects play a major role in optical fiber with respect to transmission capacity and performance of the system. This degrades the system performance in wavelength division multiplexing (W DM)systems, as many closely spaced channels propagate simultaneously, resulting in high optical intensities. Optical nonlinearities in fibers give rise to wealth of new effects. These new effects can be detrimental for optical communications, especially in W DM systems, where they can result in pulse distortion reffered as self phase modulation (SPM), cross phase modulation (XPM), and crosstalk between channels known as XPM, four wave mixing(FW M). The paper simulates two channel W DM optical communication systems in single mode fiber over long haul of 100 km to investigate the effect of SPM, XPM and FW M. The comparison of nonlinearities is performed using eye pattern with respect to bit error rate & Q factor. It is observed that in FW M effect, high improvement of Q factor is seen at the expense of eye opening, which is due to generation of new signal at a cost of power. It is concluded that FW M nonlinear effect is more advantageous and effective as compared to SPM and XPM.
Index Terms— Bit error rate, four wave mixing, nonlinear effects, Q factor, self phase modulation, cross phase modulation, wavelength division multiplexing..
1 INTRODUCTION
—————————— ——————————
iber nonlinear optics has grown from a novel medium for the study of nonlinear optical effects, through a period where these effects appeared as system impairments, to
the present day where optical nonlinearities are an integral part of high capacity optical systems [1]. In optical communi- cation systems the term nonlinearity refers to the dependence of the system on power of optical beam/s being launched into the fiber cable.
Nonlinearities in optical fibers originate due to the third order susceptibility (χ(3)). The real part of the equation gives us SPM, XPM, and FWM and are referred as third order (χ(3)) nonlinearities. While the imaginary part of the equation gives us Stimulated Brillouin scattering (SBS) and Stimulated Ra- man Scattering (SRS) referred as scattering nonlinearities. The nonlinear effects depend on the transmission length of the optical fiber. The longer the optical fiber, the more the light interacts with the fiber material and the greater the nonlinear effects. On the other hand, if the power decreases while the light travels along the optical fiber, the effects of nonlinearity diminish.
The system engineers should not deploy high bit rate (>10Gbps per channel) multiwavelength systems without con- sidering the nonlinear effects and their impact on these sys- tems [2].
2 THIRD ORDER NONLINEARITIES
The χ(3) nonlinearities arise from light-induced (nonlinear) changes in the index of refraction and can result in nonlinear refraction (Kerr effect) or the mixing of optical beams (para- metric interactions). The χ(3) nonlinearities can be divided in two groups: SPM and XPM in one; and parametric processes, such as FWM and third harmonic generation (THG) in the other [3].
In SPM, the intensity modulation of an optical beam results in the modulation of its own phase via modulation of the refrac- tive index of the medium. The resulting time-dependent
change, or modulation of the phase, leads to spectral broaden- ing or frequency chirping [4].
XPM is a similar effect to SPM, but it involves two optical beams instead of one. In XPM, the intensity modulation of one of the beams results in a phase modulation of the other [5]. However, because the total intensity is the square of a sum of two electric-field amplitudes, the spectral broadening caused by XPM is twice as large as in SPM.
The interaction of two or more light waves can lead to a se- cond kind of χ(3) nonlinearities. These involve an energy trans- fer between waves and not simply a modulation of the index seen by one of them due to the other. This interaction is often referred to as “parametric”, and these nonlinearities lead to parametric processes [6].
The nonlinear effects are compared theoretically as shown in Table 1 below. The SPM and XPM are dependent on bit rate whereas FWM is independent of bit rate.
TABLE 1
COMPARISON OF SPM, XPM AND FWM
IJSER © 2013 http://www.ijser.org
International Journal of Scientific & Engineering Research Volume 4, Issue3, March-2013 2
ISSN 2229-5518
3 SIMULATIONS AND DESCRIPTION
In this work, we use the Rsoft OptSim simulation software that gives us the environment almost the exact physical reali- zation of a system. OptSim provides the users with laser di- odes, filters, modulators and all the components which are essential to build an optical network
All simulations models for three different nonlinearities namely SPM, XPM, FWM are in sample mode with VBS tech- nique because these are time varying nonlinear effects. All optical signals are with respect to frequency and electrical sig- nals are with respect to time.
The design model contains transmitter, receiver and fiber channel blocks. The transmitter contains Pseudo-random data generator which generates random bit sequences at the rate of
10Gbps. This bit sequence is fed to the NRZ coder that pro- duces an electrical NRZ coded signal. The output of NRZ cod- er and CW laser are sent to amplitude modulator. It is an elec- tro-optical modulator used to modulate the light wave with respect to transmitted electrical signal. The optical signal is fed into the single mode fiber. The fiber model in Optsim takes into account the unidirectional signal flow, Kerr nonlinearity and dispersion. Output of the fiber is sent to fiber grating, which is used to compensate the distortion of signal by reduc- ing dispersion after each stage. Fibers grating compensator is used to reflect particular wavelengths of light and transmits others, achieved by varying refractive index (varying intensity of light). The output signal from fiber channel will be an input to raised cosine filter. Filter configuration is set to band pass filter. The band pass filter is used to transmit all the frequen- cies within the specified range. The sensitivity receiver is used to convert an optical signal into an electrical signal. Electrical scope is used to capture the output electrical signal, eye pat- tern. Eye pattern measurements are collected in time domain.
TABLE 2
SIMULATION PARAMETERS
Parameter (Unit) | Values |
Bit rate (Gbps) | 10 |
Pump frequency (THz) | 193.025 |
Probe frequency (THz) | 193.125 |
Channel spacing(GHz) | 100 |
Fiber length (km) | 100 |
Amplifier gain (dBm) | 35 |
Two channel WDM is used for XPM and FWM whereas single channel is used for SPM. The simulation parameters are given in Table 2.
4 RESULTS AND DISCUSSION
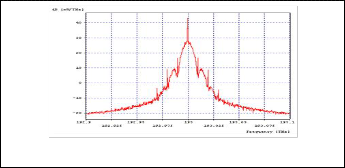
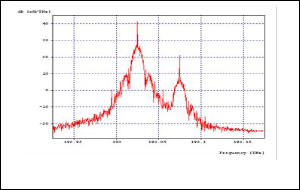
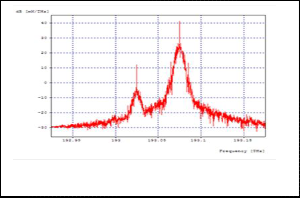
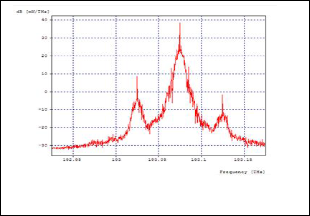
The input pattern of SPM effect is shown in Fig.2 and disper- sion in the received signal is observed due to SPM effect as shown in Fig.3. The input pattern of XPM where two optical signals are combined together is as shown in Fig.4. The signal is dispersed due to XPM and shown in Fig.5. The input pat- tern of FWM is shown in Fig.6, which is also a combination of two optical signals. From FWM output pattern shown in Fig 7, we can observe that there is another optical pulse in the signal generated from the two input optical pulses. Comparisons are based on eye pattern, BER and Q factor. A Q estimator, electric scope and BER estimator is placed at the end of each design (SPM, XPM and FWM) to assess the Q factor, BER and eye pattern features of the designs.
The Q factor for SPM design model is 26.64031dB. Q factor is related to Signal to noise ratio and inversely proportional to BER. High Q factor shows that the signal is less immune to noise and received signal is similar to input signal with less noise. The SPM eye pattern is as shown in Fig.8.
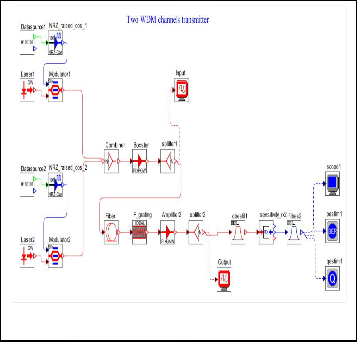
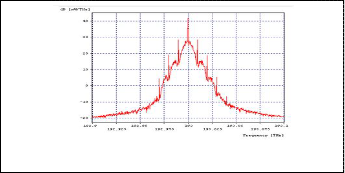
Fig. 2. SPM input pattern.
Fig1.Simulation setup.
Fig.3. SPM output pattern.
IJSER © 2013 http://www.ijser.org
International Journal of Scientific & Engineering Research Volume 4, Issue3, March-2013 3
ISSN 2229-5518
Fig. 4. XPM input pattern.
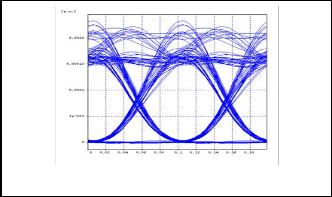
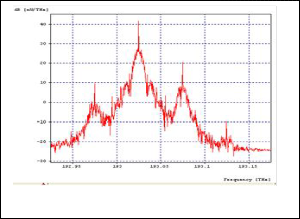
Fig.8. SPM eye pattern.
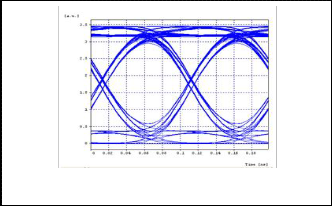
Fig. 5. XPM output pattern.
Fig.9. XPM eye pattern.
Fig.6. FW M input pattern.
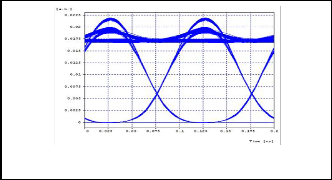
Fig.10. FW M eye pattern.
Fig.7. FW M output pattern.
The eye pattern shown in Fig 9 for XPM has Q factor of
17.63697dB and has less value of eye opening. This is observed
because of different amplitudes of signal with respect to pow-
er. XPM effect causes serious distortion in the signal. In FWM effect, high improvement of Q factor is seen at the expense of eye opening, which is due to generation of new signal at a cost of power and can be observe in Fig.10. Value of Q factor for
FWM design is 20.31574, which ensures that the noise level present in the signal is negligible. The FWM dispersion effect achieves more than one WDM channel and better reception of signal with different power levels in the channels at receiver. The comparative study of all the measured parameters is giv- en in Table 3 below.
IJSER © 2013 http://www.ijser.org
International Journal of Scientific & Engineering Research Volume 4, Issue3, March-2013 4
ISSN 2229-5518
TABLE 3
COMPARATIVE STUDY OF PARAMETERS OBSERVED USING OPTSIM
Parameters | SPM | CPM | FWM |
Bit rate | 10Gbps | 10Gbps | 10Gbps |
Channels | 1 | 2 | 2 |
Q factor (linear) | 21.47907 | 7.61813 | 10.37020 |
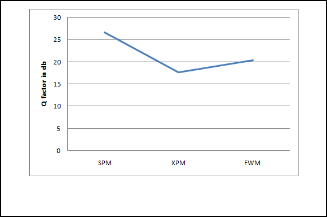
Q factor in db | 26.64031 | 17.63697 | 20.31574 |
Eye opening | 0.15822E-01 | 0.14420E-03 | 0.23532E+01 |
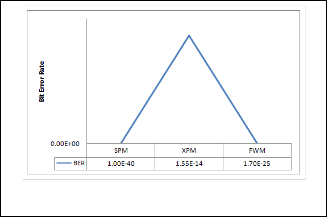
BER | 0.99999E-40 | 0.15540E-13 | 0.17043E-24 |
Fig.11. Bit error rate observed for SPM, XPM and FW M.
munication system like WDM systems can adversely affect the communication between two receiving ends. These nonlinear effects can be managed through proper system design. We can conclude that, FWM nonlinear dispersion effect is more ad- vantageous and effective when compared to SPM and XPM. The effects are also useful for many device and system appli- cations like optical switching, soliton formation, wavelength conversion, broadband amplification, demultiplexing etc.
REFERENCES
[1] J.S. G. P Agarwal, “Fiber Optic communication systems”, John Wiley and Sons, Inc., 1992.
[2] M. Wu and W. I. Way, “Fiber nonlinearity limitations in ultra-dense WDM
systems,” J. Lightw. Technol., Vol22, no. 6, pp. 1483–1498, Jun. 2004.
[3] G. P. Agrawal, “Nonlinear Fiber Optics”, 3rd ed. San Diego, CA: Aca- demic, 2001.
[4] J. Toulouse, “Optical Nonlinearities in Fibers: Review, Recent Exam- ples, and Systems Applications”, J. Lightw. Technol, Vol. 23, no. 11, November 20.
[5] S. Betti and M. Giaconi, “Analysis of the Cross-Phase Modulation Effect in WDM Optical Systems”, IEEE Photon. Technol. Lett., Vol. 13, NO. 1, pp. 43-45, JANUARY 2001.
[6] Osamu Aso , Masateru Tadakuma and Shu Namiki , “Four-Wave
Mixing in Optical Fibers and Its Applications”, WP Team, Opto- technology Lab., R & D Div.
Fig.12. Q factor observed for SPM, XPM and FW M.
The nonlinear dispersion due to SPM is considered advan- tageous only when one WDM channel is used. In today’s world, challenge is to have more than one channel and higher transmission rate to receive the signal without distortion when transmitted through fiber link. Thus for multiplexed systems only XPM and FWM dispersion effects are considered. From the table and the related eye patterns, it is observed that XPM effect causes serious distortion in the signal. Whereas in FWM effect, high improvement of Q factor is seen at the expense of eye opening, this is due to generation of new signal at a cost of power.
4 CONCLUSION
Presence of these non linear effects in the optical fiber com-
IJSER © 2013 http://www.ijser.org