International Journal of Scientific & Engineering Research, Volume 5, Issue 1, January-2014
ISSN 2229-5518
156
Performance Analysis of Spray and Wait
Protocol and Epidemic Protocol in VDTN
Mr.Mhamane Sanjeev C
SVERI’s College of Engineering,Pandharpur
Maharastra, INDIA
Email: sanjeev.mhamane4@gmail.com
Mob no: 09970262796
Prof.Dr.Mukane. S. M
SVERI’s College of Engineering,Pandharpur
Maharastra, INDIA
Email: smmukane@gmail.com
Mob no: 0954552899
Abstract—Mobile ad hoc routing protocols allow nodes with wireless adaptors to communicate with one an- other without any pre-existing network infrastructure. Existing ad hoc routing protocols, while robust to rapidly changing network topology, assume the presence of a connected path from source to destination. Given power limitations, the advent of short-range wireless networks, and the wide physical conditions over which ad hoc networks must be deployed, in some scenarios it is likely that this assumption is invalid. In this work, we develop techniques to deliver messages in
II. SPRAY AND WA I T ROUTING PROTO CO L This method consists of two phases
Spray phase: For every message originating at a source node, message copies are initially spread forwarded by the source and possibly other nodes receiving a copy to distinct relays. Wait phase: If the destination is not found in the spraying phase, each of the nodes carrying a message copy performs direct transmission (i.e. will forward the message only to its destination) [2].
the case where there is neIver a cJonnected pathSfrom source ER
to destination or when a network partition exists at the time a message is originated. This paper mainly two DTN routing protocols: Epidemic Routing and Spray and Wait Routing, are advocated and compared in terms of Message Delivery Probability.
Keywords-Message delivery probability,Contacts,Average
delay
I. CHALLANGES IN DTN
Many evolving and potential networks do not conform to the Internets underlying assumptions . These networks are characterized by:
Intermittent Connectivity: If there is no end-to-end path between source and destination called network partitioning end-to-end communication using the TCP/IP protocols does not work. Other protocols are required.
Long or Variable Delay: In addition to intermittent connectivity, long propagation delays between nodes and variable queuing delays at nodes contribute to end-to-end path delays that can defeat Internet protocols and applications that rely on quick return of acknowledgements or data.
Asymmetric Data Rates: The Internet supports moderate asymmetries of bi- directional data rate for users with cable TV or asymmetric DSL access. But if asymmetries are large, they defeat conversational protocols.
High Error Rates: Bit errors on links require correction or retransmission of the entire packet. For a given link-error rate, fewer retransmissions are needed for hop-by-hop than for end- to-end retransmission.[1]
III. PROPOSED WORK
The motivation for this work comes from the idea that placing relay nodes at crossroads allows data deposit and pickup by passing mobile nodes, which will increase the delivered messages (probability) to the final destination.In this work by varying number of relay nodes and mobile nodes,compairing the results for spray and wait protocol and epidemic routing protocol.
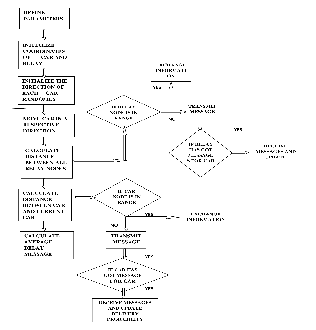
IV. EPIDEMIC ROUTING PROTO CO L
Each node consists of message list, m-list and the immunity list, i-list both are lists of message ids. The immunity list contains message ids for those messages that are already delivered to their destination. Using the two lists, the individual nodes compile and exchange the message list they want from the other node. After receiving both nodes modify their m-list and i-list. At the end of a successful exchange, both nodes will have the same set of messages and their immunity lists modified to show receiving messages.[3]
A. Performance Parameters
The various network performance parameters considered inthis scheme are as follows [5],
(i) Message delivery probability: It is ratio of total number received messages to the total number of transmitted messages.
MDP = received messages / transmitted messages
(ii) Average delay: It is the mean of all delays.
IJSER © 2014 http://www.ijser.org
International Journal of Scientific & Engineering Research, Volume 5, Issue 1, January-2014
ISSN 2229-5518
157
Fig. 1.Epidemic routing Protocol
B. Results and Discussion
Fig.2. shows the Performance analysis for Delivery probability against number of nodes for 15,20,25,30,35,40 cars respectively.It shows that the probability of delivery increases the total number of relay nodes in the network increases.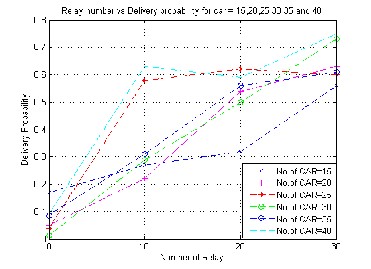
Fig.2.Effect of change in no. of relay nodes on message
IJSER
Table 1. shows the performance analysis of Message
Delivery Probability and Average Delay for the cars 20 and
40. From table it can be analysed that the Message delivery probability goes on increasing as no. of relays goes on increasing.
delivery probability.
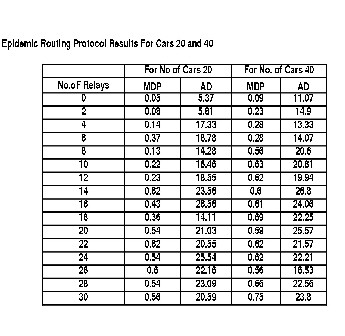
Fig.3. shows the Performance analysis for Delivery probability against number of nodes for 15,20,25,30,35,40 cars.It is observe that the probability of delivery increases the total number of relay nodes in the network increases. probability of delay in minutes is directly proportional to the total number of relay nodes in the network.
Table 1.Effect of change in no. of relay nodes and vehicles on message delivery probability and average delay for Epidemic protocol.
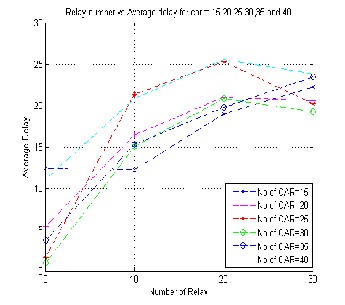
Fig.3.Effect of change in no.of relay nodes on Average Delay
IJSER © 2014 http://www.ijser.org
International Journal of Scientific & Engineering Research, Volume 5, Issue 1, January-2014
ISSN 2229-5518
158
V. Performance analysis between Spray and Wait and
Epidemic routing protcol
Table shows the comparision between two routing protocols in terms of the message delivery probability and Average delay for 20 vehicles.
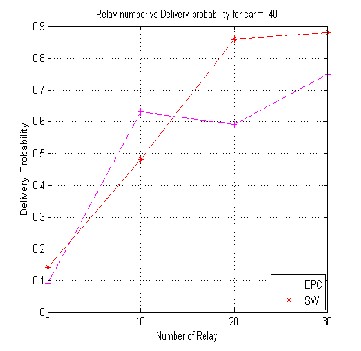
Fig.4.shows the Performance analysis for Delivery probability against number of nodes for 40 vehicles.It shows that the probability of delivery increases the total number of relay nodes in the network increases.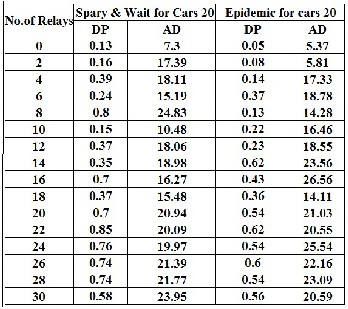
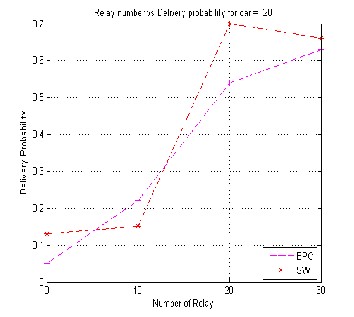
Fig.4. Effect of change in no. of relay nodes on message delivery probability
Table 2.Effect of change in no. of relay nodes and vehicles on message delivery probability and average delay for 20
vehicles
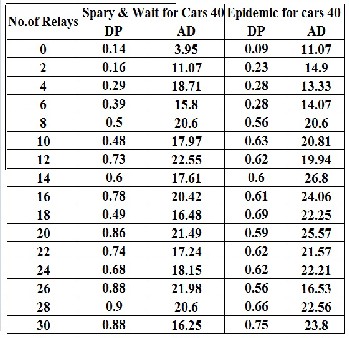
Table 3.Effect of change in no. of relay nodes and vehicles on message delivery probability and average delay for 40 vehicles
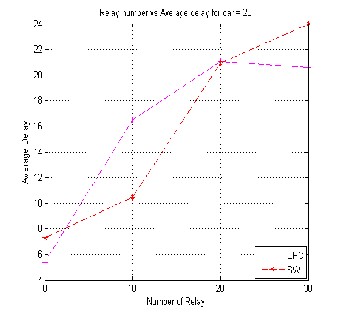
Fig.5.shows the Performance analysis for Average Delay against number of nodes for 40 vehicles.It shows that the probability of delivery increases the total number of relay nodes in the network increases.
Fig.5.Effect of change in no.of relay nodes on Average Delay
IJSER © 2014 http://www.ijser.org
International Journal of Scientific & Engineering Research, Volume 5, Issue 1, January-2014
ISSN 2229-5518
159
Fig.6.shows the Performance analysis for Delivery probability against number of nodes for 40 vehicles.It shows that the probability of delivery increases the total number of relay nodes in the network increases.
VI. CONCLUSION
After analysing both routing protocols it is observed that the Spray and wait routing protocol gives better Message delivery probability with better Average Delay than Epidemic routing protocol.
REFERENCES
[1] Josep M. Pujol, Alberto Lopez Toledo, Alberto Lopez
Toledo, Fair Routing in Delay Tolerant Networks,2004
[2] Thrasyvoulos Spyropoulos, Konstantinos Psounis, Cauligi S. Raghaven- dra, Spray and Wait: An Efficient Routing Scheme for Intermittently Connected Mobile Networks, SIGCOMM Workshops, August 2226, Philadelphia, PA, USA. ACM 1-59593-026-4/05/0008,2005
[3] Ozcan Koc Justin Yackoski Chien-Chung Shen, Autonomous Pickup and Delivery for Delay Tolerant Mobile Networks, IEEE 0-7803-9466,2005
[4] Yili Gong, Yongqiang Xiong, Qian Zhang, Zhensheng Zhang, Wenjie Wang, Zhiwei Xu, Anycast Routing in Delay Tolerant Networks IEEE 1-4244-0357-X,2006
[5] Jones, E.P.C.; LiL.; Schmidtke, J.K.; Ward, P.A.S.,”Practical Routing in Delay-Tolerant Networks,” Mobile Computing, IEEE Transac- tions on , vol.6, no. 8, pp.943,959, Aug.
2007.
[6] Lei Tang, Qunwei Zheng, Jun Liu, Xiaoyan Hong, SMART:
Fig.6.Effect of change in no.of relay nodes on message
delivery probability
Fig.7. shows the Performance analysis for Average Delay against number of nodes for 40 vehicles.It shows that the probability of delivery increases the total number of relay nodes in the network increases.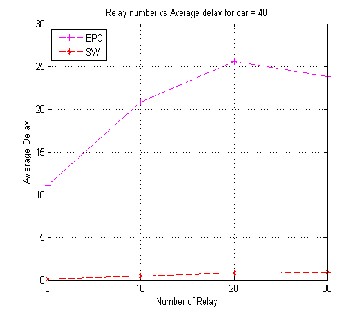
Fig.7.Effect of change in no.of relay nodes on Average Delay
A Selective Controlled-Flooding Routing for Delay Tolerant
Networks,2007
[7] Antonis Panagakis, Athanasios Vaios and Ioannis
Stavrakakis, On the Effects of Cooperation in DTNs,
2008
[8] Li Ding, Bo Gu, Xiaoyan Hong, Brandon Dixon, Articulation
Node Based Routing in Delay Tolerant Networks, IEEE
978-1-4244-3304,2009
[9] Jingfeng Xue, Jiansheng Li, Yuanda Cao, Ji Fang, Advanced PROPHET Routing in Delay Tolerant Network, International Conference on Communication Software and Networks 978-0-7695-3522,2009
IJSER © 2014 http://www.ijser.org