International Journal of Scientific & Engineering Research, Volume 5, Issue 9, September-2014 592
ISSN 2229-5518
Optimum Water Management of Pitcher Irrigation under Iraqi Extreme Climatic Changes
Najah M. Lateef Al Maimuri, , Kareem Fadil Abood, Abbas Ahmed Hussian, Babil Technical Institute, Babylon, Iraq, E- mail: Najahml@yahoo.com
It is found that the hydraulic head more than 0 is not necessary to be used in pitcher irrigation system to supply the field with necessary water demand in this management study. Moreover, the maximum oozing water rate from clay jar is occurred in sandy soil
The field measurement study proved that the relationship of water oozing rates versus the applied hydraulic heads is linear in sandy and mixture soil and nonlinear in clayey soil.
—————————— ——————————
Monda (1976), Das (1983) and Bainbridge (2001) outline that Pitcher irrigation is a traditional
system of irrigating plants and considered several times more efficient than a conventional surface irrigation system. Whereas Charles et al (1996) indicates that Micro-irrigation techniques can be used to improve irrigation efficiency on vegetable gardens by reducing soil evaporation and drainage losses. They carried experiments during 1985-1995 to evaluate the micro-irrigation technique. It is found that subsurface irrigation using clay pipes is particularly effective in improving yields, crop quality, water use efficiency, cheap, simple and easy to use. Good results were also obtained with subsurface irrigation when irrigation was carried out using poor water quality.
Altaf et al (2009) study the patterns and extent of soil wetting obtained by small and large pitchers. The work addresses three pitcher sizes: 20L, 15L, and 11L with pitcher walls hydraulic conductivity ranged between 0.07 to 0.14 cm/day. After 10 days water content at location 0, 20, 40, and 60cm away from pitcher center obtained by HYDRUS_2D simulation model found to be in the range 0.004-0.023.
Hossein M. (2014) estimated the water use efficiency for fruit yield of cucumber and watermelon, under furrow and clay pitcher irrigation methods. Field experiments are conducted to quantify crop water productivity (CWP) the considered crops. The comparison of the CWP of cucumber and watermelon indicates that in clay pitcher irrigation the CWP is 4.91 and 4.79 times as big as the furrow irrigation, respectively. Total fruit yield is 2.5 kg per plant for pitcher irrigation and 2.04 kg per plant for furrow irrigation methods. The watermelon fruit harvesting stage is 55 days from 16 June to 10
August. Total fruit yield is 8.61 kg per plant for pitcher irrigation and 7.86 kg per plant for furrow irrigation methods.
Padma (2007) indicates that "water flow through the pitcher is seen to be regulated by soil water tension, the magnitude of which increases with temperature and decreases with humidity. In the areas
where temperatures are very high and other methods of irrigation fail, pitcher or clay pot irrigation can be a promising alternative due".
Najah (2014) A micro auto regulative irrigation technology has been examined in Iraqi soils namely
Hyro-Osmotic Irrigation System HOPIS. Experimental field measurements have been conducted to
investigate the physical Wetting front advance behavior (issued from ceramic jar) through three types
IJSER © 2014 http://www.ijser.org
International Journal of Scientific & Engineering Research, Volume 5, Issue 9, September-2014 593
ISSN 2229-5518
of soil; they are clayey, sandy, and mixture of (40%clay, 40%sand and 20% fertilizer) soils under the effect of a variable hydraulic head of (2.5m). It is indicated that the Wetting front reaches a distance of
12.5cm with velocity 6 cm/hr after 6.5hrs since irrigation process is started under hydraulic heads of
2.5m respectively in clayey soil. It reaches a distance of 6cm, 13m, and 15cm with velocities less than
1cm/hr after 6.5hrs since irrigation process is started under hydraulic heads of 2.5m respectively in sandy soil. Whereas it reaches a distance of 12.8cm with velocities less than 0.35cm/hr after 12hrs since irrigation process is started under the same hydraulic heads in a mixture soil. Fahdil M. A. (2010) experimentally quantifies the effects of pot volume on water use efficiency and surface wetting front. Two types have been examined; large and small pot volume. The results show that large volume pot is more efficient than small pot. In this research the volume of clap pitchers is fixed to 8 liters to evaluate the oozing water occurrence to satisfy the WD in the vicinity of the pitchers.
In recent decades, particularly Iraq country endures the problem of water changes as the extreme temperature rise in summer, frequent dusty storms, water scarcity, terroristic circumstances and searching for other alternatives of water resources become an inevitable challenge. Pitcher Vessels (clay jars) proves to be a fantastic auto regulative technology to save and oozes the needed water to plants roots wherever and whenever it is necessary meanwhile plant production is unaltered
The well-considered water management of pitcher irrigation system requires:
3.1 Estimation of Water Consuming Rate (WCR)
The estimation of WCR requires a serious field measurement to assess the amount of water to be oozed and consumed from the jars; water demand assessment and irrigable area surrounded the jar. Anyway the estimation of oozing water for special equipment to be arranged for the purpose of WCR estimation.
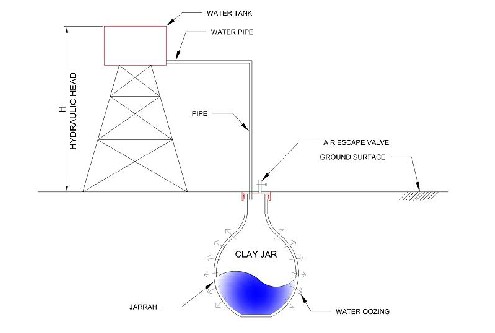
3.1.1 Device Arrangement & Setup
Once, the clay jar is setup by inserting it in the field soil before it has been connected to water tank by a suitable plastic pipe. The top of jar is close with a ceramic cover fixed by Mastic Polystyrene. The jar cover is provided with air escape valve to dispose the air bubbles before starting the volume of oozing water estimation. After the system has been installed the oozing water volume with time are recorded instantaneously. Fig.(1) presents the setup of the oozing jar category.
IJSER © 2014 http://www.ijser.org
International Journal of Scientific & Engineering Research, Volume 5, Issue 9, September-2014 594
ISSN 2229-5518
Fig.(1) Jar System Setup
3.1.2 Soil Textures Testing
Three soil textures have been used to evaluate water oozing through; they are :-
A pure clay soil with a natural dry density of 15.39KN/m3 is used.
A river sand with natural dry density of 16.7 KN/m3. The sieve analysis results for the sand are tabulated in Table (1).
Table (1) Sand Gradation
Sieve Diameter, mm | 10 | 4.75 | 2.36 | 1.18 | 0.6 | 0.3 | 0.15 |
Passing by Weight % | 100 | 98.5 | 97 | 96 | 95 | 94.5 | 93.5 |
Soil mixture of (40% clay, 40% Sand and 20% Fertilizer) is also used as a case study.
3.1.3 Osmotic Clay Jar Properties
Clay Jar represents the major unit in the current irrigation process. Briefly, it consists of two parts as shown in Fig.(1):-
1- Scorching clayey vessel (jar).
2- Ceramic or plastic cover with water divider.
In this technology, it is suggested to paint the lower parts of the clay jar to prevent
downward deep percolation. See Fig.(1). Briefly, the volume of the tested clay jar is 8 liters with 2cm wall thickness and the wall hydraulic conductivity of 0.3 cm/day as tested.
3.1.4 Field Experimental Results of Oozing Water & Analysis
The water oozing from the jar is clearly affected by the surrounding soil. It is obviously suggested to use three types of soil under three hydraulic heads of (h=0m, 1.25m and 2.5m).
IJSER © 2014 http://www.ijser.org
International Journal of Scientific & Engineering Research, Volume 5, Issue 9, September-2014 595
ISSN 2229-5518
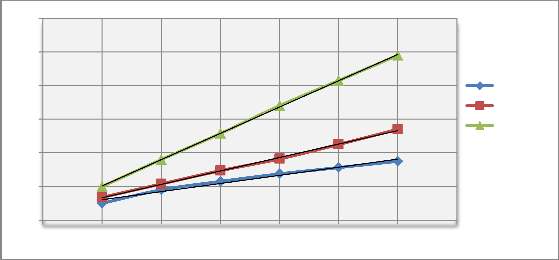
1- Clay Soil
Fig.(3) shows the volume of water consumed from the jars with time in clayey Iraqi soil under extreme high temperature of 48cº. It is found that linear fitting curves between the consumed water and the elapsed time under the three considered head.
In order to find the Water Consuming Rate (WCR) the fitted equations presented in Fig.(1)
are differentiated with respect to time to estimate WCR which is included in Table (2).
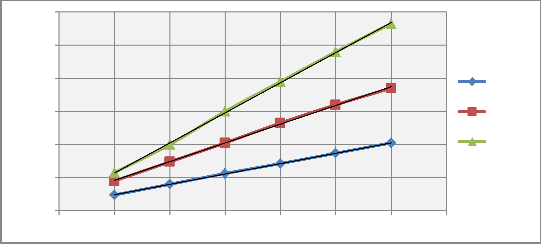
2- Sand Soil
Fig.(4) presents the water volume consumed in sandy soil which in turn offers the amounts of
WCR which is tabulated in Table (2)
3- Mixture Soil
Fig.(5) presents the water volume consumed in mixture soil which in turn offers the amounts of WCR as shown in Table (2).
Table (2) WCR, Liter/hr
Soil Type | h= 0m | h=1.25m | h=2.5m |
Clay | 0.967 | 1.598 | 3.128 |
Sand | 1.254 | 2.26 | 3.364 |
Mixture | 1.046 | 2.1029 | 3.177 |
The WCR with the hydraulic Head Variation are presented in Fig.(5).
12
10
y = 3.1286x + 0.4667
8 R² = 0.9998
y = 1.5986x + 0.5333
6 R² = 0.9987
4
y = 0.9671x + 0.72
2 R² = 0.9773
0
0 0.5 1 1.5 2 2.5 3 3.5
Fig.(2) Oozing WCR from a Single Jar in Clay Soil
h=0m h=1.25m h=2.5m
IJSER © 2014 http://www.ijser.org
International Journal of Scientific & Engineering Research, Volume 5, Issue 9, September-2014 596
ISSN 2229-5518
12
y = 3.6343x + 0.4733
10 R² = 0.9995
8 y = 2.26x + 0.7033
R² = 0.9993
6
y = 1.2546x + 0.3417
4 R² = 0.9998
2
h=0m h=1.25m h=2.5m
0
0 0.5 1 1.5Time, hrs2 2.5 3 3.5
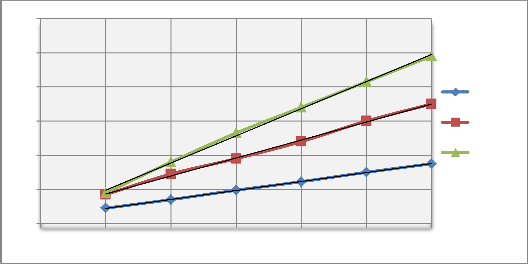
Fig.(3) Oozing WCR from a Single Jar in Sandy Soil
12
10
y = 3.1771x + 0.3733
8 R² = 0.9984
h=0m
6
y = 2.1029x + 0.6867
4 R² = 0.9986
2 y = 1.0457x + 0.37
R² = 0.9998
0
0 0.5 1 1.5 2 2.5 3
Fig.(4) Oozing WCR from a Single Jar in Mixture Soil
h=1.25m h=2.5m
3.5
3
2.5
2
1.5
Clay Sand Mixture
1
0.5
0 0.5 1 1.5 2 2.5 3
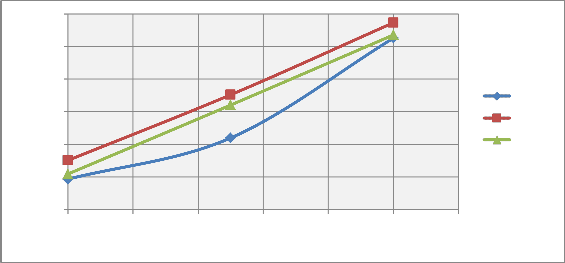
Fig.(5) WCR versus Hydraulic Head variation
IJSER © 2014 http://www.ijser.org
International Journal of Scientific & Engineering Research, Volume 5, Issue 9, September-2014 597
ISSN 2229-5518
In general, water demand depends mainly as outlined by many researchers on the
evapotranspiration, local plant crops which are collected and listed in Table (3) and the irrigable area of the corresponding single jar.
Table (3) Evapo-Transpiration & Crop Coefficients in Iragi Extreme Climatic Changes
Evapotra (mm) | Wheat | Barley | Cotton | Sunflower | Corn | Vegetable | Orchard | |
OCT | 168 | 0.00 | 0.00 | 0.00 | 0.00 | 0.50 | 0.70 | 0.70 |
NOV | 82 | 0.00 | 0.58 | 0.00 | 0.00 | 0.50 | 0.70 | 0.70 |
DEC | 52 | 0.40 | 0.77 | .00 | .00 | .00 | 0.50 | 0.50 |
JAN | 41 | 0.80 | 1.01 | 0.00 | 0.00 | 0.00 | 0.50 | 0.50 |
FEB | 55 | 1.20 | 1.14 | 0.00 | 0.00 | 0.00 | 0.60 | 0.60 |
MAR | 101 | 1.20 | 1.12 | 0.6 | 0.58 | 0.00 | 0.80 | 0.80 |
APR | 154 | 1.00 | 0.82 | 1.00 | 0.68 | 0.00 | 0.80 | 0.80 |
MAY | 236 | 0.50 | 0.00 | 1.10 | 0.84 | 0.00 | 0.80 | 0.80 |
JUN | 279 | 0.00 | 0.00 | 1.20 | 1.02 | 0.00 | 0.09 | 0.09 |
JUL | 312 | 0.00 | 0.00 | 1.2 | 0.49 | 1.00 | 1.00 | 1.00 |
AUG | 284 | 0.00 | 0.00 | 1.20 | 0.00 | 1.00 | .90 | 0.90 |
SEP | 223 | 0.00 | 0.00 | 1.00 | 0.00 | 0.80 | 0.90 | 0.90 |
Experimental field results of the irrigable jar area made by Najah (2014) are shown in Table (4). The table presents the radii of the inners and outers boundaries of the irrigable areas for clay, sand and
mixture soils. Fig.(6) shows the inner and outer boundaries radii. Briefly the considered area can be calculated by Eq.(1)
2 2
Area (between Rin and R out ) = 𝜋(𝑅𝑜𝑢𝑡 − 𝑅𝑖𝑛 ) ……………………………………………………………………(1)
Table (4) Irrigated Areas
Soil Type | Jar Radius (cm) | Extreme Wetting Front Radius (cm) | Irrigable Area (m2) |
Clay | 20 | 50 | 0.660 |
Sand | 20 | 35 | 0.259 |
Mixture(Clay+Sand+Fertilizer) | 20 | 35 | 0.259 |
Oozing Water
RRinR RRout
Oozing Jar
Fig.(6) Irrigable Area confined between The Jar inner Boundary(RR inR) and the Extreme Wetting Front Bondary(RRoutR)

IJSER © 2014 http://www.ijser.org
International Journal of Scientific & Engineering Research, Volume 5, Issue 9, September-2014 598
ISSN 2229-5518
The amount of the evapotranspiration as presented by Blaney- Criddle is used to estimate the WD (Israelsen & Hansen, 1962). Accordingly, equations (2, 3, 4 and 5) which reflect the effects of plant tissues and evaporation water need are employed:
Eо : potential evapotranspiration, mm/month, P : yearly percentage of monthly day light
C : average monthly temperature, ºc, Kc : crop coefficient, and U : monthly crop consumptive
use, mm/month.
The estimated monthly WD are listed in Tables (6 & 7).
To achieve the management of irrigation water in pitcher irrigation properly, the measured water
supply rates of Table (5) should be prepared. Whereas the estimated monthly WD in clay soil Table (6)
and monthly WD of Table (7).
Table (5) Measured WCR of Jars, liter/month
h(m) | Clay Media | Sand Media | Mixture Media |
0 | 696.312 | 903.312 | 752.904 |
1.25 | 1150.992 | 1544.4 | 1514.088 |
2.5 | 2252.592 | 2422.296 | 2287.512 |
The good cogitation of Tables (5, 6, &7) one concludes that the monthly WD for all plant crops can be
satisfied by the oozing water of the jars at hydraulic head of h=0m. This leads us to insure that the use of hydraulic heads more than zero is not necessary.
Table (6) Monthly WD of Clay Soil (per Jar' Area) , liters/month
Evapotra (mm) | Wheat | Barley | Cotton | Sunflower | Corn | Vegetable | Orchard | |
OCT | 168 | 0 | 0 | 0 | 0 | 55.44 | 77.616 | 77.616 |
NOV | 82 | 21.648 | 31.3896 | 0 | 0 | 10.824 | 27.06 | 27.06 |
DEC | 52 | 27.456 | 26.4264 | 0 | 0 | 0 | 17.16 | 17.16 |
JAN | 41 | 32.472 | 27.3306 | 0 | 0 | 0 | 13.53 | 13.53 |
FEB | 55 | 43.56 | 41.382 | 0 | 0 | 0 | 21.78 | 21.78 |
MAR | 101 | 66.66 | 74.6592 | 39.996 | 38.6628 | 0 | 53.328 | 53.328 |
APR | 154 | 50.82 | 83.3448 | 101.64 | 69.1152 | 0 | 81.312 | 81.312 |
MAY | 236 | 0 | 0 | 171.336 | 130.8384 | 0 | 124.608 | 124.608 |
JUN | 279 | 0 | 0 | 220.968 | 187.8228 | 0 | 165.726 | 165.726 |
JUL | 312 | 0 | 0 | 247.104 | 100.9008 | 205.92 | 205.92 | 205.92 |
AUG | 284 | 0 | 0 | 224.928 | 0 | 187.44 | 168.696 | 168.696 |
SEP | 223 | 0 | 0 | 147.18 | 0 | 117.744 | 103.026 | 103.026 |
Total | 242.61 | 284.532 | 1153.15 | 527 | 577 | 1059.76 | 1059.76 |
Table (7)Monthly WD of Sand and Mixture Soil (per Single Jar), liters/month
IJSER © 2014 http://www.ijser.org
International Journal of Scientific & Engineering Research, Volume 5, Issue 9, September-2014 599
ISSN 2229-5518
Evapotra (mm) | Wheat | Barley | Cotton | Sunflower | Corn | Vegetable | Orchard | |
OCT | 168 | 0 | 0 | 0 | 0 | 21.756 | 30.4584 | 30.4584 |
NOV | 82 | 0 | 12.3180 | 0 | 0 | 4.2476 | 10.619 | 10.619 |
DEC | 52 | 5.3872 | 10.3703 | 0 | 0 | 0 | 6.734 | 6.734 |
JAN | 41 | 8.4952 | 10.7251 | 0 | 0 | 0 | 5.3095 | 5.3095 |
FEB | 55 | 17.094 | 16.2393 | 0 | 0 | 0 | 8.547 | 8.547 |
MAR | 101 | 31.390 | 29.2980 | 15.6954 | 15.1722 | 0 | 20.9272 | 20.9272 |
APR | 154 | 39.886 | 32.7065 | 39.886 | 27.1224 | 0 | 31.9088 | 31.9088 |
MAY | 236 | 30.562 | 0 | 67.2364 | 51.3441 | 0 | 48.8992 | 48.8992 |
JUN | 279 | 0 | 0 | 86.7132 | 73.7062 | 0 | 6.50349 | 6.50349 |
JUL | 312 | 0 | 0 | 96.9696 | 39.5959 | 80.808 | 80.808 | 80.808 |
AUG | 284 | 0 | 0 | 88.2672 | 0 | 73.556 | 66.2004 | 66.2004 |
SEP | 223 | 0 | 0 | 57.757 | 0 | 46.2056 | 51.9813 | 51.9813 |
Total | 1987 | 132.8144 | 111.6572 | 452.5248 | 206.9408 | 226.5732 | 368.8963 | 368.8963 |
Note: WD for sand and mixture soils are the same since they have equal irrigable areas.
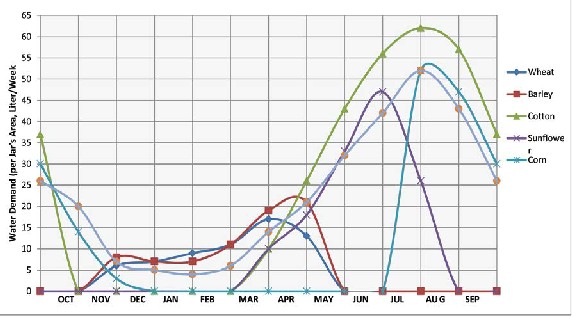
It is preferred to use a weekly irrigation schedule to avoid the water shortage for plant needs and get away from wilting point and fulfilling a maximum production, therefore and to be in safe side it is
suggested to change the monthly WD of Tables (6 & 7) into weekly WD as indicated in [Table (8) & Fig.(7)] and [Table ( 9) & Fig.(8)].
Table (8) Irrigable Water Schedule for Clayey Soil (per Single Jar), liter/week
Evapotra (mm) | Wheat | Barley | Cotton | Sunflower | Corn | Vegetable | Orchard | |
OCT | 168 | 0 | 0 | 0 | 0 | 14 | 20 | 20 |
NOV | 82 | 6 | 8 | 0 | 0 | 3 | 7 | 7 |
DEC | 52 | 7 | 7 | 0 | 0 | 0 | 5 | 5 |
JAN | 41 | 9 | 7 | 0 | 0 | 0 | 4 | 4 |
FEB | 55 | 11 | 11 | 0 | 0 | 0 | 6 | 6 |
MAR | 101 | 17 | 19 | 10 | 10 | 0 | 14 | 14 |
APR | 154 | 13 | 21 | 26 | 18 | 0 | 21 | 21 |
MAY | 236 | 0 | 0 | 43 | 33 | 0 | 32 | 32 |
JUN | 279 | 0 | 0 | 56 | 47 | 0 | 42 | 42 |
JUL | 312 | 0 | 0 | 62 | 26 | 52 | 52 | 52 |
AUG | 284 | 0 | 0 | 57 | 0 | 47 | 43 | 43 |
SEP | 223 | 0 | 0 | 37 | 0 | 30 | 26 | 26 |
Total | 1987 | 63 | 73 | 291 | 134 | 146 | 272 | 272 |
IJSER © 2014 http://www.ijser.org
International Journal of Scientific & Engineering Research, Volume 5, Issue 9, September-2014 600
ISSN 2229-5518
Fig.(7) Weekly WD in Clay Soil (Per Single Jar), Liter/week
Table (9) Irrigable Water Schedule for Sand & Mixture Soil (per Single Jar), liter/week
Evapotra (mm) | Wheat | Barley | Cotton | Sunflower | Corn | Vegetable | Orchard | |
OCT | 168 | 0 | 0 | 0 | 0 | 6 | 8 | 8 |
NOV | 82 | 0 | 4 | 0 | 0 | 2 | 3 | 3 |
DEC | 52 | 2 | 3 | 0 | 0 | 0 | 2 | 2 |
JAN | 41 | 3 | 3 | 0 | 0 | 0 | 2 | 2 |
FEB | 55 | 5 | 5 | 0 | 0 | 0 | 3 | 3 |
MAR | 101 | 8 | 8 | 4 | 4 | 0 | 6 | 6 |
APR | 154 | 10 | 9 | 10 | 7 | 0 | 8 | 8 |
MAY | 236 | 8 | 0 | 17 | 13 | 0 | 13 | 13 |
JUN | 279 | 0 | 0 | 22 | 19 | 0 | 2 | 2 |
JUL | 312 | 0 | 0 | 25 | 10 | 21 | 21 | 21 |
AUG | 284 | 0 | 0 | 23 | 0 | 19 | 17 | 17 |
SEP | 223 | 0 | 0 | 15 | 0 | 12 | 13 | 13 |
Total | 1987 | 36 | 32 | 116 | 53 | 60 | 98 | 98 |
IJSER © 2014 http://www.ijser.org
International Journal of Scientific & Engineering Research, Volume 5, Issue 9, September-2014 601
ISSN 2229-5518
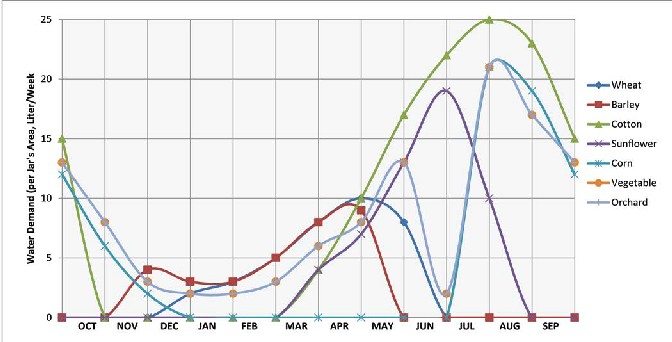
Fig.(8) Weekly WD in Clay Soil (Per Jar's Area), liter/week
To facilitate the irrigation process under the light of the current study, the farmer consults tables (8
& 9) to estimate the weekly volume of WD for the whole farm area (depending on the used number of jars in the field). Accordingly, the farmer should provide the total weekly quantity of water in the storage tank for all jars within the field which are connected to the storage tank as shown in Fig.(9)
Water Tank
Jars Connection
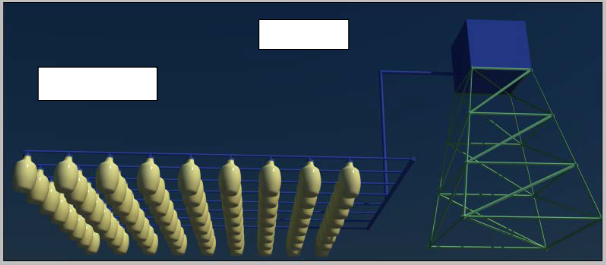
Fig.(9) Jars Connection with Water Tank
1- The hydraulic head more than 0 is not necessary to be used in pitcher irrigation system in this management study.
2- The relationship of water consuming rates with respect to the applied hydraulic heads is
linear in sandy and mixture soils and nonlinear in clayey soil.
IJSER © 2014 http://www.ijser.org
International Journal of Scientific & Engineering Research, Volume 5, Issue 9, September-2014 602
ISSN 2229-5518
It is recommended to use the pitcher irrigation system using the local made clayey jar wherever and whenever water scarcity is dominant and the obtainability of water is too difficult.
![]()
[1] Charles Batchelor, Christopher Lovell, and Monica Murata, (1996)," Simple microirrigation![]()
techniques for improving irrigation efficiency on vegetable gardens” Agricultural Water Management
Journal, Volume 32, Issue 1, November, Pages 37–48
[2] Israelsen, O. W., and Hansen V. E., (1962) “Irrigation Principles and Practices”. UTAH State
University, Logan, UTAH..
[3] Altaf A. Sival, Martinus Th. Van Genuchten and Todd H. Skaggs, (2009), "Performance of Pitcher
Irrigation System" Journal of Soil Science, Volume 174, Number 6, June , www.soilsci.com.
[4] Hossein Malekinezhad, (2014)," Comparison of cucumber and watermelon yield and water use in clay pitcher and furrow irrigation" International Journal of Water.
[5] Padma Vasudevan Sen, Alka Thapliyal, M.G. Dastida, and P.K. Sen, (2007)," Pitcher or Clay Pot
Irrigation for Water Conservation" International Conference on Mechanical Engineering ,(ICM E2007)
29- 31 December, Dhaka, Bangladesh.
[6] Mondal, R. C.,( 1974), “Farming with pitcher: a technique of water conservation”, World Crops,
26 (2): 91-97..
[7] Das, K.G.,( 1983), "Controlled release technology bioengineering aspects", John Wiley and sons, NewYork, pp-15-61.
[8] Bainbridge, D.A.,( 2001), “Buried clay pot irrigation; a little known but very efficient traditional method of irrigation”, Journal of agricultural water management, 48:79-88.
[9] Najah M. Lateef," Hydro-Osmotic Potential Irrigation System (HOPIS)" International Journal of scientific and Engineering Research ISSN 2229-5518, Volume 5 Issue 8, August-2014.
[10] Fadhil Mohammed Al- Mohammed, " The Effect of Pot Volume on the Performance of Pot
Irrigation System" Phd. Theis submitted to the college of Eng. Unv. Of Baghdad, 2010.
IJSER © 2014 http://www.ijser.org