International Journal of Scientific & Engineering Research, Volume 5, Issue 9, September-2014 661
ISSN 2229-5518
Optimization of Low Thermal Disintegration of Sewage Sludge for Improved Biogas Yield Using Box Behnken Design
Muhammad Sani Shehu, Mudi Kehinde Yusuf and Hassan Funsho Akande
Chemical Engineering Department, Kaduna Polytechnic, Kaduna, Nigeria.
Abstract— Modeling and optimization of low thermal disintegration of sewage sludge for enhanced biogas yield was carried out using Response Sur- face Methodology (RSM) and Box–Behnken design of experiment. The individual linear and quadratic effects as well as the interactive effects of temper- ature, stirring rate and time on the degree of disintegration were investigated. The results of Analysis of variance(ANOVA) and multiple regression analy- sis showed that the optimum variables for the thermal disintegration are: 88°C, 227 rpm and 21 min, with actual degree of disintegration (DD) of 55.4%. Linear and quadratic effects of temperature are most significant in affecting the degree of disintegration. The coefficient of determination (R2) of 99.5% confirms that the model used in predicting the degree of disintegration process has a very good fitness with the experimental variables. The disintegrat- ed sludge increased the biogas yield by 60% v/v compared to non-disintegrated sludge. The RSM with Box–Behnken design is an effective tool in pre- dicting the optimum degree of disintegration of sewage sludge for increased biogas yield.
Index Terms— Anaerobic digestion, Box -Behnken design, Disintegration, Optimization, Sewage Sludge, Response surface methodology.
—————————— ——————————
1 INTRODUCTION
NAEROBIC DIGESTION (AD) is the most widely used treatment process for stabilization of resultant sewage sludge from municipal wastewater treatment plant. AD
is a multi-stage process involving hydrolysis, acidogenesis, acetogenesis and methanogenesis. Hydrolysis has been identi- fied as the rate-limiting step in the overall anaerobic digestion process.1 The organic components of hard cell walls including cellulose, hemicellulose and lignin and other recalcitrant com- pounds of proteins and lipids cause the rate of anaerobic di- gestion to be slow, leading to relatively high retention time of about 20–50 days and a low overall degradation efficiency of about 20–50% in mesophilic digestion.2 In order to overcome this problem, disintegration process is employed as a form of pretreatment to improve anaerobic digestion process and to enhance biogas yield. Disintegration process is achieved by appli- cation of chemical, mechanical, physical and combination of these methods to break down cell wall; the cell wall and membrane are fragmented and cell inclusions are released, making them available to the bacterial enzymes for the digestion, hence the hydrolysis is enhanced and consequently improves the biogas yield.
Many researchers have recently investigated the various tech- niques of sludge disintegration. Among those reported are chemical methods using alkaline, ozonation and acid applica- tions,3 mechanical methods employing ultrasound, high pres- sure homogenizer or ball milling4,5, thermal methods at low and high temperatures,6 freezing and thawing7 and biological methods involving the application of certain microorganisms.8
Combinations of these techniques were also investigated and appreciable improvements in sludge degradability were rec- orded. These include combinations of alkaline and ultrasonic9; ozone oxidation and ultrasonic,10 ball milling and ozonation,11 mechanical and thermal.12
According to Deublein and Steinhauser,13 disintegration can
also reduce the sludge volume by 50%.This means less cost of polymer for dewatering process of the sludge as well as for its disposal. The biogas yield of sewage sludge can be increased to about 350 – 375 L/ kg dry matter by disintegration. If degraded sludge is held for 1 h at 70° C and then further degraded for another
15 days, an increase in the biogas yield of 25% can be achieved. When decomposing at an elevated temperature of 55° C, after ther- mal disintegration an increase in the gas yield of up to 50% is even possible.
The objective of this paper is hence to investigate the effects of
major variables affecting low temperature disintegration of
sewage sludge and also to establish the interactions between
these variables on the degree of disintegration (DD) as well as
the optimum yield of biogas generation. To achieve this objec-
tive, STATISTICA 6.0 software was employed to carry out
modeling and optimization using the Box Behnken Design
(BBD) of Experiment.
2 MATERIALS AND METHODS
2.1 Sampling and Analysis of Sewage Sludge
The sewage sludge formed at primary and secondary clarifi- ers of a Sewage Treatment Plant (STP) was sampled from a sampling point on the line to the digesters in the sludge treat- ment unit of the plant. The samples were placed inside plastic bottles of 5 liters, and covered tightly with its lids and then kept in a refrigerator at 4°C.
2.2 Total Solids (TS)
This represents the solid content of the sludge that remains after evaporation and drying at 105°C. A quantity of the sludge was taken and placed on a previously weighed cruci- ble. The crucible containing the sludge was then weighed. It
IJSER © 2014 http://www.ijser.org
International Journal of Scientific & Engineering Research, Volume 5, Issue 9, September-2014 662
ISSN 2229-5518
was then placed in an oven at 105°C for 24 hours. The solids were weighed by subtraction, and as a percentage of the initial sample.
2.2 Volatile Solids (VS
This represents the quantity of organic matter in the sludge which is available for biodegradation. VS was determined as the portion of TS that volatilize upon heating at 550°C in a furnace for 24 hours. The remaining ash is subtracted from TS to get the VS.
2.3Total Nitrogen (TN)
The TN of the sludge was determined according to HACH method. The HACH reactor was preheated to 105°C. One TN persulfate reagent powder pillow content was added to each of the two TN hydroxide reagent vials. 2ml of distilled water was added to one vial as blank and 2ml of diluted sludge sample was added to the other vial as sample. The vials were capped and shaken several time(s) to mix. The vials were then placed in the reactor and heated to 105°C for 30 min to digest. The vials were then removed from the reactor and allowed to cool to room temperature.
Standard TN reagent A by HACH was added to both vials, capped and shaken for 15 seconds and then allowed to react for 3 min. Standard TN reagent B was added to both vials, capped and then shaken for 15 seconds and then allowed to react for 2 min.
2ml from each of the vials mentioned above was transferred into Standard TN reagent C vials capped tightly and inverted several times to mix; and then allowed to react for 5 min. HACH DR2800 spectrophotometer was ready and the pro- gram for TN selected. The blank was inserted into the adapter and closed to impede light effects. The ZERO button was pressed. The sample vial was then inserted into the spectro- photometer and the READ button was pressed to display the quantity of total nitrogen in the diluted sludge. The actual value for the total nitrogen is determined by multiplying the displayed value with the dilution factor.
2.4 Chemical Oxygen Demand (COD)
COD is widely used to describe organic matter content. In this case, it refers to the amount of oxygen required to oxidize organic matter in the sludge. The soluble COD refers to the amount of COD that is accessible to microbes. It also refers to the COD that passes through 0.45µm membrane filter after centrifugation of the sample at 5000rpm for 10 min.
Both the total and soluble COD were determined using the
HACH colorimetric method. The COD reactor was preheated to 150°C. 2ml each of the diluted sample and distilled water were transferred into 2 ‘high range’ COD vials, and labeled “sample” and “blank” respectively. The vials were capped tightly and inverted several times to mix, and then placed in the reactor and heated at 150°C for 2 h. The reactor heating stopped automatically as programmed, and the vials were allowed to cool to 120°C before being removed from the reac- tor. The vials were finally allowed to cool to room tempera- ture.
DR 890 colorimeter was ready and the program for COD high range selected. The vials were wiped with paper towel to re- move finger prints and then the blank was inserted into the adapter and covered, after which the ZERO button was pressed. The sample vial was also inserted and the READ but- ton was pressed to display the COD reading for the diluted sample. The actual value of the COD was obtained by multi- plying the displayed value by the dilution factor.
Experimental Design: The thermal methods of sludge disinte- gration were investigated to see the effects of temperature, time and speed of mixing in swelling up the cell wall and sub- sequent rupturing of the cell wall for better biodegradation and consequent biogas yield increase. The degree of disinte- gration was measured as a fraction of the solubilized organic matter. In this case, the soluble COD of sludge was measured before and after the disintegration process.
The Degree of Disintegration (DD) is expressed as percentage and is given by:
DD% = * 100 (1)
Where SCODt is the soluble COD of the treated (disintegrated sludge), SCODr is the raw sludge soluble COD and SCODmax is the maximum Soluble COD of the sludge that has been treated with a 1M NaOH for 22 h.
The three factor Box-Behnken Model was used as design of experiment to optimize the key variables influencing the disin- tegration methods considered in this research. The three fac- tor Box-Behnken design has the advantages of requiring a fewer number of runs and is rotatable if the variance of the predicted response at any point x depends only on the dis- tance of x from the design center point.14 The three-factorial design also offers an effective estimation of second order quadratic polynomials and gives the combination of values that optimizes the response within the region of the three di- mensional observation space.15 The Response Surface Meth- odology (RSM) of the disintegration experiments was con- ducted in other to achieve optimum degree of disintegration of the sludge which in turn indicates an optimum yield of bio- gas production. For statistical analysis, the relationship be- tween the coded and the actual variables can be expressed in the form of equation (2):
IJSER © 2014 http://www.ijser.org
International Journal of Scientific & Engineering Research, Volume 5, Issue 9, September-2014 663
ISSN 2229-5518
 (2) (
(2) (
Where Xi is the coded value of the ith independent variable, Zi is the actual
(uncoded) value of the ith independent variables. Zi * is the actual center point value of the ith independent variable and
∆Zi is the step increase or change value. The variables and their respective levels for the thermal disintegration are shown in Table 1.
A polynomial model of quadratic form was used to fit the experimental data obtained during the disintegration ex- periments:
Y = β0 + β1X1 + β2 X2 + β3 X3 + β12X1 X2 + β13 X1 X3 + β23 X2X3 +
β11 X1 2 + β22 X22 + β33 X3 2 (3)
Where Xi are independent variables upon which Y is depend- ent, β0 is the offset or constant term, while βi is the ith linear coefficient, βii and βij are the quadratic and interaction coeffi- cients respectively.
STATISTICA 6.0 was used for analysis of variance (ANOVA), canonical and multiple regression analysis of the data ob- tained. The fit of regression model was checked by coefficient of determination R2. Fisher’s test F and its associated probabil- ity P were used to determine the overall model significance. The significance of the respective independent variables on dependent variable was tested using p-test,response surface plots and Pareto charts. The model coefficients were deter- mined by application of multiple regression analysis, and the model solved to determine the optimum operating variables in question.

Table-1: Experimental Design Variables for Thermal Disinte- gration
Independent variables | | Symbol | Coded levels |
| Coded | Uncoded | -1 | 0 | 1 |
Temperature, °C | X1 | | Z1 | 70 | 80 | 90 |
Stirring Speed, rpm | X2 | | Z2 | 100 | 200 | 300 |
Time, min | X3 | | Z3 | 10 | 20 | 30 |
Thermal disintegration was conducted in a beaker on hot stir- ring plate. A 100ml sample of the sludge was placed in the beaker, and heated at different temperatures and durations, while constantly stirred using magnetic stirrer at speeds be- tween 100 and 300 rpm. The temperature was varied between
70 to 90°C. Also the time for treatment was varied from 10 to
30 minutes. Using the Box-Behnken Design (BBD), 12 experi- mental runs were carried out, and the center point was repli- cated three times to estimate errors. A total of 15 experimental runs were conducted.
2.5 Biogas Generation Experiment
Laboratory experiments on biogas generation from the disin- tegrated sewage sludge were conducted. Three plastic bottles of 1.5 L size were used as the digesters for the thermally treat- ed sludge. 1 Liter of the sludge disintegrated at optimum var- iables was placed in the bottle, and 200 ml of activated sludge was added as inoculum. The bottle was capped and tubing fixed to the cap, polymer sealant was applied to ensure no air entrainment. The initial pH was recorded as neutral before the start of anaerobic digestion (AD). Nitrogen gas was purged through to expel oxygen from the digester and make it air tight. The digester was then quickly and carefully attached to the gas bag for collection. The gas volume produced was measured using 100 ml syringe by repeatedly siphoning the collected gas until the bag is completely empty. The volume of the biogas was measured after 3 days interval.
3.0 RESULTS AND DISCUSSION
Table 2 shows that the sewage sludge is low in solids. This is as a result of low VS and hence low yield of biogas is achieved in the plant, since the sludge contains only 1.89% as solids, and the rest is water. The Carbon to Nitrogen C/N ratio of about 14 is relatively low, and can be improved through co- digestion or as mentioned earlier by increasing the population equivalent (PE).
Table-2: Sludge Characteristics
S/N | Parameters | Values (mg/l) |
1 | Total Solids (TS) | 18,900 (1.89%) |
2 | Volatile Solids (VS) | 13,800 (1.38%) |
3 | Total Nitrogen (TN) | 580 |
4 | Total COD | 17, 200 |
5 | Soluble COD | 1,290 |
6 | Max. SCOD | 13,650 |
7 | pH | 6.91 |
Model Fitting: The data obtained were used in STATISTICA to determine the coefficients of the quadratic polynomial model equation which are used to predict optimum degree of disintegration. Results of multiple regressions (shown in ap- pendix) for the thermal disintegration yielded the coefficients of the model as:
Y = -955.366 + 23.931X1 - 0.207X2 – 1.478X3 + 0.002X1X2 +
0.002X1 X3 + 0.003X2 X3 – 0.141X1 2 + 0.022X32
(4)
The Box-Behnken Design applied for the thermal disintegra
IJSER © 2014 http://www.ijser.org
International Journal of Scientific & Engineering Research, Volume 5, Issue 9, September-2014 664
ISSN 2229-5518
tion experiment and the response is shown in Table 3.
Table 3:The Box-Behnken Design (BBD)
Run No | Temperature, °C | Stirring rate, rpm | | Time, min. | Solublization |
| coded | uncoded | coded | uncoded | Coded | uncoded | sCOD mg/l | % DD |
1 | -1 | 70 | -1 | 100 | 0 | | 20 | 2850 | 12.62 |
2 | 1 | 90 | -1 | 100 | 0 | | 20 | 7190 | 47.73 |
3 | -1 | 70 | -1 | 300 | 0 | | 20 | 3900 | 21.12 |
4 | 1 | 90 | 1 | 300 | 0 | | 20 | 9210 | 64.07 |
5 | -1 | 70 | 0 | 200 | -1 | | 10 | 3350 | 16.67 |
6 | 1 | 90 | 0 | 200 | -1 | | 10 | 7630 | 51.54 |
7 | -1 | 70 | 0 | 200 | 1 | | 30 | 4120 | 22.89 |
8 | 1 | 90 | 0 | 200 | 1 | | 30 | 8550 | 58.74 |
9 | 0 | 80 | 1 | 200 | -1 | | 10 | 7270 | 48.38 |
10 | 0 | 80 | -1 | 100 | -1 | | 10 | 7880 | 53.32 |
11 | 0 | 80 | 1 | 300 | 1 | | 30 | 6900 | 45.39 |
12 | 0 | 80 | -1 | 100 | 1 | | 30 | 9140 | 63.51 |
13 | 0 | 80 | 0 | 200 | 0 | | 20 | 7200 | 47.82 |
14 | 0 | 80 | 0 | 200 | 0 | | 20 | 7270 | 51.62 |
15 | 0 | 80 | 0 | 200 | 0 | | 20 | 7290 | 48.54 |
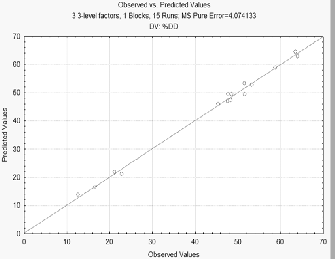
The Analysis of Variance (ANOVA) is an essential tool for testing the significance and adequacy of the model. The goodness of fit of the model was checked by the value of R2 which implies that 99.5% of the variation can be explained by the model. The significance of each variable is determined by F- and P-values. The F-value of the model as indicated in Ta- ble 4 is 13.17 with a very low probability (P) value of 0.0006 implying a high significance of the model.

Table-4: ANOVA for the Thermal Disintegration Model
Statistics
The significance of the linear and quadratic as well as the in- teractive terms of the model is checked in the same manner, with the X1 (temperature) and its quadratic term being the most significant and the interactive terms being the least sig- nificant among other terms in influencing the degree of disin- tegration. Similarly, the table shows “lack of fit” having F- value of 0.97 and a p-value of 0.5427 and this implies that the lack of fit is not significant; meaning that hence, the model is adequate for prediction. This fact is further illustrated by the plot of predicted versus observed values and is shown by in Figure 1. The predicted variables are in good agreement with those observed and that shows that the model significantly fitting and describes the process with high confidence level.
Source
SS df MS F- value
P- Val- ue
Model 3105.41 3 1035.14 13.17 0.0006
X1 + X12 3496.72 2 1748.36 429.137 0.0023
X2 + X22 291.08 2 145.54 35.72 0.0272
X3 + X32 71.07 2 35.53 8.72 0.1027
X1 X2 15.25 1 15.25 3.74 0.1927
X1 X3 0.24 1 0.24 0.06 0.8308
X2 X3 43.49 1 43.49 10.66 0.0824
Residual 864.41 11 78.58
Lack of
Fit 11.90 3 3.97 0.97 0.5427
Pure Er-
ror 8.15 2 4.07
Corr.
Total 3969.82 14
Coefficient of Determination R2 = 0.995
Figure 1: Model (predicted) versus Expirement (observed)
IJSER © 2014 http://www.ijser.org
International Journal of Scientific & Engineering Research, Volume 5, Issue 9, September-2014 665
ISSN 2229-5518
Analysis of Response Surface and Pareto Chart: In order to visualize the effect of the independent variables on the de- pendent variable, response surface plots and Pareto chart of the polynomial model were generated using the STATISTICA
6.0
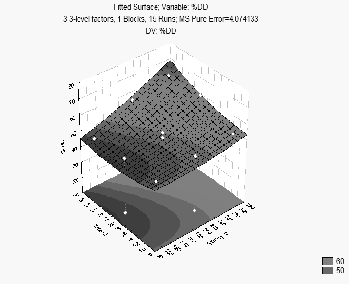
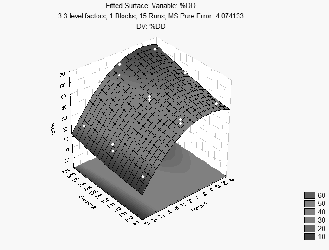 Figure 3: Effect of Temperature and Time
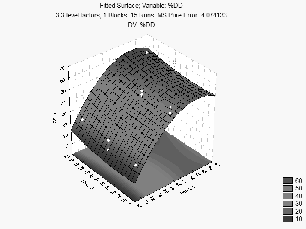
Figure 2: Effect of Temperature and Stirring Response Surface
Plot
The surface response plot (Figure 2 ) shows the combined ef- fect of temperature and stirring on the degree of thermal disin- tegration. The maximum %DD is achieved at high tempera- ture and medium stirring. It also shows that the temperature has both linear and quadratic effect on %DD and is significant. Similarly Figure 3 indicates the significance effect of tempera- ture on the %DD. The maximum %DD can be achieved also at high temperature and moderate time. The effects of time and stirring are found to be linear and less significant as shown by Figure 4.
The Pareto chart shown by Figure 5 elaborates the response
surface plots indicating that the temperature is most signifi-
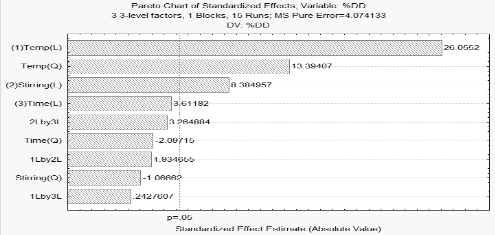
cant with both linear and quadratic effect at 95% confidence level indicated by p = 0.05. Stirring has some significant effect while time is not significant. This shows that the thermal dis- integration at 90°C can be achieved at minimum time and moderate stirring indicating that disintegration will not delay the process of the sludge treatment and with attendant faster anaerobic digestion and overall process intensification.
Figure 5: Pareto Chart Showing Signif- icance of Variables and their Interac- tions
Figure 4: Effect of Stirring and Time
Optimization of the Disintegration Using the Model: From
International Journal of Scientific & Engineering Research, Volume 5, Issue 9, September-2014 666
ISSN 2229-5518
the regression results as shown in the appendix, the solution
of the polynomial quadratic model equation 2 which repre- sents the optimum coded variable is:
X1 = 0.834692, X2 = 0.268617, X3 = 0.115707
And the actual corresponding optimum variables are calculat-
ed from equation 1 as:
Z1 = 88.35°C, Z2 = 226.86rpm and Z3 = 21.2min Substituting the actual values into the model equation (4) by replacing the coded variables gives the optimum degree of
thermal disintegration
[4] Kopp, J., Muller, J., Ditchtl, N., Schwedes, J., Anaero- bic digestion and dewatering characteristics of me- chanically disintegrated excess sludge, Wat. Sci. and Tech., 1997, 36(11), 129-136.
[5] Rai, C., L.,, Rao, P., G., Influence of sludge disintegra- tion by high pressure homogenizer on microbial growth in sewage sludge: an approach for excess sludge reduction, Clean Techn. Environ. Policy, 2009,
Y = -955.366+23.931(88.35) - 0.207(226.86) -1.478(21.2) + 0.002(88.35)(21216,.48367) -+44(60. .002)(88.35)(21.2) +
0.003(226.86)(21.2) - 0.141(88.35)2 + 0.022(21.2)2
= 56.94%
Confirmatory experiments were run three times under adjust-
ed optimum variables and an average value of degree of disin-
tegration was calculated as 55.4%.This represents the optimum
value for the disintegration at the optimum variables deter-
mined by the regression analysis of the polynomial model.
The percentage increase in biogas volume from the treated
sludge compared to that from untreated sludge was found to
be 60%. The average methane content of the biogas for the
disintegrated sample was found to be 62.7%. This further con-
firms the influence of disintegration pretreatment over the
anaerobic digestion for biogas generation.
CONCLUSION
The modeling and optimization of the disintegration tech- niques employed in this research proved that the optimum degree of disintegration using low temperature disintegration was 55.4% at optimum variables of 88°C, 227 rpm and 21 min retention time. The coefficient of determination (R2) of 99.5% shows that the model used in predicting the disintegration process has a very good fit with the experimental variables. Low thermal disintegration of sewage sludge employing low temperature at optimized condition can increase the biogas yield by about 60% v/v.
REFERENCE
[1] Kim, J., Part, C., Kim, T., H.,, Lee, M., Kim, S., Kim, S., W.,, Lee, J., Effects of various pretreatment for en- hanced anaerobic digestion with waste activated sludge. J. Bioscience and Bioengineering, 2003, 95(2),
271-275.
[2] Weemaes, M., P., J.,, Willy, H., Verstraete, Evaluation of Current Wet Sludge Disintegration Techniques, j. Chem. Technol. Biotechnol., 1998, 73, 83-92.
[3] Bougrier, C., Abbasi, C., Delgenes, J., P.,, Carrere, H., Effect of ultrasonic, thermal and ozone pretreatments on waste activated sludge solubilisation and anaero- bic biodegradability, Chemical Engineering Process,
2006, 45, 711-718.
[6] Barjenbruch, M., Kopplow, O., Enzymatic, mechanical and thermal sludge pretreatment of surplus sludge, Adv. Environ. Res., 2003, 7, 715- 720.
[7] Montusiewicz, A., Lebiocka, M., Rożej, A., Zacharska, E., Pawłowski, L., Freezing/thawing effects on anaer- obic digestion of mixed sewage sludge, 2010, Biore- source Technology, 101(10), 3466-3473.
[8] Hasegawa, S., Shiota, N., Katsura, K., Akashi, A., Sol- ubilization of organic sludge by thermophilic aerobic bacteria as pretreatment for anaerobic digestion, 2000, Wat. Sci. and Tech., 41(3), 163-169.
[9] Chiu, Y., C.,, Chang, C., N.,, Lin, J., G.,, Huang, S., J., Alkaline and ultrasonic pretreatment of sludge before anaerobic digestion. Wat. Sci. and Tech., 1997, 36(11),
155-162.
[10] Erden, G., Demir, O., Filibeli, A. Disinegration of bio- logical sludge:Effect of ozone oxidation and ultrasonic treatment on aerobic digestibility, Bioresource Technol- ogy, 2010, 101, 8093-8098.
[11] Myoung, J., L.,, Tae, H., K.,, Ga, Y., Y.,, Boo, K., M.,, Sun, J., H., Reduction of Sewage Sludge by Ball Mill Pretreatment and Mn Catalytic Ozonation, KSCE Journal of Civil Engineering, 2010, 14(5), 693-697.
[12] Wett, B., Phothilangka, P., Eladawy, A , Systematic comparison of mechanical and thermal sludge disin- tegration technologies. Waste Management, 2010, 30,
1057-1062.
[13] Dieter Deublein, Angelika Steinhauser, Biogas from Waste and Renewable Resources: An Introduction, 2008, Wiley VCH, Germany.
[14] Box, G., E.,P.,, Behnken, D., W., Three level design for the study of quantitative variables Technometrics,
1960, 2, 455-475.
[15] Annadurai, G., Balan, S., M.,, Murugesan, T., Box-
IJSER © 2014 http://www.ijser.org
International Journal of Scientific & Engineering Research, Volume 5, Issue 9, September-2014
ISSN 2229-5518
Behken design in the development of optimized com plex medium of phenol degradation using pseudo monas putida (NICM 2174). Bioprocess Eng., 1999,21,
315-321.
667
IJSER lb) 2014
http://www.ijserorq