International Journal of Scientific & Engineering Research Volume 2, Issue 6, June-2011 1
ISSN 2229-5518
Online Graphical Display of Blood Oxygen
Saturation and Pulse Rate
Dilpreet Kaur, Sukhwinder Kumar, Shashi Sharma
Abstract—This paper will design a non-invasive pulse oximeter using the ADuC842 microcontroller. A pulse oximeter is a medical device that indirectly monitors the oxygen saturation of a patient's blood and heart rate. The hardware has been developed for the pulse oximeter and programming/coding has been done for calculating blood oxygen saturation and pulse rate of a patient. The results are displayed on the OLED or transported to PC. The software used is ASPIRE (Advanced Systems Programming Integrating Real-time Emulation) verion 1.05. Assessing a patient’s need for oxygen is the most essential element to life; no human life thrives in the absence of oxygen.
Index Terms— Heart rate, microcontroller, oxygen saturation, pulse oximeter.
1 Introduction
—————————— • ——————————
In the earlier days, the common method used to measure blood oxygen saturation was arterial blood gas measurement. An Arterial Blood Gas (ABG) is a blood test that is performed using blood from an ar- tery. It involves puncturing an artery with a thin needle and syringe and drawing a small volume of blood. This method was invasive, expensive, difficult, painful and potentially risky.
The pulse oximeter [1] [5] was introduced in the ear-
ly 1980s. It is particularly a convenient, non-invasive measurement instrument. Pulse oximeter is less expen- sive compared to the old health monitoring devices, simple to use as it needs no user calibration, small enough to be wearable and accurate enough for clinical use. For these reasons, in almost every hospital, critical care units and surgical theatres; the pulse oximeter is acknowledged as a standard monitoring device.
Pulse oximeter is recommended for the monitoring of patients during anesthesia or those with conditions
such as asthma. It is used to assess the viability of limbs after plastic and orthopaedic surgery. It is rec- ommended as an important care tool for new born in- fants and patients during surgery. Pulse oximeters are also useful for pilots operating in a non-pressurized aircraft above 10,000 feet where supplemental oxygen is required. It is also useful for mountain climbers and athletes whose oxygen levels may decrease at high altitudes or with exercise.
2 Overview
The principle [6] of pulse oximetry is based on the red and infrared light absorption characteristics of oxygenated and deoxygenated haemoglobin. Oxyge- nated haemoglobin absorbs more infrared light and allows more red light to pass through whereas deox- ygenated (or reduced) haemoglobin absorbs more red light and allows more infrared light to pass through. Red light is in the 600-750 nm wavelength light band whereas infrared light is in the 850-1000 nm wave- length light band. The absorption relationship of oxy- gen levels in the blood for the red and infrared wave- lengths is shown in figure 1.
————————————————
Dilpreet Kaur is currently pursuing masters degree program in electronics and communication engineering at Institute of Technology and Manage- ment, Gurgaon, Haryana, India. E-mail: er.dilpreetkaur@gmail.com
Figure 1: Absorption relationship of oxygen levels in the blood for the red and infrared wavelengths
IJSER © 2011 http://www.ijser.org
International Journal of Scientific & Engineering Research Volume 2, Issue 6, June-2011 2
ISSN 2229-5518
There are two methods [2] of sending light through the measuring site, transmission and the reflectance. In the transmission method, the emitter and the photo detector are opposite of each other with the measuring site in-between. The light can then pass through the site. In the reflectance method, the emitter and photo detector are next to each other on top of the measuring site. The light bounces from the emitter to the detector across the site.
With each heart beat, the heart contracts and there is a surge of arterial blood, which momentarily increases arterial blood volume across the measuring site. This results in more light absorption during the surge. If light signals received at the photodiode are looked at
'as a waveform', there should be peaks with each heartbeat and troughs between heartbeats.
A newborn’s heart rate [4] [7] is typically around
120 beats per minute (bpm). A heart rate in the vicinity
of 70 beats per minute (bpm) is considered normal for
an adult. When a person enters his golden years, the heart rate slows to approximately 50 bpm. When exer- cising, the heart rate may double. Accounting for all of this data, to say, 50 to 200 bpm are considered good readings for the heart rate.
For the blood oxygen saturation [3] [9], the follow- ing table must be taken into account:
TABLE 1
SPO2 INTERPRETATION
SpO2 Reading (%) | Interpretation |
95-100 | Normal |
91-94 | Mild Hypoxemia |
86-90 | Moderate Hypoxemia |
<85 | Severe Hypoxemia |
Where hypoxemia is defined as decreased partial pressure of oxygen in blood and low oxygen availabili- ty to the body or an individual tissue or organ.
3 Work done
The block diagram of pulse oximeter is shown in figure 2. It consists of seven stages namely; PPG probe, switching and LED driver circuit, I/V converter, am- plifier stage, ADC stage, microcontroller and LCD dis- play.
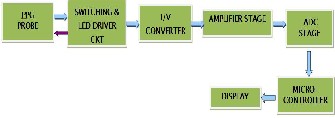
Figure 2: Block diagram of pulse oximeter
1. PPG Probe: A PPG (Photoplethysmograph) probe [8] senses the PPG signal from the flow rate of our blood and converts it into the electrical signal with the help of receiver and the source. The signal produced upto here is from 0 to 1.5 volts. The probe model number used is DS-100A manufactured by Nellcor. It is a reusable sensor for spot checks or short-term monitoring. PPG probe has adult finger sensor which is used for pulse oximeters. A DB9 connector is connected to the probe which has 9 pins. The application site of the probe includes ear, head, finger and toe. The cable length is 3ft/0.9m - 10ft/3.0m. There are various features of the PPG probe such as easy to use and design, built in shielding which protects the signal from electronic noise, high quality LEDs that maximize tracking capabilities and sensor head design which optimizes the signal and shields the detector from ambient light. Figure 3 shows the Nellcor SpO2 sensor.
Figure 3: Nellcor SpO2 sensor
2. Switching and LED driver circuit: In switching and LED driver circuit, there are two transistors and two NOT gates which are used for switching the LEDs. IC
7404 is used as NOT gate. When one LED is on, the other will be off and vice-versa. Thus, when red LED is
on, infrared LED will be off and when infrared LED is on, red LED will be off. Red LED corresponds to oxy-
IJSER © 2011 http://www.ijser.org
International Journal of Scientific & Engineering Research Volume 2, Issue 6, June-2011 3
ISSN 2229-5518
genated haemoglobin whereas infrared LED corres- ponds to deoxygenated haemoglobin.
3. I/V converter: The signal obtained upto here is in the form of current. We have to change this signal to its voltage form. For this we need, current to voltage con- verter. A current to voltage converter is an electrical device that takes an electric current as an input signal and produces a corresponding voltage as an output signal. It is also known as trans-impedance amplifier. IC UA741 is used as a current to voltage converter.
4. Amplifier stage: The signal obtained upto here is of the order of 0 to 1.5 volts. In order to amplify the signal, we need an amplifier. An amplifier amplifies the signal. IC UA741 is used as an amplifier with two potentiometers to adjust the dc level of the signal. We have to set the gain for both the potentiometers such that the signal is above ground level and no clipping of the waveform is there in both the positive as well as the negative half of the cycle.
5. ADC stage: ADC stands for analog to digital converter. The signal obtained is in the analog form. In order to give the signal to microcontroller, we have to change the analog signal to its digital form. We are using ADuC842 microcontroller which has on-chip ADC. The key features of ADC include on-chip reference of 2.5V, single supply, fast, 8 channels, 12-bit resolution, multi-channel mux, track and hold, calibration features etc. The ADCCON1 and ADCCON2 are two SFRs that need to be configured while writing the program. The ADC converter consists of a conventional successive approximation converter. The converter accepts an analog input range of 0V to Vref. The external reference can be in the range of 1V to AVdd.
6. Microcontroller: The microcontroller used is ADuC842. The features of ADuC842 mainly include increased performance i.e. single-cycle 20 MIPS 8052 core and high speed 420 kSPS 12-bit ADC, increased memory i.e. up to 62 kBytes on-chip Flash/EE pro- gram memory and 4 kBytes on-chip Flash/EE data memory, in-circuit reprogrammable of 2304 bytes on- chip data RAM, smaller package i.e. 8 mm × 8 mm chip scale package and 52-lead PQFP, 8-channel, 420 kSPS high accuracy, 12-bit ADC, DMA controller, high speed ADC-to-RAM capture, two 12-bit voltage output DACs, dual output PWM L:-� DACs, on-chip tempera- ture monitor function, 8051 compatible instruction set (20 MHz max), 32 kHz external crystal, on-chip pro- grammable PLL, 12 interrupt sources, 2 priority levels, dual data pointers, extended 11-bit stack pointer, on-
chip peripherals like time interval counter (TIC) and watchdog timer (WDT), core clock of 2.098 MHz. Fig- ure 4 shows the ADuC842 microcontroller card which is used in the circuit.
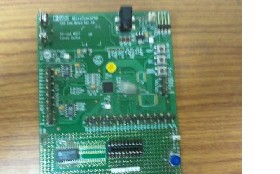
Figure 4: ADuC842 microcontroller card
7. Display: The display used for showing the values for blood oxygen saturation and pulse rate along with the waveform is OLED display. An Organic Light Emitting Diode (OLED) is a LED in which the emissive electroluminescent layer is a film of organic compounds which emit light in response to an electric current. OLED is a new technology and has features like low thermal dissipation, high pixel density, excellent clarity, thinner and lighter than LCDs etc. In dark rooms, an OLED screen can achieve a higher contrast ratio than an LCD. We have used pOLED-
32028-P1 in the circuit which has features like screen outline of 49.1 x 67.3 mm, active area of 43.2 x 57.6 mm, near 180 degree viewing angle, diagonally its size is of
2.83”, PCB size is of 49.1 x 67.3 x 11.0mm, voltage
supply from 4.5V to 5.5V, current @ 90mA nominal when using a 5.0V supply source, powered by the fully integrated PICASO-GFX Graphics Processor etc.
Figure 5 shows the OLED display which is used in the circuit.
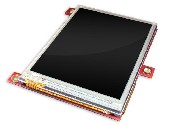
Figure 5: OLED display
IJSER © 2011 http://www.ijser.org
International Journal of Scientific & Engineering Research Volume 2, Issue 6, June-2011 4
ISSN 2229-5518
We have interfaced the ADuC842 microcontroller with the PICASO-GFX microcontroller which is inte- grated on the OLED display.
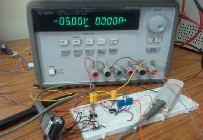
Figure 6 shows the bread board testing of the circuit before the final implementation on the PCB.
Blood oxygen saturation (SpO2) can be calculated according to the following formula:
SpO2= HbO2x100% / Hb + HbO2
where SpO2 is the percentage of blood oxygen satura- tion
HbO2 is the amount of oxygenated hemoglobin Hb is the amount of deoxygenated hemoglobin Hb+HbO2 is the total hemoglobin
4 RESULTS
Figure 6: Bread board testing of the circuit
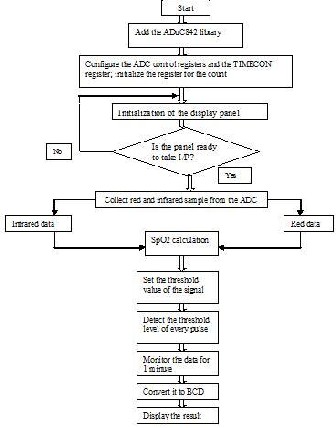
After making the hardware, next step was to write the code for the circuit. The code was written in assembly language and the PICASO libraries were added in the code. Figure 7 shows the flowchart for the calculation of blood oxygen saturation and heart rate of a patient.
The result is the blood oxygen saturation and heart rate in digital values as well as the waveform on the OLED display. Figure 8 shows the waveform for the heart rate.
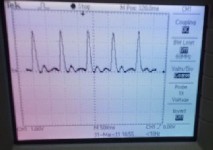
Figure 8: Waveform for the heart rate
5 CONCLUSION
The pulse oximeter is a very useful device for moni- toring patients during anesthesia, intensive care, emergency departments, general wards or those with conditions such as asthma. The system uses the ADuC842 as a microcontroller and has very low power consumption. The system has attractive features to measure the SpO2 and the pulse rate. The program- ming is done in assembly language. The display panel used is OLED which is a new technology and has high pixel density.
Figure 7: Flowchart for the calculation of SpO2 and heart rate
REFERENCES:
[1] Cho Zin Myint, Nader Barsoum, Wong Kiing Ing, “Design a medi- cine device for blood oxygen concentration and heart beat rate”,
IJSER © 2011 http://www.ijser.org
International Journal of Scientific & Engineering Research Volume 2, Issue 6, June-2011 5
ISSN 2229-5518
Global Journal on Technology and Optimization, June 2010.
[2] Maziar Tavakoli, Student Member, IEEE; Lorenzo Turicchia, and Rahul Sarpeshkar, Senior Member, IEEE, “An Ultra-Low-Power Pulse Oximeter Implemented with an Energy-Efficient Transim- pedance Amplifier”, IEEE transactions on Biomedical circuits and systems, VOL. 4, NO. 1, February 2010.
[3] Pawan K. Baheti, Harinath Garudadri, “An Ultra low power pulse
oximeter sensor based on compressed sensing”, IEEE Computer
Society, 2009.
[4] Susannah Fleming, Lionel Tarassenko, Matthew Thompson, and David Mant, “Non-invasive Measurement of Respiratory Rate in Children Using the Photoplethysmogram”, 30th Annual Interna- tional IEEE EMBS Conference, August 2008.
[5] Stephan Reichelt_, Jens Fiala, Armin Werber, Katharina Förster, Claudia Heilmann, Rolf Klemm, and Hans Zappe, “Development
of an Implantable Pulse Oximeter”, IEEE transactions on Biomedi-
cal Engineering, VOL. 55, NO. 2, February 2008.
[6] Guowei Di, Xiaoying Tang, Weifeng Liu, “A Reflectance Pulse Oximeter Design Using the MSP430OF149”, IEEE/ICME Interna- tional Conference on Complex Medical Engineering, 2007.
[7] Hassan Deni, Diane M. Muratore, Robert A. Malkin, “Development of a Pulse Oximeter Analyzer for the Developing World”, IEEE,
2005.
[8] Panayiotis A. Kyriacou, Sarah Powell, Richard M. Langford, and Deric P. Jones, “Esophageal Pulse Oximetry Utilizing Reflectance Photoplethysmography”, IEEE transactions on Biomedical Engi- neering, VOL. 49, NO. 11, November 2002.
[9] Juan M. Lopera, Juan Diaz, Miguel J. Pneto and Fernando Nuno, “Pulse oximeter for homecare”, IEEE Proceedings of the Second Joint EMBSBMES Conference, October 2002.
IJSER © 2011 http://www.ijser.org