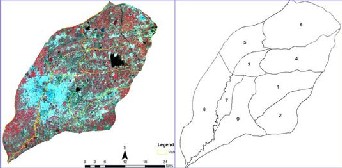
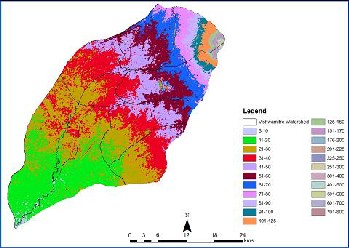
9-mini-watersheds in the Viswamitre watershed. The Indian Remote Sensing Satellite (IRS) LISS-IV data along with mini- watershed boundary is shown in Figure-2.
International Journal of Scientific & Engineering Research, Volume 5, Issue 2, February-2014 1
ISSN 2229-5518
Morphometric and Land use Analysis for Watershed
Prioritization in Gujarat State, India
Patel Ajay, Khalid Mahmood, Singh Vijay, Thakkar Paru P, Jose Joy, Patel Nayan and Kalubarme, M. H.* Bhaskaracharya Institute for Space Applications and Geo-informatics (BISAG) Department of Science & Technology, Government of Gujarat Gandhinagar 382 007 (email: info@bisag.gujarat.gov.in)
Abstract— In the present study, an attempt has been made to evaluate morphometric parameters derived from Indian Remote Sensing Satellite (IRS) Cartosat-1 DEM-10 m data and LISS-IV data covering Viswamitre watershed in Vadodara and Panchmahals districts in Gujarat State. The Morphometric parameters like stream length, bifurcation ratio, drainage density, stream frequency, texture ratio, form factor, circularity ratio and compactness coefficient and elongation ratio are considered for prioritization of all the mini-watersheds in the study area. The land-use map of the study area was generated using the IRS LISS-IV digital data and used as one of the input for prioritization of the mini-watersheds.
The mini-watersheds were prioritized based on the composite ranking of the parameters considered for morphometric analysis. The highest value of the linear parameter was ranked 1, the second highest value ranked 2, and so on. On the contrary, the shape parameters have converse relation with linear parameters, which means lower their value, more is the erodability. Thus the lowest value of the shape parameter was rated as rank 1 and the second lowest as rank 2, and so on. Compound factor was then computed by summing all the ranks of liner parameters as well as shape parameters and then dividing by number of parameters. From the group of these mini- watersheds, highest prioritized rank was assigned to the mini-watershed having the lowest compound factor and so on.
Viswamitre Watershed consists of 9 mini-watersheds out of which mini-watershed no.9, is conferred uppermost priority based on the compound factors computed based on various morphometric parameters. The results indicate that the analysis of various morphometric parameters derived from IRS LISS-IV and Cartosat-1 DEM 10 m digital data in GIS environment, can be effectively used for prioritization of watersheds, soil and water conservation and natural resources management at the watershed level.
Index Terms—Morphometric analysis, Indian Remote Sensing Satellite (IRS), Cartosat-1 DEM-10 m, Stream order, Drainage density, Land use classification, Watershed Prioritization,
—————————— ——————————
orphometry is the measurement and mathematical analysis of the configuration of the earth's surface, shape and dimension of its landforms (Agarwal, 1998;
Obi Reddy et al., 2002). Prioritization and management of any watershed depends upon its accurate delineation and plays an important role in the determination of stream flow. Water- shed, the drainage basin or catchment area of river, is geo- hydrological unit which drains runoff into small rivulets. Wa- tershed management is a significant constituent for sustaina- ble improvement of natural resources and is the process of formulation carrying out a course of action that involves mod- ification in the natural system of watershed to achieve speci- fied objectives (Johnson et al., 2002). It further implies appro- priate use of land and water resources of a watershed for op- timum production with minimum hazard to natural resources (Osborne and Wiley 1988; Kessler et al., 1992). For conserving soil and water, water harvesting structure is being an impera- tive component of watershed development.
Remote Sensing (RS) along with Geographical Information System (GIS) technologies have been successfully used to de- rive considerable accurate representation of various watershed delineation features (Ozdemir and Bird, 2009). GIS techniques characterized by very high accuracy of mapping and meas-
urement prove to be a competent tool in morphometric analy- sis. Drainage density and stream frequency are the most useful criterion for the morphometric classification of drainage basins which certainly control the runoff pattern, sediment yield and other hydrological parameters of the drainage basin.
In India drainage and morphometric characteristics of many river basins have been studied using conventional methods (Krishanmurthy et al., 1996). GIS helps to create database for the watershed which is very much useful for carrying out spa- tial analysis thereby helping the decision makers in framing appropriate measures for critically affected areas (Thakkar and Dhiman, 2007). It is an effective tool not only for collec- tion, storage, management and retrieval of a multitude of spa- tial and non-spatial data, but also for spatial analysis and inte- gration of these data to derive useful outputs and modelling (Gupta and Srivastava 2010; P. K. Srivastava et al. 2010; Mukherjee et al. 2009; P. Srivastava et al. 2011). Ahmed et al.,
2010, carried out the evaluation of morphometric parameters derived from ASTER and SRTM DEM for proper planning and management of Sub-watershed basin in Kranataka state. In present study, an attempt has been made to evaluate mor- phometric parameters derived from Indian Remote Sensing satellite Cartosat-2 DEM-10 m data covering Viswamitre mini-
IJSER © 2014 http://www.ijser.org
International Journal of Scientific & Engineering Research, Volume 5, Issue 2, February-2014 2
ISSN 2229-5518
watershed in Vadodara and Panchmahals districts in Gujarat
State.
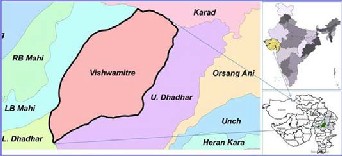
The study area comprises of Viswamitre watershed which falls under the Mahi river basin in Vadodara and Panchmahals districts of Gujarat State. This watershed comprises of 9-mini- watersheds which cover a total area of about 1185 km2. The location map of the study area is given in Figure-1. There are
9-mini-watersheds in the Viswamitre watershed. The Indian Remote Sensing Satellite (IRS) LISS-IV data along with mini- watershed boundary is shown in Figure-2.
The methodology flow chart of morphometric analysis is giv-
• Authors Ajay Patel, Khalid Mahmood, Vijay Singh, and Paru Thakkar are currently working as Project Managers and Jose Joy, Nayan Patel are working as Project Scientists in Bhaskaracharya Institute for Space Appli- cations and Geo-informatics (BISAG), Department of Science & Technolo- gy, Government of Gujarat.
• The corresponding author Manik H Kalubarme is a Former Scientist from Space Applications Centre (ISRO) and currently working as Project Direc- tor, BISAG.
en in Figure-3. The IRS LISS-IV digital data was analyzed us- ing the ground truth information and land use map of the
study area indicating cropped land, waste land, forest land etc. in the Viswamitre watershed was generated (Figure-4). Cartosat-1 stereo-data was used to generate 10 m spatial reso- lution Digital elevation Model (DEM) covering the study area, delineation of drainage, and watershed boundary. The Digital elevation Model (DEM) of the Viswamitre watershed is given in Figure-5.
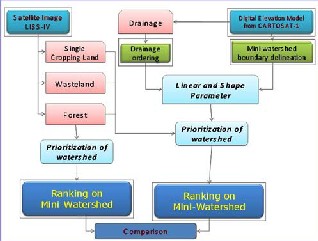
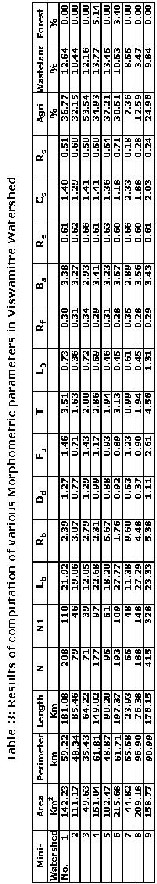
The morphometric parameters were categorized into three categories namely, basic parameters, derived parameters and shape parameters. The basic parameters include area, perime- ter, basin length, stream order, stream length, maximum and minimum heights and slope. The derived parameters are bi- furcation ratio, stream length ratio and drainage density. The shape parameters are elongation ratio, circulatory index and form factor (Ahmed et al., 2010). The drainage network of the watershed and stream ordering was analyzed as per Horton (1945), Strahler (1964), Schumn (1956), Nookartnam et al., (2005), Thakkar and Dhiman (2007) and Miller (1953). The de- tails of various formulae used in this study are given in Table-
1.
The morphometric analysis of Viswamitre watershed was car- ried out using the parameters given in Table-1. Basic parame- ters include watershed area, perimeter, stream length, stream order and basin length.
Mini-watershed delineated layer is used to obtain basic mor- phometric parameters such as area (A), perimeter (P), length (L), number of streams (N). Basin length (Lb) was calculated from stream length, while the bifurcation ratio (Rb) was calcu- lated from the number of streams. Other linear and shape morphometric parameters were calculated using the equations
IJSER © 2014 http://www.ijser.org
International Journal of Scientific & Engineering Research, Volume 5, Issue 2, February-2014 3
ISSN 2229-5518
as given in Table-1. Liner parameters have a direct relation- ship with erodability, higher the value more is the erodability (Nookaratnam et al., 2005). The perimeter (P) is the total length of the drainage basin boundary. The perimeter of the Vishwamitre watershed is 558.8 km. The basin perimeter (P) can be represented as length of the line that defines the surface divide of the basin. Perimeters of mini-watersheds are shown in Table-3. The result shows that mini-watershed number 6 covers the maximum area of 215.7 km2 while watershed num- ber 7 has minimum area of 44.8 km2.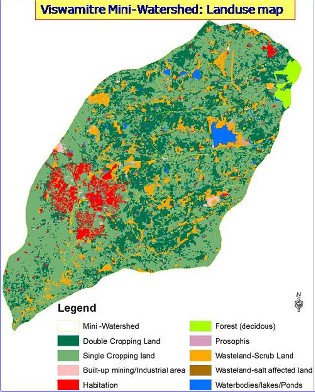
To describe the basins in quantitative terms, concept of stream order was introduced by Horton, (1945) and Strahler, (1964). This concept is applied with the linear dimension of the stream length. The first order stream has no tributary and its flow depends entirely on the surface overland flow to it. Likewise the second-order stream is formed by the junction of two first-order streams and as such has higher surface flow and the third-order stream receives flow from two second- order streams.
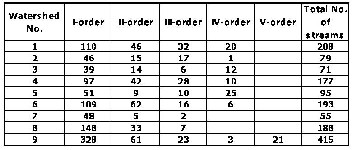
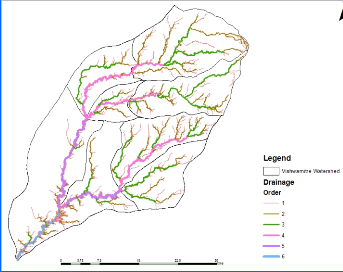
This supplemented the study of stream order of the water- shed. Among 9 watersheds, mini-watershed numbers 9, 1, 6, 8 and 4 are the watersheds having 415, 208, 193, 188 and 177 streams respectively as shown in Table-2. In watersheds no. 9 out of 415 streams, 328 have stream order I, whereas 21 have stream order V. The drainage order map of the Viswamitre
watershed is given in Figure-6.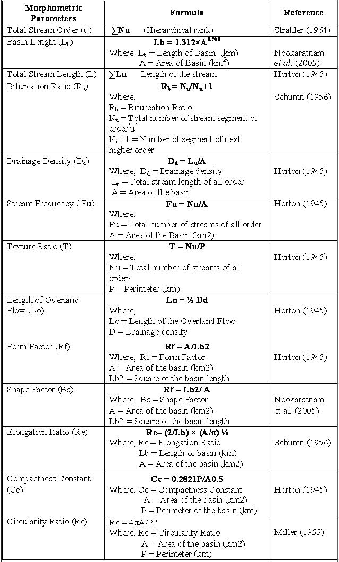
IJSER © 2014 http://www.ijser.org
International Journal of Scientific & Engineering Research, Volume 5, Issue 2, February-2014 4
ISSN 2229-5518
Stream length is the addition of all streams lengths in a partic- ular order. The numbers of streams of various orders in a mini-watershed were counted and their lengths measured, which help us to find the drainage density, the results are tab- ulated in Table 3.
The basin length (Lb ) is one of the watershed characteristics of interest and is important in hydrologic computations and in- creases as the drainages increases and vice versa. Basin length is usually defined as the distance measured along the main channel from the watershed outlet to the basin divide. Since the channel does not extend to the basin-divide, it is necessary to extend a line from the end of the channel to the basin-divide following a path where the greatest volume of water would
travel. Thus, the length is measured along the principal flow path. Basin length is the basic input parameter to count the major shape parameters. The results of basin length analysis show that it varies between 11.4 km (mini-watershed no. 7) and 27.3 km (mini-watershed no. 8) in the Viswamitre water- shed (Table 3).
Linear parameters include bifurcation ratio, drainage density, stream frequency, texture ratio and length of overland flow.
It is the ratio of the number of streams of a given order to the number of streams of the next higher order (Schumn, 1956). Lower Rb values are the characteristics of structurally less dis- turbed watersheds without any distortion in drainage pattern (Nag, 1998). Table 3 shows that in bifurcation ratios (Rb ) of Viswamitre watershed, watershed no. 6 has the least bifurca- tion ratio of 1.8 and no. 5 has maximum ratio of 5.7.
It is the ratio of the total length of streams within a watershed to the total area of the watershed; thus Dd has units of the re- ciprocal of length (1/L). A high value of the drainage density would indicate a relatively high density of streams and thus a rapid storm response, values of Dd are as shown in Table 3. Mini-watershed no. 9 has the highest drainage density where- as min-watershed no. 2 has the lowest drainage density in the Viswamitre watershed.
Stream frequency/channel frequency (Fu ) is the total number of stream segments of all order per unit area (Horton, 1932). Low value of stream frequency indicates low runoff value and increase in stream population with respect to drainage densi- ty. The value of stream frequency ranges from 0.71to 2.61, as shown in Table 3.
The texture ratio can be defined as the ratio of total number of streams of first order to the perimeter of the basin. The value of the texture ratio ranges from 1.0 to 4.6 as shown in Table 3.
It is the length of water over the ground before it gets concen- trated into definite stream channels and is equal to half of drainage density (Horton, 1945). Length of overland flow re- lates inversely to the average channel slope. Table-3 indicates the length of overland flow for various mini-watersheds in the Viswamitre watershed.
IJSER © 2014 http://www.ijser.org
International Journal of Scientific & Engineering Research, Volume 5, Issue 2, February-2014 5
ISSN 2229-5518
Shape parameters include form factor, shape factor, elongation
ratio, compactness ratio and circulatory ratio.
The form factor can be defined as the ratio of the area of the basin to square of the basin length (Horton, 1945). The value of the form factor would always be less then 0.7854 (for a perfect- ly circular basin) (Chopra et al., 2005). Smaller the value of form factor, the basin will be more elongated. The basin with high form factors have peak flow of shorter duration, whereas, elongated mini watershed with low form factors have lower peak flow with longer duration. In the Viswamitre watershed, value of form factor is 0.28 for watershed no.8 which is mini- mum and 0.35 for watershed no.7 which is the maximum as shown in Table-3. These values indicate the elongated shape of the basin and having flatter peak flow for longer duration, which helps to manage the flood easily than those of the circu- lar basin.
The shape factor can be defined as the ratio of the square of the basin length to area of the basin (Horton, 1945) and is in inverse proportion with form factor (Rf ). Shape factor lies be- tween 2.9 to 3.6 in the Viswamitre watershed, which indicates the elongated shapes of basin.
It is the ratio between the diameters of the circle of the same area as that of the drainage basin the maximum length of the basin. A circular basin is more efficient in runoff discharge than an elongated basin (Singh and Singh, 1997). The value of elongated ratio is varied between 0.6 and 1.0 are the typical regions of very low relief, whereas value ranged between 0.6 and 0.8 are associated with high relief and steep ground slope (Strahler, 1964). The lower value of the elongation ratio indi- cates that particular mini watershed is more elongate than others. The elongation value can be grouped into three catego- ries, namely circular basin (Re >0.9), Oval basin (Re : 0.9-0.8), Less elongated basin (Re <0.7). In the Viswamitre watershed (Table 3), these values are less than 0.7 and hence the mini- watersheds are elongated in shape.
It can be represented as basin perimeter divided by the cir- cumference of a circle to the same area of the basin and also known as the Gravelius Index (GI). This factor is indirectly related with the elongation of the basin area. Lower values of this parameter indicate more elongation of the basin and less erosion, while higher values indicate less elongation and high erosion. In the Viswamitre watershed, highest value is 2.3 while the lowest is 1.2 as shown in Table-3, which indicates that mini-watershed no. 7 is more elongated as compared to mini-watershed no. 6.
It is a ratio of basin area (A) to the area of circle having the same circumference as the perimeter as basin (Miller, 1953). It is affected by the length and frequency of the streams, geolog- ical structures, land use/ land cover, climate, relief and slope of the basin. If the circularity in the main basin is the mini- mum, it shows that the basin is less circular hence the dis- charge will be slow as compared to the others and so possibil- ity of erosion will be less. In the Viswamitre watershed, max- imum value of circularity ratio is for watershed no. 6, which is
0.7 and minimum value is for watershed no. 7, which is 0.2.
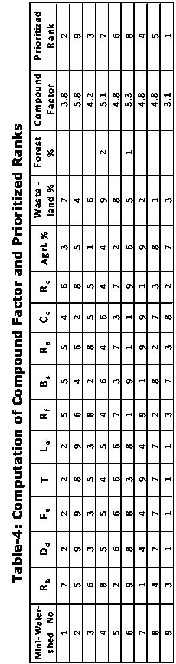
The highest value of the linear parameter was ranked 1, the second highest value ranked 2, and so on. On the contrary, the shape parameters have converse relation with linear parame- ters, which means lower their value, more is the erodability. Thus the lowest value of the shape parameter was rated as rank 1 and the second lowest as rank 2, and so on. Compound factor was then computed by summing all the ranks of liner parameters as well as shape parameters and then dividing by number of parameters as shown in Table 4. From the group of these mini-watersheds, highest prioritized rank was assigned to the mini-watershed having the lowest compound factor and so on.
Compound factor is computed by summing all the ranks of liner parameters as well as shape parameters and then divid- ing by number of parameters. From the group of these mini- watersheds, highest rank was assigned to the mini watershed having the lowest compound factor and so on. Depending upon the value of compound factor, ranking to each mini wa- tershed is assigned. In the Viswamitre watershed, mini- watersheds no. 9 is given rank 1 with least compound factor value of 3.1 and it is followed by watersheds no. 1 and 3, as second and third. The values of compound factor and respec- tive rank of all mini-watersheds are shown in Table-4. The ranking of the mini-watersheds using the compound factors computed using land-use alone and ranking by land-use and morphometric analysis is given in Figure-7.
Systematic analysis of morphometric parameters within the watershed using Remote Sensing and GIS can provide signifi- cant information for understanding basin characteristics as well prioritization of mini-watersheds. This helps for sustain- able development of watershed, based on suitable soil and water conservation measures. In this study watershed prioriti- zation based on analysis of morphometric parameters derived from Indian Remote Sensing Satellite (IRS) CARTOSAT-1
DEM-10 m data and LISS-IV data was carried out in the Viswamitre watershed in Vadodara and Panchmahals districts of Gujarat State. The GIS based approach facilitates analysis of different morphometric parameters and to explore the rela- tionship between drainage morphometry and properties of
IJSER © 2014 http://www.ijser.org
International Journal of Scientific & Engineering Research, Volume 5, Issue 2, February-2014 6
ISSN 2229-5518
land forms, soil and eroded lands. The results indicate that the
analysis of various morphometric parameters in GIS environ- ment can be effectively used for prioritization of watersheds, soil and water conservation and natural resources manage- ment at the watershed level.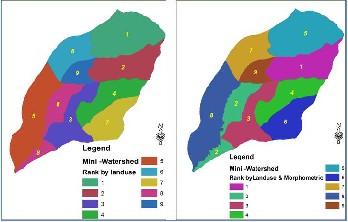
The authors like to express their sincere thanks to Shri T. P. Singh, Director, Bhaskarcharya Institute for Space Applica- tions and Geo-informatics (BISAG), and Team Members of BISAG, Department of Science & Technology, Government of Gujarat, Gandhinagar 382007, for fruitful discussions, sugges- tions and continuous cooperation in carrying out this work.
Agarwal, C. S., 1998. Study of drainage pattern through aerial data in Naugarh area of Varanasi district, U.P. Jour. Indian Soc. Remote Sensing.26: 169-175.
Ahmed, S.A., Chnadrashekarappa, Raj, S.K., Nischitha, V. and Kavitha, G, 2010. Evaluation of morphometric parametrs de- rived from ASTER and SRTM DEM – A study on Bandihole Sub-wtershed Basin in Karnataka. Journal of the Indian Socie- ty of Remote Sensing, 38, 227-238.
Chopra, R., R.D. Dhiman and P. Sharma, 2005. Morphometric analysis of sub-watersheds in Gurdaspur district, Punjab us- ing remote sensing and GIS techniques. Journal of the Indian Society of Remote Sensing, 33(4), 531-539.
Gupta, M. and P. K. Srivastava, 2010. Integrating GIS and re- mote sensing for identification of groundwater potential zones in the hilly terrain of Pavagarh, Gujarat, India. Water Interna- tional, 35(2), 233-245.
Horton, R.E., 1945. Erosional development of streams and their drainage basins; hydrophysical approach to quantitative morphology. Geological Society of America Bulletin, 56(3),
275.
Horton, R.E., 1932. Drainage basin characteristics. Trans. Am. Geophys. Union, 13, 350-361.
Johnson, N., H.M. Ravnborg, O. Westermann and K. Probst,
2002. User participation in watershed management and re- search. Water Policy, 3(6), 507-520.
Kessler, W. B., H. Salwasser, C.W. Cartwright Jr and J. A. Caplan, 1992. New perspectives for sustainable natural re- sources management. Ecological Applications, 221-225.
Krishnamurthy, J., Srinivas, G., Jayaram, V. and Chandrasek- har, M. G. (1996) “Influence of rock type and structure in the development of drainage networks in typical hard rock ter- rain”. ITC J. (3), 4: 252-259.
Miller, V.C., 1953. A quantitative geomorphic study of drain- age basin characteristics in the Clinch Mountain area, Virginia and Tennessee, Proj. NR, Tech. Rep. 3, Columbia University, Department of Geology, ONR, New York: pp. 389-402.
Mukherjee, S., S. Shashtri, C. Singh, P. Srivastava and M. Gup- ta, 2009. Effect of canal on land use/land cover using remote sensing and GIS. Journal of the Indian Society of Remote Sens- ing, 37(3), 527-537.
Nookaratnam, K., Y.K. Srivastava, V. Venkateswarao, E. Am- minedu and K.S.R Murthy, 2005. Check dam positioning by prioritization of micro-watersheds using SYI model and Mor- phometric analysis – Remote sensing and GIS perspective. J. Indian Soc. of Remote Sensing, 33(1), 25-38.
Obi Reddy, G. E., Maji, A. K. and Gajbhiye, K. S., 2002. GIS for morphometric analysis of drainage basins. GIS lndia (11), 4: 9-
14.
Osborne, L.L. and M.J. Wiley , 1988. Empirical relationships between land use/cover and stream water quality in an agri- cultural watershed. Journal of Environmental Management,
26(1), 9-27.
Ozdemir, H. and Bird, D. (2009) “Evaluation of morphometric parameters of drainage networks derived from topographic maps and DEM in point of floods” Environ Geol 56:1405–1415.
IJSER © 2014 http://www.ijser.org
International Journal of Scientific & Engineering Research, Volume 5, Issue 2, February-2014 7
ISSN 2229-5518
IJSER © 2014 http://www.ijser.org