International Journal of Scientific & Engineering Research, Volume 4, Issue 1, January-2013
ISSN 2229-5518
Hangnilo Robert
Abstract
The catchment area of the dam on Mono River in Nagbeto measures about 180 km2 and counts among the small watersheds in the world. Forecasting in small watersheds (some hundreds of km2) takes generally into account rainfall. That’s why a rainfall- runoff concept is adopted for the study. According to our observations, the feeling process in the basin of the dam on a river follows the same law as the recharging procedure of a capacitor fed by a direct input voltage. Hence, we look for a synoptic model where the hydraulic parameters of the pond slope of a river were translated into electric terms and the main laws in
Electrotechnics as Ohm and Kirsshoff ones were verified. So, the runoff is similar to a current and the height to a voltage, etc. An equivalent electric scheme of the pond slope of a river was designed and the equation which governs the water flood is set up and solved. The simulation in Matlab of the solution to that equation which describes the behavior of the water flood in the pond slope gives a result which is satisfactory. The time constant τ of the RC equivalent electric scheme of the catchment are a allows a flood forecasting with acceptable precision. The major difficulty of that mathematical rainfall-runoff modeling lies in determination of the hydraulic resistance of the catchment area. In the model the input is the maximal height of the water in the basin and the output is the time the water takes to reach that maximal height.
Keywords – Equivalent electric scheme, flood forecasting, pond slope of a river, rainfall-runoff model
The modeling of the pond slope of a river is set up to prevent from the damages of floods. Water rising constitutes always a disaster for bridges, hydroelectric factories, and for people living nearby a river: their life, habitat, plantations and cattle are often destroyed by the floods. For a hydroelectric power plant the flood water is to be thrown away. Thus during every strong water rising in Nagbeto hydroelectric power plant, an important quantity of water is simply and expressly thrown away to secure the dam. The risk of water rising as well as the efficacy of a hydroelectric power plant is rainfall dependent, [1,
2]. Bridge and dam setting up on a river or water management for irrigation require a mastering of the flood regime of the given river, [3]. The physical characteristic of the pond slope of a river influences the model very much, [4]. Our study concerns the hydroelectric power plant resulting from the dam set up on Mono River in Nagbeto. The upstream catchment area of Mono River which is running from its source in Alejo down to Nagbeto, both Togo Republic areas, measures approximately 335 km. The travel time of water from Alejo to the water reserve in Nagbeto hardly exceeds forty eight hours of time. That fact
explains the spontaneous character of water rising in Nagbeto. Compared to the Amazonian catchment area of 4.3 million km2, Nagbeto basin with its 180 km2 appears as a mouse beside an elephant. Nagbeto watershed counts among the small ones in the world. It means that Benin and Togo Republics are poor together in hydrological resources and the few available amount of water is to be managed with care, [1, 5], fig. 1-a and b. Flood forecasting in small watersheds (some hundreds of km2) must take into account rainfall. Computer science development with the capability in studying complicated natural systems as the pond slope of a river has induced so many numerical models which exportability is uncertain, [3]. Hence, water discharging in Nagbeto hydroelectric power station during a swelling requests a study for optimization of the process of water pouring in Nagbeto.
Since the startup of the Plant in September 1987 up to September 19th 2009, there were twenty water discharge corresponding to twenty strong water rising of which the longest occurred in 1995 while the shortest in 2002. Water discharge in 1995 lasted from August the 18th to October the 17th of the same year, that is to say sixty-one days. That of
2002 lasted only sixteen hours (September the 8th
10 hours and September the 9th, 06 hours). From
IJSER © 2013 http://www.ijser.org
International Journal of Scientific & Engineering Research, Volume 4, Issue 1, January-2013
ISSN 2229-5518
1987 up to 2009, seven years only did not know
water discharge out of twenty two years. Yoto area in Togo Republic and Athieme land in Benin Republic are periodically suffering from the Mono River floods. For that study to be, we have to consider thoroughly the hydro meteorological parameters, the rainfall and the flows of the main affluent of the Mono River. Water charging in the reserve of a dam reveals a capacitive behavior as it is the case in electrotechnics, fig. 2-a and b. That fact suggests an equivalent electric RC-circuit of the catchment area in Nagbeto based on rainfall- runoff model in fig. 3. Forecasting water rising in Nagbeto with the given model is satisfactory. It is well known that the relevance of that forecasting is strongly depending on the knowledge of real rainfall in the given catchment area and this
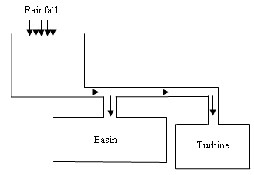
Fig. 3: a- Rainfall-runoff model of a catchment, b- equivalent electric of the rainfall-runoff model
Evaporation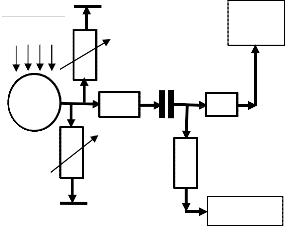
Water
The
Turbine
information which is estimated by rain gauge measurements contains sometimes several uncertainties, [6]. One of the major difficulties of the rainfall-runoff mathematical modeling lies in estimating the hydraulic resistance, [4]. Hence, for that forecasting to be true it is necessary to determine the equivalent electric resistance R of
Rainfall
The basin
Runoff water
Water- energy
the catchment area with accuracy.
Percolated
Water
Flood water
The flood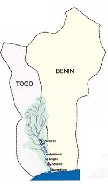
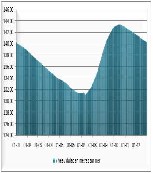
Fig. 4: Synoptic of the electric model of a river’s
pond slope
a b
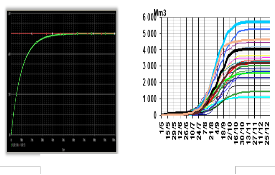
Fig. 1: a- Pond slope of Mono River, b- Water resources in the catchment area of the River
a b
Fig. 2: a-pattern of a capacitor recharging process, b- n- patterns of water charging of the basin in Nangbeto
The equivalent electric parameters corresponding to each hydraulic characteristic are as follow:
The hydraulic potential H, m. The hydraulic
potential difference h = H1- H2, is of course in meter. The water charge is Q, m3. The runoff d can be assimilated to a currant and the relation d =
dQ/dt is justified by its unity in meter cube per second, m3/s. We know that in Electrostatics Q = CV; The capacitance unity for a hydrological basin can be written as follows: C = Q/h, m2 is justified. The Ohm’s law, U = R.I is equivalent to: h = R.d for the catchment area of a river. The resistance transforms the rainfall into runoff; its dimension is given by the relation: R =h/d and its unity is a second per meter square, s/m2. The. These relations verify well one by one every formula in Electrotechnics. We found that RC = h.Q/d.h = Q/d
IJSER © 2013 http://www.ijser.org
International Journal of Scientific & Engineering Research, Volume 4, Issue 1, January-2013
ISSN 2229-5518
is in second, and that is fully logical as the quantity
RC is the time constant of a RC electric circuit.
K1 R1
![]()
And the turbine equivalent current is:
(2)
(3)
![]()

ί B A
ίc
R2
V
vC C
The input voltage in fig. 5 is:
ίT
![]()
![]()
![]()
![]()
R3
(4) (5)
D The relations n°1, 2, 3, 4 and 5 can give eq. 6:
O
Fig. 5: Equivalent electric scheme of the catchment area of a river.
In fig. 5, R3 is the equivalent resistance of BR3O branch of the circuit, R2 the equivalent resistance of BR3O branch and R1, stands for the equivalent input resistance for the branch AR1B. Each branch is a part of the watershed of the river. The point A is to be chosen in the catchment area where the![]()
We assume that:![]()
(6)
![]()
![]()
, , and
(7)
altitude and the flow of the river can be measured.
Using relations 6 and 7, we can get the flood
function of a basin as follow:
Lemma: During the floods time, (from June to
September, fig. 6) the sky is cloudy, the sunshine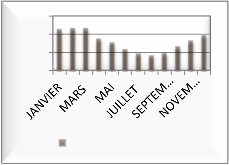
is very poor and the evaporated water is negligible; the rainfall is lasting so many days ago and the ground is wheat enough so that the infiltrated part of water is negligible too. Those considerations allow introducing a lemma as: During the floods time, rainfall-runoff process is conservative flux.
300.0
200.0
100.0
0.0
(8)
3.2 Solving the charging process equation of the basin of dam on a river
Let us reduce eq. 8 into eq. 9 and consider eq. 10:
(9)
![]()
Where: and (10)
The solution to eq. 8 is as follows:
Evaporation en mm
Fig. 6: Average of evaporation in Sokode from 1987 to 2008
For the equivalent electric scheme fig. 5, K1 is down. According to the lemma above, (1), the first equation of Kirsshoff is verified and we can get:
(1)
The current across the capacitor is given by:![]()
![]()
(11)
For the given application, y (t) stands for the water height in the basin and y0 that height just a while before the rainfall. When the condition y (t) ≥ y0 is satisfied, the flood starts suddenly. The height of water in the basin is depending on the time and obeys to the law in eq. 12:![]()
(12)
Indeed the input direct voltage V is equivalent to the maximal height hmax of the water in the basin.
IJSER © 2013 http://www.ijser.org
International Journal of Scientific & Engineering Research, Volume 4, Issue 1, January-2013
ISSN 2229-5518
When the water overcomes that hmax, the floods start.
145
144
144. 00 m . s . m
143
142
143. 50 m . s . m
142. 00 m . s . m
141
140
139
Variation réelle
Fonction crue
0 10 20 30 40 50 60 70

142
140
138

0.35
0.3
0.25
0.2
0.15
Valeur moyenne de la pente sur 3 jours
Variation de la pente
0.15 m/j
b
136
134
132
0.1
0.05
0
-0.05
0 10 20 30 40 50 60 70 rang du jour [t0 étant l instant initial]
130
0 10 20 30 40 50 60 70 80 90 100
Temps en jours
a b
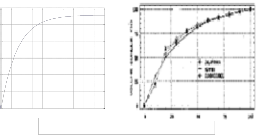
Fig. 7: a - Flood function simulation in Nangbéto, b - and in
Saharan areas
The curve in fig; 7-a results from the simulation of
(12) and it simulates very well the filling process of
Fig. 8: a- the pattern of flood forecasting in Nagbeto, b- The speed of water height variation in the basin in Nagbeto
The flood function is initialized at the 20th of August 1993 and the initial height, h0 = 138.85 m.o.s. The average of the equivalent resistance is
2
a watershed of a river as we can see in fig. 7-b and
R = 0.004 s/m
and the time constant τ = 720000
on fig. 2-b. The rainfall-runoff model of a pond slope based on an equivalent electric scheme seems like a good skill which can allow a good forecasting of floods.
4.1 Characteristics of Mono river catchment area
Mono River receives water from 7 other rivers as: Ogou, 210 km, Anié, 160 km., Amou, 114 km, Kra,
69 km, Asrama, 34 km, Klikon, 41 km and
Lahiougan, 25 km.
The pond slope of Mono river covers 15, 680 km²
and the average of the annual rainfall is about
1340 mm with a maximum of 1700 mm in mountains. The coverage area of the basin in Nagbeto is 180 km² and the volume of water at 144 m.o.s, (meter over sea) is 1715 Mm3. The minimum exploiting height of water in the basin is
130, 00 m.o.s for a water volume of 250 Mm3. The
annual flow average is about 88.5 m3/s corresponding to 2, 800 Mm3 per year
seconds which is equal to 8 days 8 hours 0
minutes 0 seconds, fig. 8-a and b.
4.2 Forecasting the filling duration of the basin at height 142 m.o.s
In this case, the water height in the basin has reached 142 m.o.s within 7 days 21 hours corresponding to 27th August 1993. The water in the basin reaches 142 m.o.s really the 29th August
1993. There is a 2 day early distortion for the
forecasting at height 142 m.o.s.
4.3 Forecasting the filling duration of the basin at height 143.5 m.o.s
According to the model water raises up to143.5 m.o.s within 19 days 10 hours corresponding to
11th September 1993. The water really reached
143.5 m.o.s within 16 days corresponding to the
8th of September 1993. Here, a 3 day late distortion for the forecasting can be observed.
Flood forecasting in small watersheds is not an easy task. It must take into account rainfall. The relevance for forecasting is depending on the knowledge of real rainfall on drainage basin of the given river. This information, estimated by rain gauge measurements generally contains many quantitative uncertainties. Even though R1, R2 and R3 are known approximately, the forecasting is good enough especially in the case of height 142 m.o.s, when the warning occurred two days before the flood. To perform flood forecasting based on the equivalent electric scheme, it is necessary to
know resistances R1, R2 and R3 with a good
IJSER © 2013 http://www.ijser.org
International Journal of Scientific & Engineering Research, Volume 4, Issue 1, January-2013
ISSN 2229-5518
precision as the time constant τ is depending on R1 and R2 and the ratio β on R1 and R3. When a flood is imminent the dam operators do not wait for the water to rise up to hmax before they open the sluice gates. But with the knowledge of the height of that operation and a good value of the time constant τ, it is quite possible to forecast a flood using the equivalent electric scheme of the pond slope of a river.
[1] B. CAPPELAERE, H. LUBES NBEL, C. BERKHOFF, H. Thepaut, J.-L. Guyot, M. Molmier, E. DE Oliveira and M. Rodrigues, Prévision des crues de l'Amazone, , L'hydrologie tropicale: géoscience et outil pour le développement, Actes de la conférence de Paris, mai 1995), IAHS Publ. no. 238, 1996.
[2] Labbas Mériem, Modélisation hydrologique d’un bassin versant de haute altitude (Bolivie) - Application à des scenarios de changement climatique avec retrait glaciaire, Rapport de stage de Master 2, Laboratoire Sisyphe, UPMC - Paris 6, 2009.
[3] Tarik Benkaci Ali1 and Noureddine Dechemi, Modélisation pluie–débit journalière par desmodèles conceptuels et “boîte noire”; test d’un modèle neuroflou, journal des sciences Hydrologiques, 49(5) Octobre 2004
[4] Abel A. Afouda, Modélisation de la résistance hydraulique à la surface d’un bassin fluvial, Cah.. ORSTOM, sér. Hydrol. vol. XIX, no 1, 1982, 3 -13.
[5] Rapport CEB, 2OO4
[6] P.Fourmigué, J. Lavabre, Flood forecasting with the GR3H rainfall-runoff model. Adaptability to rainfall uncertainties, Rev. Sci. Eau 18/1, 2005, 87-102.
Hangnilo Robert received the M.Sc. degree in Energy Power
& Motion Control in Energy Institut of Moscow and the
Ph.D. degree in the University of Havre in France.
He is currently Assistant Professor of Electromagnetism and Energy Systems Implementations at the “Ecole Polytechnique d’Abomey-Calavi” - University of Abomey- Calavi in Benin Republic.
His principal research interests are Modeling of Energy systems and vector Control in Malaria.
e-mail : hangnilo555@yahoo.fr
IJSER © 2013 http://www.ijser.org