International Journal of Scientific & Engineering Research, Volume 4, Issue Ş, 2013
ISSN 2229-5518
Measurement of atmospheric Carbon Dioxide using multi sensor approach
Akshay Anant Bhide, S.L. Nalbalwar
230
—————————— ——————————
as concentration measurements have gained more and more attention in the field of industrial process control
and environmental pollution monitoring, etc., amongst the many gases causing the pollution, Carbon dioxide is im- portant [1]. Also, carbon monoxide indirectly affects the amount of ozone in the atmosphere, a key player in global warming. The amount of ozone in the atmosphere is directly dependent on the amount of NOx. Consequentially, carbon monoxide affects the levels of NOx found in the atmosphere. Global levels of carbon monoxide have shown an upward trend until the 1980’s when they took a downward turn, main- ly due to automobile and industrial improvements, and de- creased biomass burning. Levels of carbon monoxide are not constant around the globe. In addition, the northern hemi- sphere hosts a significantly larger portion of CO. This is due to a greater amount of incomplete combustion in the winter months in the industrial nations of the world [2].
Many methods for gas detection have been developed. But the precise measurement of the carbon dioxide over a targeted geographic area is tough. Correlation spectroscopy is a partic- ularly simple and powerful technique for fast and selective measurements yielding moderate sensitivity. Correlation spec- troscopy is immune to fluctuations of the light source and the disturbance of other gases. Two typical correlation spectros- copy methods, namely, gas filter correlation (GFC) and inter- ferometric correlation (INC), have been proposed earlier. Both methods used differential measurements to reject various kinds of interference [1].
The method proposed here implies the measurement of the carbon dioxide based on the Gas Filter Correlation method and also correlation of the results with the existing industrial sensors is done for precise measurements. Also the measure- ments are done over a wide geographical area and plotted on a graph so that the varying concentration of the carbon diox- ide over the targeted area can be monitored.
Gas Filter Correlation method is basically a remote sens- ing technique used to measure the amount of gas of interest in the section of an atmosphere located within the field of view of an instrument that employs this technique. It has been used since the 1960’s in airborne and space devices; most notably for the MOPITT instrument on-board NASA’s Terra Polar or- biting satellite.
As the name suggests, a sample of target gas is filled in a container (reference cell), located within the path of the infra- red radiation and acts as a spectral filter. The radiation inci- dent upon is chosen in such a way that it contains the absorp- tion lines of the gas, which is reason why filtering takes place. Gas Filter Correlation method is basically a remote sensing technique used to measure the amount of gas of interest in the section of an atmosphere located within the field of view of an instrument that employs this technique. It has been used since the 1960’s in airborne and space devices; most notably for the MOPITT instrument on-board NASA’s Terra Polar orbiting satellite.
As the name suggests, a sample of target gas is filled in a container (reference cell), located within the path of the infra- red radiation and acts as a spectral filter. The radiation inci- dent upon is chosen in such a way that it contains the absorp- tion lines of the gas, which is reason why filtering takes place. Absorption line is a particular case of the spectral line. It is a very narrow range in infrared spectrum, where light wave- lengths are absorbed and re-emitted by the gas. The emission takes place in different directions not related to the incident one [3].
IJSER © 2013
International Journal of Scientific & Engineering Research Volume 4, ȱŞǰȱ ȱŘŖŗř
ISSN 2229-5518
231
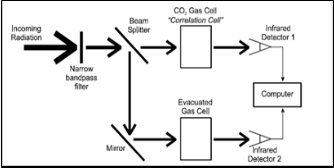
Fig.1. Gas Filter Correlation Methodology [4].
The two chambers are constructed based on the require- ment of the Gas filter Correlation method. Both the chambers are 20 centimetres long. They are made up from PVC pipes and used as sample cell and reference cell. In the sample cell the atmospheric gas at the desired geographical is filled and on the other hand, in the reference cell carbon dioxide gas with the atmospheric pressure is filled. At one end there is provision for the optical infrared radiation source and on the other end there is a provision for photoconductor for reception of radiation.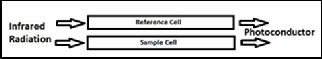
Fig. 2. Reference & Sample Gas Cells.
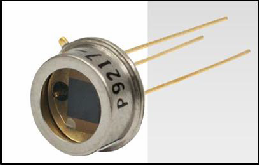
The Thorlabs FDPS3X3 photoconductor is a Lead Sulphide Detector (PbS), which is ideal for measuring both pulse and chopped infrared light sources. The photoconductor is housed conveniently in a TO-5 package which offers easy integration into existing setup and/or systems. The Lead Sulphide detec- tor is modelled as a resistor: as the detector area is illuminated with IR radiation the effective resistance of the photoconduc- tor is reduced.
Lead Sulphide (PbS) and Lead Selenide (PbSe) photocon-
ductive detectors are widely used in detection of infrared ra-
diation from 1000 to 4800 nm. Unlike standard photodiodes,
which produce a current when exposed to light, the electrical
resistance of the photoconductive material is reduced when
illuminated with light. PbS and PbSe detectors can be used at room temperature.
Fig.3. Thorlabs FDPS3X3 Lead Sulphide Photoconductor
exposed to light, the electrical resistance of the photoconduc- tive material is reduced when illuminated with light. PbS and PbSe detectors can be used at room temperature.
Incident light causes the number of charge carriers in the active area to increase, thus decreasing the resistance of the detector. This change in resistance leads to a change in meas- ured voltage, and so photosensitivity is expressed in V/W. An example operating circuit is shown to the right. Please note that circuit depicted below is not recommended for practical purposes since low frequency noise will be present. The detec- tion mechanism is based upon the conductivity of the thin film of the active area. [Ref. to the Datasheet of Thorlabs FDPS
3X3].
The consideration of carbon dioxide gas is done for the sensor network development. For the detection of the carbon dioxide, various sensors are available but the electromechani- cal sensor MG811 is chosen. Sensor adopt solid electrolyte cell
Principle,It is composed by the following solid cells:
Air,Au |NASICON || carbonate |Au, air,CO2
When the sensor exposed to CO2,the following electrodes
reaction occurs:
Catholic reaction:
2Li + + CO2 + 1/2O2 + 2e - = Li2CO3
Anodic reaction:2Na+ + 1/2O2 + 2e- = Na2O
Overall chemical reaction:
Li2CO3 + 2Na + = Na2O + 2Li + + CO2
The Electromotive force(EMF) result from the above elec-
trode reaction, accord with according to Nernst’s equation:
EMF = Ec - (R x T) / (2F) ln (P(CO2)) P(CO2)—CO2--- partial Pressure Ec—Constant Volume
R—Gas Constant volume
T— Absolute Temperature (K)
F—Faraday constant
Sensor heating voltage supplied from other circuit, when its surface temperature is high enough, the sensor equals to a cell, its two sides would output voltage signal, and its result accord with Nernst’s equation. In sensor testing, the
IJSER © 2013
International Journal of Scientific & Engineering Research Volume 4, ȱŞǰȱ ȱŘŖŗř
ISSN 2229-5518
232
impedance of amplifier should be within 100—1000 GΩ,Its
testing Hanwei electronics co., ltd MG-811 http: //www.
hwsensor.com, current should be control below 1pA.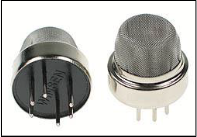
Fig.4. MG811 Carbon dioxide sensor
The acquired data from the MQ811 sensor is provided to the signal analysis unit which is also the part of the equipment which will be mounted to the targeted areas. This analysis unit processes the data and makes the data available over the net- work. The data is made compatible so that it can be transmit- ted over the network to the central server. The fig [2] shows the remote analysis and transmission of the carbon dioxide values remotely.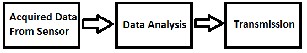
Fig.5.Remote Analysis and Transmission.
The data once converted to the compatible format for transmission over a network is then transmitted to the central server via cabled module if the geographical are covered is large and can be transmitted via wireless radio frequency if the geographical area covered is small. The fig [3] shows the network management when the data is transmitted over the network wirelessly or via wired or both.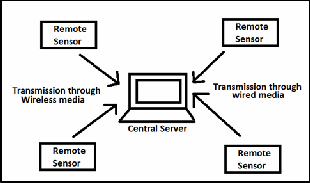
Fig.6. Network management for data transmission.
The initial stage of the data acquisition system is the data, acquired by the Carbon dioxide sensor MG811. This sensor provides us with the values which are proportional to the ac- tual values of the carbon dioxide gas present at the targeted geographical area. These proportional values are then cali- brated considering the standard value of carbon dioxide at a place, in such a way that the small variation in the actual amount of the carbon dioxide can be detected with the use of these proportional values. These proportional values are then used by the controller for further processing so that the accu- rate value of the carbon dioxide can be displayed on LCD and also will be sent for the network for the further analysis.
At the receiver end, the data from the individual sensor
in the network is acquired and further processed for the accu-
rate value mapping of the targeted geographical area.
Finally the process of carbon dioxide detection takes
place as detection of the carbon dioxide which takes place via
electromechanical sensor MG811 carbon dioxide sensor which provides us with the values 30 to 50 mV which corresponds to
the 350 to 10000ppm of carbon dioxide in the atmosphere. The sensor is calibrated in such a way that the standard reading of the carbon dioxide value at the place where the sensor is being calibrated is fixed first. Then according to the value fixed, the variation in the carbon dioxide values at different places is observed and then checked for the errors in the calibration. When the calibration is done then the value is provided to the LCD for the display and also provided to the central server for the further analysis.
At the central server the mapping of the values takes
place such that the value at particular place is stored in the map according to the latitude and longitude values. Finally the geographical values can be seen on a map according to the
targeted latitude and longitude values.
It is very important to monitor the varying amounts of the carbon dioxide over a large geographical area as well as over a wide time span. For the same purpose, the data acquired by the data acquisition system is provided to the personal com- puter, which is interfaced with the data acquisition system. The personal computer is also network interfaced so that the data obtained by it gets updated over the central server after very short spans of time. Similar to the one user, multiple us- ers are provided with the same equipment here and the values are also updated by the multiple users at same time frames but at different geographical areas.
IJSER © 2013
International Journal of Scientific & Engineering Research Volume 4, ȱŞǰȱ ȱŘŖŗř
ISSN 2229-5518
233
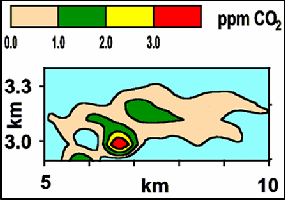
Fig.7.Geographical mapping of carbon dioxide.
Now at the central server, the data obtained from various geographical areas is plotted on a map so that the varying lev- els of the carbon dioxide can be monitored easily over a large area and a wide span of time.
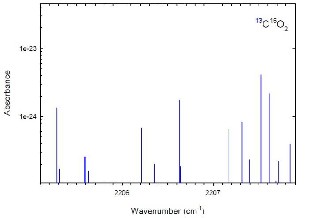
The carbon dioxide absorption spectrum [Fig. 6&7] is ini- tially observed on the optical spectrum analyser in the lab ex- periments which showed that the carbon dioxide has peak absorption spectrum near 4.7 micrometre. But on the other hand the carbon dioxide also absorbs the infrared radiation with wavelengths from 1.8, 2.7 micrometres. Thus the wide range of the infrared radiation is selected from 1 to 5 microme- tre.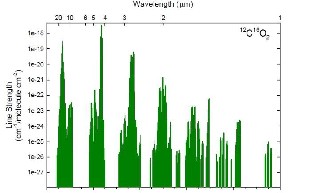
Fig.8.Carbon dioxide absorption spectrum [14]
Also the carbon dioxide absorption peak values are found out using the absorption spectrum of the carbon dioxide.
Fig.9.Carbon dioxide absorption peaks [14]
Then after obtaining the data related to absorption peaks of the carbon dioxide gas, the infrared optical device is tuned to the wavelength of 1 to 5 micrometer. The infrared radiation is made allowed to incident simultaneously on the gas chambers of interest. The alignment is done in such a way that the photoconductor is able to detect the filtered incident radiation by both sample cell and reference cell simultaneous- ly. Finally the output at the end of photoconductor is obtained. The output is recorded in the form of voltage and is then am- plified and then provided to the data acquisition system.
The industrial gas sensor MH-Z14 is also calibrated and the output of which is also amplified and provided to the data acquisition system for the precise value.
The system is calibrated in such a way that it provides with the direct ppm value of the carbon dioxide gas present at the area of interest. Also this value gets updated over the cen- tral server for the further geographical mapping of the carbon dioxide purpose.
The conclusions made from the experiments per-
formed in the lab areas; the additional use of the industrial
sensor provides us the capability of correction if there is error
in the calculation of the value of carbon dioxide using the gas
filter correlation method. Also we can calibrate the instrument
used for gas filter correlation method for more precise values.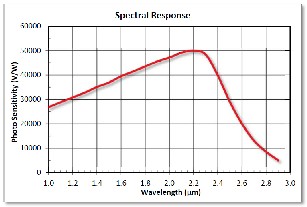
Fig.8.Spectral Response curve of a Photoconductor
[Ref. to Datasheet FDPS 3X3]
IJSER © 2013
International Journal of Scientific & Engineering Research Volume 4, ȱŞǰȱ ȱŘŖŗř
ISSN 2229-5518
234
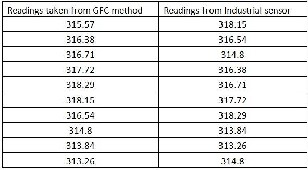
Fig.9.Variance in the values based on lab experiments. [Readings are in ppm (parts per million) unit]
The carbon absorption spectrum is first studied based on which the low cost and handy equipment is developed which can be used for the detection of the carbon dioxide in the at- mosphere in various areas as well as at various time spans. Series of readings were taken and then normalized for the values. The values obtained are compared with the www.Co2now.org [15] website values for the accuracy and found to be close to the readings. There are still some devel- opments needed for stabilizing the optical light source for the particular range, also the use of sensors that can provide us with the spectrum details of the received radiation. Also the work is still going on the network interface to be more dynam- ic.
We would like to thank the Department of Electronics & Telecommunication Engineering, Dr. Babasaheb Ambedkar Technological University, for providing the Lab facilities.
[1] B. Wang, G. Somesfalean, L. Mei, H. Zhou, C. Yan and S. He, “Detec- tion Of Gas Concentration By Correlation Spectroscopy Using A Multi- Wavelength Fiber Laser”, Progress In Electromagnetics Research, Vol. 114,
469{479, 2011}
[2] Jenna Bourne*, Megan Clark, Stefanie Bourne, Christopher Wells, and Nathan Fierro, “Infrared imaging and measurement of tropospheric car- bon monoxide using Gas Filter Correlation Radiometry”
[3] www.syndon.com/technology/gas-filter-correlation-radiometry/
[4] Boyd T. Tolton, and Dmitri Yashcov, “A Concept for a Gas-Filter Cor- relation Radiometer to Remotely Sense the Atmospheric Carbon Dioxide Column from Space,” Department of Physics, University of Toronto, 60
St. George Street, Toronto Ontario, Canada, M5S 1A7
[5] A:G.Kislyakov,”COSMIC AND ATMOSPHERIC RADIO SPECTROS- COPY: NEW APPROACH AND RESULTS,” Nizhny Novgorod State University, Russia.
[6] Brian A. Rosen, Amin Salehi-Khojin, Richard I. Masel, “A Microfabri- cated Carbon Dioxide Sensor for Portable Applications,” Department of Chemical Engineering University of Illinois at Urbana-Champaign Urba- na, USA
[7] S. Fanget, H Grange, F. Palancade, G. Ganuchaud, M Matheron, S. Charlot, T Bordy, T Hoang, P. Rey, D. Mercier, P. Brunet-Manquat and P. Robert, “CO2 MEASUREMENT USING AN ALN/SI SAW SENSOR,” CEA-Leti, MINATEC Campus, 17 Rue des Martyrs - 38054 GRENOBLE Cedex 9, FRANCE
[8] Paul Chambers, “A Study of a Correlation Spectroscopy Gas Detection Method,” Faculty of Engineering, Science and Mathematics Optoelectron- ics research centre.
[9] K. P. Petrov, S. Waltman, R. F. Curl, I;. K. Tittel, andL. Hollberg, “Ap- plication of a diode-laser-based CW tunable IR source to methane detec- tion in air”
[10] J. Herrán, G. Gª Mandayo, E. Castaño, “SOLID STATE GAS SENSOR FOR FAST CARBON DIOXIDE DETECTION,” Microelectronics & Mi- crosystems Unit, CEIT and Tecnun (University of Navarra), San Sebastián, Spain
[11] Georgieva, E.M, Heaps, W.S., “Robust IR Remote sensing technique of the total column of trace gases including carbon dioxide and methane,”
1Joint Center for Earth Systems Technology (JCET), UMBC, Baltimore, MD 21228, USA, NASA, Goddard Space flight Center, Greenbelt, MD
20771, USA
[12] A. Ksendzov, S. Forouhar, R.M. Briggs, C. Frez, K.J. Franz and M. Bagheri, “Linewidth measurement of high power diode laser at 2 mm for carbon dioxide detection,”
[13] Jordan Werbe-fuentes, Michael Moody, Oriana Korol, Tristan Kad-
ing,“Carbon Dioxide Absorption in the Near Infrared”
[14] http://www.coe.ou.edu/sserg/web/Results/results.htm
[15] www.co2now.org
IJSER © 2013
International Journal of Scientific & Engineering Research Volume 4, ȱŞǰȱ ȱŘŖŗř
ISSN 2229-5518
235

Akshay Anant Bhide. Is currently persuing M.tech in electronics and telecommunica- tion, Dr. Babasaheb Ambedkar Technologi- cal University, Lonere, has completed his BE in subject Electronics and Telecommuni- cation, in the year 2010,from Sinhagad Insti-
tutes of Technology, Lonavala,

Dr. S.L.Nalbalwar has received
B.E.(Computer Science & Engineering) in
1990 and M.E.(Electronics)in 1995 from SGGS College of Engineering and Tech- nology, Nanded. He has completed Ph.D. from Indian Institute Of Techno lo- gy,Delhi,in 2008.He has around 22 years of teaching experience and is working as a
professor & Head of Electronics & Telecommunication En- gineering Department at Dr.Babasaheb Ambedkar Techno- logical University, Lonere,Raigad,Maharashtra(India).His area of interest includes Multi-rate signal processing and Wavelet, stochastic process modeling. He has around 150 papers to his credit in nation and international conferences and 45 papers in the international journals. He has guided about 50M.Tech projects and about 200 B.tech projects. Al- so, presently guiding 5 PhD students.
IJSER © 2013