International Journal of Scientific & Engineering Research Volume 2, Issue 9, September-2011 1
ISSN 2229-5518
Managing Human-Leopard Conflicts in Pauri Garhwal, Uttaranchal, India using Geographical Information System and Remote Sensing
Manoj Agarwal, Devendra S. Chauhan, S. P. Goyal and Qamar Qureshi
Abstract - Geographical Information System (GIS) and Remote Sensing have played a vital role in conservation and management of the natural resources and in enhancing our understanding of human-wildlife conflicts. Recently, there has been increase in man-animal conflicts in different parts of the country due to habitat degradation and human encroachments in forest areas. The Wildlife Institute of India has initiated a study to assess the level of ongoing human-leopard conflict in Pauri Garhwal District of Uttaranchal in relation to landscape characteristics. Remote sensing and GIS have been used to estimate the severity of human-leopard conflicts in relation to vegetation categories.
The IRS LISS III satellite data was used to prepare thematic map using hybrid classification method. Broad vegetation class es like Oak, Pine, Sal and Scrub were delineated. Spatial database in GIS domain comprising digital elevation model and settlements were also developed at 1:50,000 scale. To study the conflict zones a spatial grid of 2 km x 2 km was generated. In each cell of the grid, conflict level and associated landscape characteristics were recorded. Area was categorized into different conflict categories such as low, medium, high and no conflict areas.
It was found that high and medium conflict zones have higher scrub cover (>48%) and the grids have higher adjacency of forest and habitat/agriculture. The conflicts were highest in areas having more or less equal percentage of forest and habitation/agriculture. In no conflict zones, the grids have forest and habitation/agriculture ratio of almost 70:30. Primary and secondary data also suggest that frequency of leopard visits were high in scrub habitat.
The study has given a better understanding of wildlife management and conservation issues in the area which would help mitigating planning of human-leopard conflicts. Also the utility of Remote Sensing and GIS technology in wildlife conservation planning has been demonstrated.
Index Terms – Conflict, GIS, Human, Leopard, Remote Sensing, Uttaranchal, Wildlife.
1 INTRODUCTION
—————————— ——————————
ONFLICTS between human and wildlife in India are escalating due to increasing human population, loss of natural habitats, scarcity of forage resources and due to increase in wildlife population locally (Rodgers 1989; Saberwal et al. 1994). Like other conflict areas in India, Pauri Garhwal in Uttaranchal is also one the areas where human-leopard conflicts have been seen increasing in recent past (Negi, 1996)
is a serious problem in this area.
Leopards are common in the forests across the Pauri Garhwal. Their food consists of wild prey species such as goral, barking deer, wild boar, jungle fowl and langur. Due to severe human pressure mainly hunting, cattle grazing, fire wood collection, forest fire, deforestation and habitat alteration, most of these prey species are either locally extinct or their numbers are too low to sustain the existing leopard populations. Leopards are unable to find their natural prey in diminishing forests and have been making regular visits in human habitat in to prey upon domestic animals and often encountered with human.
Increasing frequency of human-leopard conflicts during last decade in Pauri Garhwal may be due to accelerating trends in habitat fragmentation, decline in potential habitats, scarcity of wild prey, feeding predominantly on domestic species. These causes probably have lead animal to come more closely in contact with human and to some extent may be due to increase of leopard population in the area.
The Remote Sensing and GIS have been widely used for understanding the causes of such conflicts in relation to habitat characteristics. Utility of the Remote Sensing data has also been amply demonstrated through a number of studies (Tiwari and Kudarat 1988; Bhan et al. 1989; Tiwari et al. 1991; Raghubanshi et al. 1991). Therefore, present study is to understand the different level of human-leopard conflicts in relation to landuse pattern and habitat characteristics in Pauri Garhwal using RS and GIS approaches.
IJSER © 2011 http://www.ijser.org
International Journal of Scientific & Engineering Research Volume 2, Issue 9, September-2011 2
ISSN 2229-5518
2 STUDY AREA
Uttaranchal is a newly formed state of India, comprising 13 districts. Uttaranchal is very rich in Biodiversity having 6
National Parks and 6 Wildlife Sanctuaries. Pauri Garhwal is
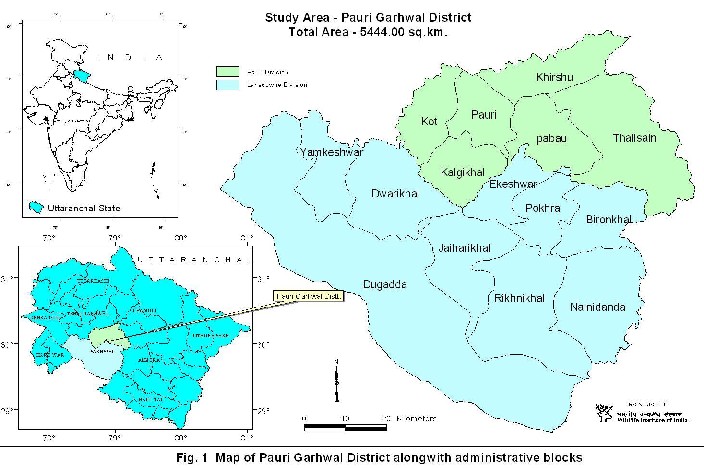
one of the districts of Uttaranchal covering 5444.00 sq. km. geographical area ranging from 78o 12 ‘ E to 79 o 14 ‘ E to 29 o
26‘ N to 30 o 19 ‘. This district is divided into two divisions’ viz. Pauri and Lansdowne, having 6 and 9 Administrative Blocks in each division respectively (Fig. 1.).
The Pauri Garhwal falls in Biogeographic Zone 2 (Himalaya) and Province 2B (Western Himalaya) as per the Biogeographic Classification of India (Rodgers et al. 2002). Pauri Garhwal falls between lesser Himalaya and middle Himalaya, and reaches up to 3200 mt. altitudinal from the mean sea level. The temperature varies from 1oC minimum in the month of January and goes up to 45oC maximum in the month of June. Average rainfall in the district is 218 cm. in which, approximately 90 percent over the monsoon and average relative humidity is approximately 58 percent. The entire district is rugged and mountainous except some part of “Bhabar”. There is great variation in nature of soul, precipitation, rocks, topography, climate and corresponding vegetation features. Gaur and Bartwal (1993) classified forests of a Pauri Garhwal in to Sub-Montane (Tropical & Subtropical), Montane (Temperate) broad leaves, and Gymnospermous. The fauna like Goral (Nemorhaedus goral),
barking deer (Muntiacus muntjak) and sambar (Cervus unicolor) are common medium to large sized wild herbivores and troops of Rhesus macaque and common langur (Presbytis entellus) have also been reported from the area. Habitat also supports a fairly large population of domestic livestock.
3 DATA AND METHODS
Indian Remote Sensing Satellite LISS III digital data of
November 1998 data was used with the spatial resolution of
23.5 x 23.5 mt.. Pauri Garhwal District (study area) boundary,
Divisional boundary, settlements, drainages, roads were
extracted from Survey of India toposheets at 1:50000 scale and
a base map of the study area was prepared. The spatial
database is developed in Polyconic projection system
(Lillesand and Keifer, 1987).
IJSER © 2011 http://www.ijser.org
International Journal of Scientific & Engineering Research Volume 2, Issue 9, September-2011 3
ISSN 2229-5518
Reconnaissance survey for vegetation and other landscape features was carried out in 1999. After the survey, it was decided to generate a spatial grid of 2 km x 2 km for entire study area to get accurate information about human-leopard conflicts as has been suggested for such studies by (Buckland and Elston, 1993).
To prepare the landuse/landcover map for the study area, the remote sensing techniques were effectively utilized as a tool for mapping of forests and other landuse patterns (Sudhakar et al. 1994). A False Color Composite (FCC) was generated and Image was enhanced to improve the visual appearance of the image and also to discriminate most vegetation types.
Hardcopies of the imageries were printed at 1:50,000 scale with overlaying the linear features viz. roads, drainages and village locations to find out the exact and accurate position on the imagery. These imageries were taken to the study area for ground truthing. Global Positioning System (GPS) was used to get the geographical location of vegetation and non- vegetation classes on the imagery.
Imageries were geographically corrected with the Survey of India toposheets at 1:50,000 scale (Bobbe, 1992). Root Mean Square error of 12 m was obtained for geo-rectification of the imageries. Unsupervised classification was run for 50 classes
to classify vegetation and other habitat types. Once again classified imageries were taken to the field for ground truthing and Survey of India toposheets were also used to get accurate location of vegetation and non-vegetation types.
Normalised Difference Vegetation indices (NDVI) were used get accurate landuse/landcover map (Abdolrassoul, Mahiny,
and Turner, 2004). Final classification was done using hybrid classification methods. To cover all the vegetation types, on an average of 25 GPS values for each class were collected. Oak, Pine, Sal , Scrub and Habitation/Agriculture were identified classes in Pauri Garhwal.
A Digital Elevation Model (DEM) was generated by using contours at 40 m. interval. Slope and Aspect were also generated. During classification process, some pixels were shown the similar reflectance values of Sal and Oak. These two forest classes were separated out by using the Rule Based classification scheme based on elevation ranges as sal forest occurs approximately up to 1400 m in the Pauri District (on the basis of literature, survey of India toposheets and ground truthing). After using Hybrid classification method, landuse/landcover map was produced and smoothened by using nearest neighborhood technique (ERDAS, V8.7), through which hanging small pixel were merged into the dominating major classes.
IJSER © 2011 http://www.ijser.org
International Journal of Scientific & Engineering Research Volume 2, Issue 9, September-2011 4
ISSN 2229-5518
Survey for number of human-leopard conflicts and severity of conflicts were done for each grid under ongoing research project of the Institute titled ‚A study on distribution, relative abundance and food habits of leopard (Panthera pardus) in Garhwal Himalayas”. The extent and severity of conflict was estimated on the basis of leopard attack on human and livestock depredation. Primary data was collected on presence of leopard by using camera trapping technique (Karanth and Nichols, 1998), GPS locations of scat and pugmarks in the study area were noted. Secondary data was collected from Forest Department and local residents. Literature was also considered to get related information. Primary and secondary data of human-leopard conflicts collected were overlaid. According to data collected from primary and secondary, all grids were classified and coded into different conflict categories viz. low, medium, high and no conflict based on severity of problems and number of attacks on livestock and
human. Finally categorized grids were overlaid onto the thematic map. With the help the GIS software (ArcInfo 8.02 & ArcView 3.2), the areas were extracted of different landuse/landcover associated with the different levels of conflict zones.
4 RESULT AND DISCUSSION
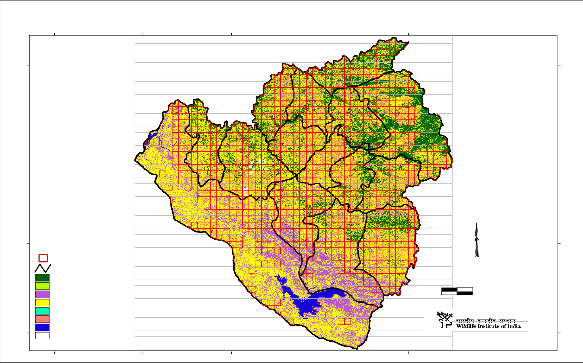
Around 50% grids reported to have high human conflicts (Table 1) are having high conflicts. Grids categorized as low, medium and high conflict zones in relation to vegetation types are shown in Fig. 2a and Fig. 2b. The vegetation patterns for the conflict zones indicate that around 48% area is dominated by scrub, followed by habitation/agriculture fields and forest (Fig. 3).
TABLE 1
PERCENT AREA UNDER VARIOUS CONFLICT ZONES
Categories | Number of Grids | Low Conflict Zone | Medium Conflict Zone | High Conflict Zone |
Categories | Number of Grids | No. of Grids | % Area | No. of Grids | % Area | No. of Grids | % Area |
Human-Leopard conflict | 109 | 19 | 17.43 | 36 | 33.03 | 54 | 49.54 |
Overall conflict | 1006 | 365 | 36.28 | 435 | 43.24 | 206 | 20.48 |
78°15'
78°30'
78°45'
79°00'
79°15'
79°30'
30°45' 30°45'
Khirshu
Kot
Pauri
Pabau
Thalisain
Yamkeshwar
Dwarikhal
Kalgikhal
30°30' 30°30'
Ekeshwar
Pokhr a
Bironkhal
Jaiharikhal N
30°15'
30°00'
Low conf lict Medium conflict High conflict Block boundary
Oak dominated mixed forest
Pine dominated mixed forest Sal dominated mixed forest Scrub/woody scrub
Deodar Habitation/Agriculture River/waterbody Cloud/shadow
Dugadda
Rikhnikhal
Nainidanda
0 5 10 Kilometers
RS & G IS C ell
30°15'
30°00'
78°15'
78°30'
78°45'
79°00'
79°15'
79°30'
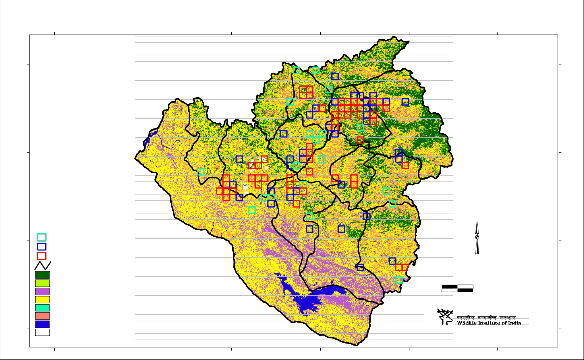
Fig. 2a. Spatial Distribution of Human-leopard Conflicts in Pauri Garhwal
IJSER © 2011 http://www.ijser.org
International Journal of Scientific & Engineering Research Volume 2, Issue 9, September-2011 5
ISSN 2229-5518
78°15'
78°30'
78°45'
79°00'
79°15'
79°30'
30°45' 30°45'
Khirshu
Kot
Pauri
Pabau
Thalisain
Yamkeshwar
Dwarikhal
Kalgikhal
30°30' 30°30'
Ekeshwar
Pokhr a
Bironkhal
Jaiharikhal N
30°15'
30°00'
Overall conflict
Block boundary
Oak dominated mixed forest Pine dominated mixed forest Sal dominated mixed forest Scrub/woody scrub
Deodar Habitation/Agriculture River/waterbody Cloud/shadow
Dugadda
Rikhnikhal
Nainidanda
0 5 10 Kilometers
RS & G IS C ell
30°15'
30°00'
78°15'
78°30'
78°45'
79°00'
79°15'
79°30'
Fig 2b. Spatial Distribution of Overall Conflicts in Pauri Garhwal
60
50
40
30
20
10
0
Forest Scrub Habitat/Agriculuture
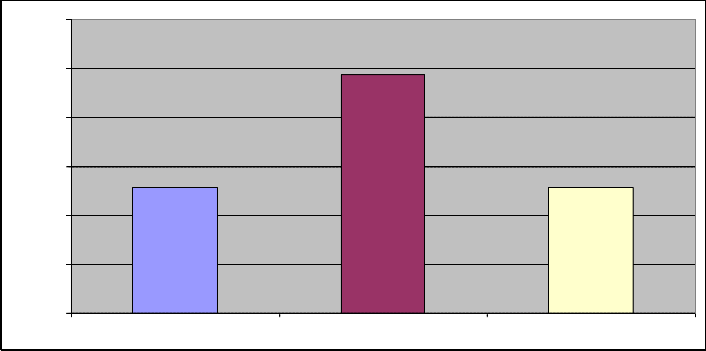
Fig. 3. Percent area under Habitation categories in conflict zones
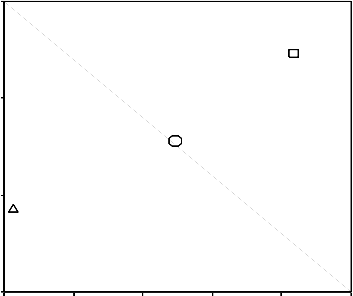
There is a direct relationship between percent scrub and percent habitat/agriculture of total conflict areas with respect to increase in severity of conflicts (Fig. 4). It has been observed
that the areas where the percentages of habitation/agriculture and scrub areas are high, there is high possibilities of having human-leopard conflicts (Fig. 4).
IJSER © 2011 http://www.ijser.org
International Journal of Scientific & Engineering Research Volume 2, Issue 9, September-2011 6
ISSN 2229-5518
30
20
10 Confli ct levels

 medium low
0
4 6 8
10 12

high
14
% Hab itation/Agr iculture of to tal conflict areas
Figure 4. Relationship among scrub, habitation/ agriculture and conflict area
The scrub area provides and helps free movement and ambush cover to leopards and provide most conducive habitat for easy attack on human or livestock (Bailey, 1993). The agriculture fields are the places where the human movement is frequent. But according to earlier studies (Chauhan et al.
2000), it is stated that leopard visits to agriculture fields and human habitations not for attacking the human but for livestock as prey. Predating the livestock is comparatively easy for leopard. Thus, scarcity of wild prey species and looking for easy prey leads to attack on human or livestock.
5 LANDUSE
The percent forest cover of the total forest area is 25.71 % and
34.17 % in conflict and non-conflict zones respectively (Fig. 5).
The area covered under Habitation/agriculture was 16.29 % in
entire District whereas it was 25.59 % in conflict zones. The
conflicts were observed highest in areas, having more or less
equal percentage of forests and habitation/agriculture whereas
in no conflict zones the grids have forest and
habitation/agriculture ratio of almost 70:30.
40
35
30
25
Forest
20
Habitat/Agriculuture
15
10
5
0
Conflict Zones Non-conflict Zones
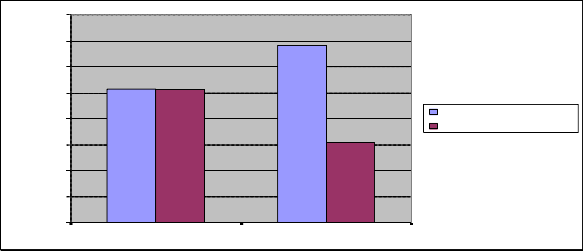
Fig. 5. Percentage area under Forest and Habitatation/Agriculture in conflict and non conflict zones
IJSER © 2011 http://www.ijser.org
International Journal of Scientific & Engineering Research Volume 2, Issue 9, September-2011 7
ISSN 2229-5518
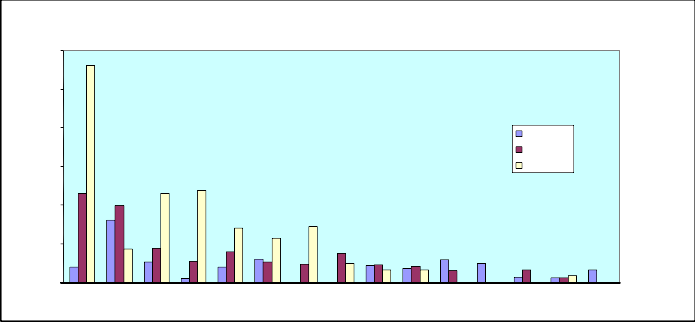
It was observed that out of fifteen Administrative Blocks, Pabau, Dwarikhal, Kalgikhal, Jaiharikhal, Thalisain, Pauri and
Dugadda were most inflicted by leopard conflicts (Fig. 6).
Blockwise Conflict levels
30.00
25.00
20.00
15.00
%low
%medium
%High
10.00
5.00
0.00
Pab au Kalg ikhal Pauri Dwarikhal Jaiharikhal Ekeshwar Po khra Thalisain B iro nkhal Nainid and a Khirshu Ko t Rikhnikhal Dug ad d a Y amkeshwar
Blocks
Fig. 6. Level of conflicts in various Administrative Blocks in Pauri Garhwal
CONCLUSIONS
Under the present study, a spatial map indicating various conflict zones and associated landscape characteristics has been developed, which provides improved understanding of the causes to provide a basis for human-leopard conflicts in Pauri Garhwal. We observed that high conflict zones exist where the human habitations have increased and are dominated by high scrub. This entire study or work can also be used for temporal analysis in future managing and minimizing human-leopard conflicts in Pauri Garhwal.
The study has demonstrated the utility of Remote Sensing and GIS in enhancing our understanding of the landscape characteristics and in identifying critical areas for monitoring the human-leopard conflicts in the district of Pauri Garhwal.
ACKNOWLEDGEMENTS
We are extremely thankful to Sh. P.R. Sinha, Director, Wildlife Institute of India (WII) for providing necessary facilities to undertake this work. We are also thankful to Dr. V.B. Mathur, Dean, WII for his kind support and encouragement throughout the study.
REFERENCES
1. Abdolrassoul, S., Mahiny, Brain and Turner, J. 2004. Modelling past vegetation change through remote sensing and GIS : A comparison of neural networks and logistics regression methods, International Conference on Geoinformatics and modeling Geographical System & Fifth International Workshop on GIS, Beijing. 2-4 April, 2004, Beijing, China.
2. Bailey, T.N. 1993. The African Leopard : Ecology and behavior of solitary field. Columbia University Press, New York, USA, 429p.
3. Bhan, S.K. Ravindran K.V., Tiwari, A.K., Kudarat, M, Diwakar, P.G., Kannappan, K.T., Vohra, T.P.S. and Vardan, K.K.S. 1989. Potential of IRS 1A data for land resources mapping – A case study from Punjab and Chandigarh. Presented in Regional Workshop on IRS 1A. Mission and its application potential, Ludhiana. April 27, 1989.
4. Bobbe, T. 1992. GPS World, 3, 18-22.
5. Buckland, S.T. and Elston, D.A. 1993. Empirical model for the spatial distribution of wildlife. Journal of Applied Ecology 30:478-495.
6. Chauhan, D.S., Goyal, S.P., Agarwal, M. and Thapa, R. 2000. A study on distribution, relative abundance and food habits of leopard (Panthera pardus) in Garhwal Himalayas”. Technical Report – 1999-2000, Wildlife Institute of India, Dehradun, India.
7. ERDAS, V8.7, Field Guide, ERDAS Inc. Atlanta, Georgia.
8. Gaur, R. D. and Bartwal, B. S. 1993. Different types of forest communities in Pauri District (Garhwal Himalaya), 131-147. In Garhwal Himalaya : Ecology and Environment, ed. G. S. Rajwar, pp. 131-147 Asingh Publishing House, New Delhi.
9. Karanth, K. U. and Nichols, J.D. 1988. Estimating tiger densities in India from
camera trap data using photographic captures and recaptures. Ecology. 79,
2852-2862.
10. Lillesand, T.M. and Keifer, R.W. 1987. Remote Sensing and Image
Interpretation, John Wiley, New York.
11. Negi, A. S. 1996. Man-eating leopard of Garhwal. Cheetal, 35 (1-2) : 22-24.
12. Raghubanshi, A.S., Jha, C.S., Pandey, C.B., Singh, Lalji and Singh, J.S. 1991.
Effect of forest conservation on vegetation and soil carbon and functional trait of resulting vegetation : An impact of global climatic changes in photosynthesis and plant productivity : Proceeding of Indo-US Workshop. New Delhi, 723-746p.
13. Rodgers, W.A. 1989. Policy issues in wildlife conservation, Indian Journal of
Public Administration 35: 461-468.
IJSER © 2011 http://www.ijser.org
International Journal of Scientific & Engineering Research Volume 2, Issue 9, September-2011 8
ISSN 2229-5518
14. Rodgers, W.A., Panwar, H.S. and Mathur, V.B. 2002. Wildlife Protected Area Network in India : A Review (Executive Summery). Wildlife Institute of India, Dehradun.
15. Saberwal, V. K. , Gibbs, J. P. Chellam, R. and Johnsingh, A. J. T. 1994. Lion-
human conflict in Gir forest, India. Conservation Biology 8(2): 501-507.
16. Sudhakar, S., Das, R.K., Chakraborty, D., Bardhan R.B.K., Raha, A.K., Shukla, P. 1994. Stratification approach for forest type and landuse mapping using IRS-1A, LISS II data-A case study – Journal of the Indian Society of Remote Sensing, Vol. 22, No.1, 21p
17. Tiwari, A. K. and Kudarat, M. 1988. Analysis of vegetation in Rajaji National Park using Indian Remote Sensing data. Presented in National Seminar on IRS 1A Mission and its application potential, Hyderabad. December 22-23,
1988.
18. Tiwari, A.K., Kudarat, M. and Bhan, S.K. 1991. Analysis of vegetation and soil association through digital processing of remote sensing data : A case study of a part of Western Himalaya. In Mountain resources management and remote sensing (P.N. Gupta and A.K. Roy, eds.).
149-157p.


*Manoj Agarwal is currently engaged in various research projects
of the Institute in which GIS and Remote Sensing technology is involved for conserving & managing wildlife and their habitat. Email : manojkumar@wii.gov.in


Devendra S. Chauhan is currently working for wildlife conservation in India.

S. P. Goyal is currently working on wildlife ecology of herbivores and carnivores, molecular ecology, landscape genetics and wildlife forensics at National level.
Qamar Qureshi is currently involved with projects dealing with biodiversity assessment at the landscape and species level in India.

*Contact:
Wildlife Institute of India, Post Box 18, Chandrabani, Dehradun – 248001, Uttaranchal, INDIA
Tel.: +91-135-2640111, Fax: +91-135-2640117
Website: www.wii.gov.in
IJSER © 2011 http://www.ijser.org