International Journal of Scientific & Engineering Research, Volume 3, Issue 11, November-2012 1
ISSN 2229-5518
Land use land cover change detection of Ghatkesar mandal,RangaReddy district using Remote sensing and GIS
Faridkhan,Dr.T.Vijayalakshmi,Dr.Santosh Kumar
ABSTRACT
Land use and land cover change has become a central component in current strategies for managing natural resources and monitoring environmental changes. Urban expansion has brought serious losses of agriculture land, vegetation land and water bodies. Urban sprawl is responsible for a variety of urban environmental issues like decreased air quality, increased runoff and subsequent flooding, increased local temperature, deterioration of water quality, etc. In this work we have taken Rangareddy District, Ghatkesar Mandal as case to study the urban expansion and land cover change that took place in a span of 05 years from 2006 to 2011. Remote sensing methodology is adopted to study the geographical land use changes occurred during the study period. Satellite Imagery- IRS1D, LISS-III+PAN FUSED of two different year are taken into consideration. After image pre-processing, un- supervised classification has been performed to classify the images in to different land use categories. Classification accuracy is also estimated using the field knowledge obtained from field surveys. Information on urban growth, land use and land cover change study is very useful to local government and urban planners for the betterment of future plans of sustainable development of the city.
Keywords: Remote sensing, GIS, classification, vegetation type, water body, Agricultural.
—————————— ——————————
Land use refers to “man’s activities and various uses, which are carried on land such as agriculture, settlements, industry etc”. Land cover refers to the material present e.g. vegetation, water bodies, rocks/soils and other resulting from land transformations. Although land use is generally inferred based on the cover, yet both the terms land use and land cover being closely related are interchangeable.[1] Change detection is one of the landscape ecological aims. Preparing landscape Characteristics maps can help to change detection. Land is the most important natural resources on which all activities are based. Land use unlikely geology, is seasonally dynamic and indeed is more changing[2]. All agricultural, animal and forestry productions depend on productivity of the land [3].
Understanding landscape patterns, changes and interactions between human activities and natural phenomenon are essential for proper land management and decision improvement. Land Cover, defined as the assemblage of Biotic and abiotic components on the earth’s surface is one of the most crucial properties of the Earth system[4]. Land cover includes water bodies, snow, grassland, forest, and bare Soil. Land Use includes agricultural land, built up land, recreation area, wildlife management area etc.
Remote Sensing (RS) and Geographic Information System (GIS) are now providing new tools for advanced ecosystem management. For efficient planning and management, the classified data in a timely manner, in order to get the classified data of the ground; satellites are the best resources to provide the data in a timely manner[5].Identifying delineating and mapping land cover are important for global monitoring studies with the component of resource management and planning activities[6]. The collection of remotely sensed data facilitates the synoptic analyses of Earth - system function, patterning, and change at local, regional and global scales over time; such data also provide an important link between intensive, localized ecological research and regional, national and international conservation and management of biological diversity. Spatial patterns of land use/cover over different time periods in particular can be systematically mapped, monitored and accurately assessed from Satellite data accompanied with conventional ground data[7].this study to map out the status of land use land cover of Ghatkesar between 2006 and 2011 with a view to detect the changes that has taken place in this status particularly in the built-up land so as to predict possible changes that might take place in this status in coming years using both Geographic Information System and Remote Sensing data.
IJSER © 2012 http://www.ijser.org
International Journal of Scientific & Engineering Research, Volume 3, Issue 11, November-2012 2
ISSN 2229-5518
Study area: Ranga Reddy District was formed on 15th August, 1978 by carving out some portion of Hyderabad Urban Taluk & the merger of the entire Rural and Urban Areas of the remaining Taluks of Erstwhile Hyderabad District.The District is located in the Central Part of the Deccan Plateau and lies between 160 30' and 180 20' of North Latitude and 77030' and 79030' of East Longitudes. Ghatkesar is a village and mandal in Ranga Reddy District, located on the outskirts Hyderabad, India. It is on the National Highway 202, having coordinates ranging between 17027´14˝ N and 78041´11˝ E. It has an average elevation of 469 meters (1541 feet).
The District is bounded on the North by Medak District, East by Nalgonda District, South by Mahaboobnagar District and West by Gulbarga District & North West of Bidar District of Karnataka State. Ranga reddy district covers an area of 7564.88 Sq. Kms. Ghatkesar Mandal covers a geographical area of 16689 Hectares. There are 21 villages in Ghatkesar mandal.
The main objectives of land use/ land cover classification system are
Objectives
To develop a land use land cover map of study
area.
To see the applicability of merged data of IRS-ID LISS-III satellite data for delineating various land use/ land cover categories through digital image analysis and processing (i.e. unsupervised classification) as well as visual interpretation techniques.
To study land use land cover dynamics of study area.
The land use map will be utilized as a basic
database, which provides the information for allocating new land use practices.
It will incorporate demographic, economic and environmental impacts, which have occurred in an area.
Land use land cover classification system as devised by NRSA was used.
Not only will the information indicate where intensive development has already taken place and where there is open land suitable for future expansion, but it will also make it possible to determine special areas, such as prime agricultural lands.
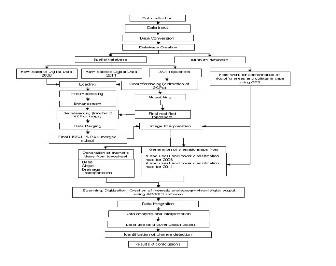
Acquisition and processing of raw data preparation of thematic maps involves the following steps.
Fig. 1. Methodology used in Lu/Lc change detection studies.
Survey of India toposheets No. 56K/10, 56K/11,
56K/14, 56K/15 on 1:50,000 scale.
Acquisition of IRS-1D LISS-III and PAN satellite data of the year 2006 & 2011 from NRSC, Balanagar, Hyderabad and toposheets from Survey of India, Hyderabad.
Geo-referencing of toposheets based on latitude and longitudinal values.
Edge matching of the toposheets and preparation of digital mosaic depicting the study area.
Geo-coding and geo-referencing of LISS III and PAN digital data by extracting the Ground Control Points (GCPs) from SOI toposheets.
Digital image enhancement and application of correction models for making the digital data free from errors and distortions both radiometry and geometry of the satellite data.
Fusion of PAN and LISS III for merged product preparation of a mosaic, which shows the continuous imagery of the study area. This is FCC mode and is used for visual interpretation. Generation of thematic maps using ARC GIS software.
In this study, the remote sensing data in the digital mode is used and is obtained by LISS III and PAN of IRS ID. The LISS III is 4-band
IJSER © 2012 http://www.ijser.org
International Journal of Scientific & Engineering Research, Volume 3, Issue 11, November-2012 3
ISSN 2229-5518
multispectral imagery with a ground
resolution of 23 m. PAN is a higher resolution panchromatic band with a ground resolution of 5.8 m[8].
Therefore, it is more appropriate to give the sensor characteristics of LISS III and PAN. LISS III sensor operates in four spectral bands; there are separate optics and detector arrays for each band. Map of 1:50,000 scale obtained from SOI covering the entire study area is used to extract the Ground Control Points (GCPs) and to demarcate the boundary of study area. This information is then used for image registration of LISS III and PAN digitally using ARC GIS 9.1 software.
Image Enhancement deals with the individual values of the pixels in the image. The goal of spectral enhancement is to make certain features more visible in an image by bringing out more contrast. Initial display of LISS III data through ERDAS software revealed that the features like minor roads, streams and Musi River are not clear/visible as the contrast of the imageries very dull because of the raw data values fall within a narrow range. The following standard techniques have been adopted for Geo-referencing of LISS III and PAN data covering the study area. ERDAS (Image Processing Software) has been used for the work.
1:50,000 scale top sheets are scanned and raster file for study area is created. These are geo- referenced based on the longitudinal & latitudinal co-ordinates. After geo-referencing all the maps are edge-matched and a digital mosaic is prepared which depicts the continuity of the study area.
Sufficient number of well-distributed ground control points is selected both on the maps and corresponding imagery. Care is taken to satisfy the condition on density of GCPs for image registration. Geo-referencing is carried out using ERDAS image processing software. The geo-referenced image is further mosaiced and then feature matching is carried out. At the end of this process the digital data, which is free from all distortions, is available for digital image enhancement, classification for Land use/land cover map preparation with the help of Visual image analysis techniques.
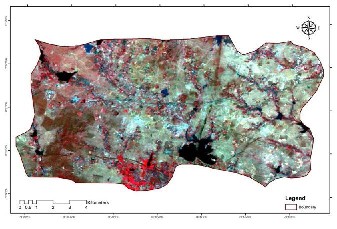
Fig. 2. IRS 1D LISS-III SATELLITE IMAGERY-2006
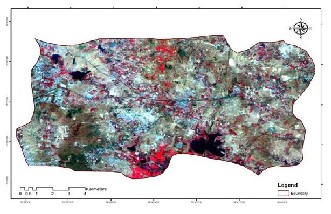
Fig. 3. IRS 1D LISS-III SATELLITE IMAGERY-2011
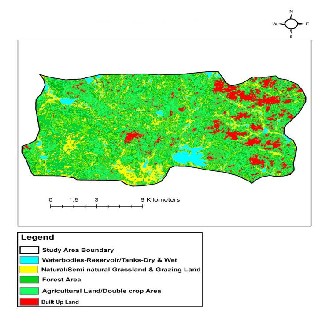
Fig. 4. Land Use / Land Cover Map - 2006
IJSER © 2012 http://www.ijser.org
International Journal of Scientific & Engineering Research, Volume 3, Issue 11, November-2012 4
ISSN 2229-5518
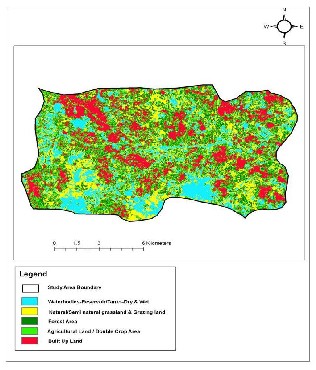
Fig. 5. Land Use / Land Cover Map – 2011
TABLE 1
Change detection (2006-2011)
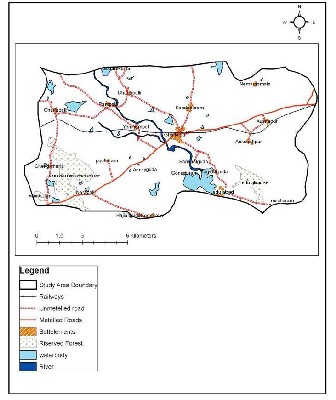
Fig. 6. Base Map of Study Area
LISS III PAN merged satellites data for the year 2006 and 2011 are represented in figure 2 and 3.
Lu/Lc is prepared for waterbodies, grasslands,
forest, agricultural land and built up land shown in figure 4 and figure 5.
A base map is prepared showing major roads and railways as shown in figure 6. The major settlements in the present study area are in Charlapalli,Chengicharla,Narapalli,Hajialguda, Koremalla,Adilabad,Nemargamala,Rampalli,Kond apur,Ghatkesar,Gonapur,Bankanguda,Maripalligu da,Pocharam,Yemna-mpet,Godamkunta, Ankshahpur ,Aushapur etc.
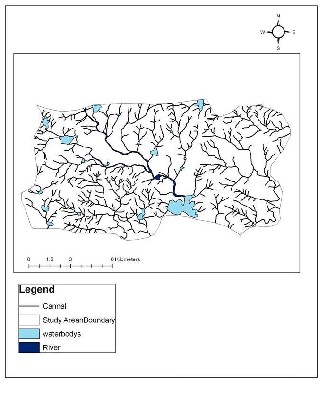
A drainage map showing waterbodies and with Irregular branching of channels in tree like fashion is observed which is a characteristic of dendritic pattern of drainage which usually develops on Homogenous massive rocks and flat lying strata. The dendritic pattern of drainage showed third order basins,Figure 7.
A pie chart showing change detection observed between years 2006 and 2011 is shown in figure 8.
IJSER © 2012 http://www.ijser.org
International Journal of Scientific & Engineering Research, Volume 3, Issue 11, November-2012 5
ISSN 2229-5518
ANNOJIGUDA
Increase in grassland (0.26%), agriculture (0.058%) and built up (0.012%) but decrease in forest (-1.578%) and waterbodies (-0.065%).
ANKUSHAPUR
Increased in Built up land (1.553%) and forest (1.284%), but Decease in waterbodies (-0.152%), agriculture (-0.102%), and grassland (-0.052%).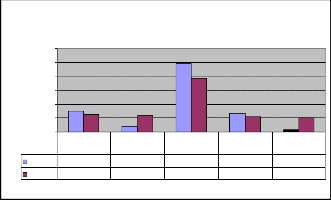
Fig. 7. Drainage Map of Study Area
PIE CHART SHOWING THE DIFFERENCE BETWEEN 2006 &
2011
12000
10000
8000
6000
4000
2000
0
AUSHAPUR
Increase in grassland (1.744%), waterbodies (0.281%) and built up (0.003%) but decrease in agriculture (-0.069%) and forest (-4.422).
BANKNALGUDA
Increased in Agriculture (1.05%), grassland (0.172%), waterbodies (0.021%) and built up (0.04%) but decease in forest (-0.841%).
CHERRLAPALLI
Increased in Built up (0.262%), grassland (0.25%) and
decrease in forest (-0.8%), waterbodies (-0.773%) and agriculture (-0.31%).
CHENGICHERLA
Increased in Agriculture (2.105%) and built up (1.518%) and forest (0.049%) but decrease in waterbodies (-1.362%) and grassland (-0.067%).
GHATKESAR
Increased in Grassland (1.479%), agriculture (0.77%) and built up (0.669%) but decrease in forest (-4.07%) and waterbodies (-0.262%).
GONAPURAM
Increased in Grassland (0.451%) and built up (0.268%) but decease in forest (-0.96%), waterbodies (-0.692%) and agriculture (-0.126%).
GODAMKUNTA
Increase in Built up (0.064%) but decrease in agriculture
Water bodies-
Reservoirs/Tan
Natural
Grassland &
Forest area Agricultural land/Crop
Built up land
(-0.289%), waterbodies (-0.283%), forest (-0.4%) and
Series1 3004.02 834.45 9846.81 2670 333.78
Series2 2503.35 2336.46 7676.94 2169.57 2002.68
LEGEND
Fig. 8. Pie chart (2006-2011)
4. CONCLUSION
Change Detection Analysis (2006-2011):
Change detection in 21 villages under Ghatkesar Mandal
(2006-2011)
EDULABAD
There is an increase in Built up land (1.024%), grassland
(0.684%) and agriculture land (0.06%) but decline in forest
(-0.69%) and waterbodies (-0.577%).
grassland (-0.146%).
HAJJALGUDA
Increased in Waterbodies (1.155%) and grassland (1.208%) and agriculture (0.006%) but decease in forest (-0.31%) and built-up (-0.073%).
KONDAPURAM
Increase in forest (2.655%), waterbodies (0.106%) and Grassland (0.022%), but decrease in agriculture (-1.838%) and built up(-0.009%).
KORREMULA
Increase in waterbodies (1.086%), grassland (1.363%) and agriculture (0.02%), but decrease in forest (-0.278%) and built up (-0.074%).
MADHARAM
Increase in forest (0.863%), grassland (0.202%) waterbodies
(0.157%), built up(0.059%) and agriculture (0.035%).
IJSER © 2012 http://www.ijser.org
International Journal of Scientific & Engineering Research, Volume 3, Issue 11, November-2012 6
ISSN 2229-5518
MARPALLIGUDA
Increase in grassland (0.974%), built up (0.495%) and agriculture (0.134%) but decrease in waterbodies
(-1.002%) and forest (-0.89%).
MEDIPALLY
Increase in grassland (0.355%) and built up (0.14%) but decrease in forest (-1.328%), agriculture
(-0.097%) and waterbodies (-0.048%).
NARAPALLY
Increase in grassland (0.02%) but decease in Forest
(-3.814%), Waterbodies (-0.549%), Agriculture
(-0.478%) and Built Up (-0.015%).
NEMAGMALA
Increase in Forest (0.629%), Grassland (0.28%), Waterbodies
(0.244%), Agriculture (0.148%) and Built Up (0.09%).
POCHARAM
Increase in Built Up (0.878%), Forest (0.11%) and decease in
Agriculture (-1.31%), Grassland (-0.101%) and Water
(-0.093%).
RAMPALLY
Increase in Built Up (2.064%), Forest (1.22%) but decrease in Agriculture (-2.607%), Waterbodies (-0.097%) and Grassland (-0.064%)
YEMNAPET
Increase in Built-up (1.092%) ,Forest(0.48%) but decrease in
Agriculture(-0.16%),Water(-0.064%) and Grassland
(-0.034)%
[1] B. S. Chaudhary et al., Human Induced Land Use/ Land Cover Changes in Northern Part of Gurgaon District, Haryana, India:Natural Resources Census Concept, J. Hum. Ecol., 23(3): 243-252 (2008)
[2] vemu sreenivasulu et al., pinnamaneni udaya bhaskar, Change Detection In Landuse And Landcover Using Remote Sensing And Gis Techniques, International Journal Of Engineering Science And Technology, Vol. 2(12), 2010, 7758-7762
[3] K. sundarakumar et al., Land Use And Land Cover Change Detection And Urban Sprawl Analysis Of Vijayawada City Using Multitemporal Landsat Data, International Journal Of Engineering
Science And Technology (IJEST), vol. 4 no.01,pg; 171-178, january
2012, ISSN : 0975-5462
[4] Prakasam.C, Land Use And Land Cover Change Detection
Through Remote Sensing Approach:A Case Study Of Kodaikanal Taluk, Tamil Nadu, International Journal Of Geomatics And Geosciences Volume 1, No 2, 2010
[5] Y.Babykalpana et al., Classification Of Lulc Change Detection Using Remotely Sensed Data For Coimbatore City, Tamilnadu, India, Journal Of Computing, Volume 2, Issue 5, MAY 2010, ISSN 2151-9617 [6] E.P. Nobi, Land Use And Land Cover Assessment Along Pondicherry And Its Surroundings Using Indian Remote Sensing Satellite And GIS, American-Eurasian Journal Of Scientific Research 4 (2): 54-58, 2009, ISSN 1818-6785.
[7] V. Rahdary et al., Land Use And Land Cover Change Detection Of Mouteh Wildlife Refuge Using Remotely Sensed Data And Geographic Information System, World Applied Sciences Journal 3 (Supple 1):
113-118, 2008, ISSN 1818-4952.
[8] Veena U. Joshi – Vikas Nagare, Land Use Change Detection Along The Pravara River Basin In Maharashtra, Using Remote Sensing And Gis Techniques., Agd Landscape & Environment 3 (2) 2009. 71-
86.
1. The Author of this paper, Farid Khan is working as Assistant Professor in ANURAG group of institutions.He has obtained M.Sc degree in Plant Sciences from Hyderabad Central University and M.Tech in Environmental Management from Jawaharlal Nehru Technological University Hyderabad. Areas of Specialization in Environmental Geomatics .
He can be reached through E-mail :
faridkhan999@gmail.com
2. Dr.T.Vijayalakshmi,Co-Author, is working as Assistant Professor in Jawaharlal Nehru Tehcnological Univesity Hyderabad. Areas of
Specialization in Environmental Geomatics, Environmental Impact Assessment, Water
Quality Assessment & Mapping. Water
Harvesting.
3. Dr.Santosh Kumar Co-Author ,is working as Lecturer in Jawaharlal Nehru Tehcnological Univesity Hyderabad. Areas of Specialization in
Environmental Science & Geomatics, Remote
Sensing & GIS, GPS.
IJSER © 2012 http://www.ijser.org