
International Journal of Scientific & Engineering Research Volume 4, Issue 2, February-2013 1
ISSN 2229-5518
Jamming and Lost Link Detection in Wireless
Networks with Fuzzy Logic
Héctor Iván Reyes and Naima Kaabouch
—————————— ——————————
HE state of the links is a major concern in wireless net- works. Wireless connectivity can be affected by unintend- ed phenomena such as multipath and propagation losses
as well as by intended interferences such as jamming. Specifi- cally, scatters and obstacles in the trajectory of the signal might cause fading and shading that can stop the delivery of real time packets to their final destination. Furthermore, if a network serves a critical mission, such as a military or law enforcement operation, it can be jammed; wich will stop it from accomplishing its mission.
In networks where the nodes require autonomy, such as sensor networks or unmanned vehicle networks, it is neces- sary to have a method to identify the state of the link so that if there is a problem, the network can autonomously fix it. An- other important requirement of this type of network is securi- ty. In order for a network to be secure it needs availability along with authentication, non-repudiation, and privacy [1]. Most of the research work related to network security has been dedicated to different aspects such as privacy [2] and authentication [3] [4]; however only few have been dedicated to the availability aspect [1]. Regarding availability, the focus has been mostly on jamming detection.
Most of the work related to jamming detection concentrates on jamming characterization of the network behavior under a jamming attack. For example, the work in [1] describes a tech- nique for detecting reactive jamming in IEEE 802.11p net- works based on the measurement of error distribution. The authors of this work calculate a correlation coefficient between the erroreous and correct reception times. If this coefficient is higher than an established threshold they conclude there is a
————————————————
Naima Kaabouch is an associate professor in the Electrical Engineering
Department at the University of North Dakota, USA. E-mail:
naima.kaabouch@engr.und.edu
jamming attack. In addition to the fact that this technique is not reliable, the authors only perform simulations using NS-2. Another example is the work in [5], where the authors used the changes in PDR (Packet Delivery Ratio) and SNIR (Signal to Noise Interference Ratio) to characterize the behavior of a small IEEE 802.11p network under jamming attack. In [6], the authors study the vulnerabilities of IEEE 802.11 a/b under RF interference, which are related to timing recovery and dynam- ic range selection. The research paper [7] presents how error behaves in IEEE 802.11b/g networks under RF jamming. They conclude that RF jamming affects more the OFDM scheme (802.11g) than the spread spectrum approach (802.11b).
The technique proposed in [8] uses Packet Delivery Ratio (PDR), Packet Sent Ratio (PSR), and Received Signal Strength (RSS). These metrics of the jammed node were compared with those of the other network nodes to detect and differentiate between various forms of jamming. However, this technique has several limitations. First, the complete process needs to be done by each node of the network; however the nodes might not be able to communicate and to exchange the necessary information for the comparison required by this method. An- other method presented in [9] uses three metrics: Bad Packet Ratio (BPR), Packet Delivery Ratio (PDR), and Energy Con- sumption Amount (ECA). In this method, if all the parameters are below the thresholds or if only PDR exceeds its threshold then there is no jammer, otherwise there is a jammer attacking the nodes. This technique also analyses the conditions of the other network nodes to reinforce the jamming detection pro- cess. The drawback of this technique is the burden of analyz- ing thresholds and exchanging acknowledgments among nodes, which is not possible when there is a loss of communi- cation as a result of jamming. The authors in [10] proposed a technique that employs the metrics Received Signal Strength (RSS) and Bit Error Rate (BER) to detect reactive jamming when BER is high even though the RSS is normal. This tech- nique can only detect a few types of jamming and does not identify other causes.
Since the methods exposed before focus mainly on detect- ing only jamming and not on assessing the general state of the link, we found necessary to propose a method for detecting
IJSER © 2013
International Journal of Scientific & Engineering Research Volume 4, Issue 2, February-2013 2
ISSN 2229-5518
the loss of the link and its cause in wireless networks. This paper continues as follows. In the next section, we present our approach by explaining the performance metrics we used and how we configured a Fuzzy Inference System for calculating the level jamming of the node. In this section we also explain a method for determining the state of the link and its possible cause. Then, we present and discuss the results of extensive simulations performed to test this method. Finaly, we present hardware tests done for supporting the simulations in verify- ing the functionality of the proposed approach.
The proposed technique uses fuzzy logic to conclude whether or not there is a link loss and its possible cause. The reason for using this type of logic instead of a bivalent and crisp logic is that the conditions of real environments in which systems op- erate are fuzzy rather than sharp. Fuzzy logic is helpful to ap- proximate system behavior where analytic functions either do not exist or are difficult to find. In the case of link loss detec- tion we face an environment with factors that behave com- plexly, such as jamming attacks, unintended interference, and radio wave propagation losses. This proposed technique uses
4 metrics: BPR, CCA (Clear Channel Assessment), RSS, and
PDR in order to evaluate the link status.
Although the transceivers provide some performance met-
rics, it is complicated to find an analytic relation between these
metrics to determine the status of the link. That is why fuzzy
logic is used to take advantage of empiric relations among the
metrics BPR, CCA, RSS, and PDR in order to evaluate the sta-
tus of the link.
BPR represents the percentage of received erroneous pack-
ages and is expressed as
Number of erroneous received packages.
occupied. CCA works at the MAC level and is provided by the transceiver. RSS is the power surrounding the receiver and is expressed in dBm. This metric is obtained from an RF power meter that can be either external or embedded in the trans- ceiver. The system uses RSS during the calculation of JI.
We chose to use BPR, PDR, CCA and RSS metrics for our system for several reasons. The main reason is that their val- ues change according to the state of the link and the environ- ment. The variations in only one of these parameters do not provide complete information; however, the analysis of the interactions between them can provide the status of the link state. Another important reason is that most transceivers and network interface cards possess diagnostic mechanisms that yield those metrics.
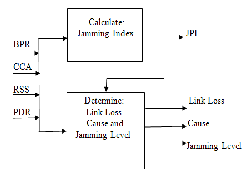
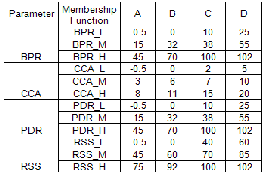
A Fuzzy Inference System (FIS) uses these parameters to compute a Jamming Index (JI). The FIS takes four variables, fuzzifies them by means of membership functions, applies the rules to obtain as many fuzzy sets as rules, and finally aggre- gates these fuzzy sets into one fuzzy set, which is the output. Since the output is a fuzzy set, it is necessary to extract a single number representing it. This process is called defuzzification. Although the intermediate process used fuzzy values, the sys- tem must decide using a defuzzified number [11]. JI is a crisp number coming from the defuzzification process that repre- sents how jammed the node is. Based on the values of JI, the proposed technique establishes if the link is either functioning normally or failing due to jamming attack or other causes. The FIS system uses trapezoidal membership functions to fuzzify the inputs and Mamdani inference method for the rules. There are three trapezoidal functions for each of the four inputs (PDR, BPR, CCA and RSS) that define the membership of these inputs to the low, medium, and high fuzzy sets. Figure 1 illustrates the structure of the proposed fuzzy logic system. Figure 2 illustrates the way the trapezoid functions are de- fined. The values of A, B, C, and D corresponding to each
BPR
.
Total number of received packages
(1)
membership function are given in table 1. Those values were estimated empirically and adjuated by tests. These points in- dicate the support, the boundaries and the core of the mem-
The receiver calculates this metric by verifying the Frame
Check Sequence (FCS) of the incoming packets at the MAC
level.
PDR represents the percentage of packages delivered to the
receiver successfully and is expressed as
bership functions. The support of the membership function is defined as the region of the universe with nonzero member- ship. The boundaries are regions of the universe that contain elements with nonzero membership but not complete mem- bership. The core is the region of the universe having complete membership [11]. The suffixes _L, _M, and _H indicate Low,![]()
PDR Number of
packages delivered correctly .
(2)
Medium and High level respectively. Each of the inputs has a
Total number of transmitted packages
This metric is calculated at the transmitter side by calculat- ing the ratio between the number of acknowledgment packets and the total number of transmitted packets. Let us recall that the receiver sends back an acknowledgment packet to the transmitter, each time it receives an error free packet.
CCA is a variable that is incremented by one each time the transmitter attempts to send a package and find the channel
membership function that is the combination of three trape- zoidal functions defined for low, medium and high levels. Figure 3 shows the combined membership function for the PDR metric.
IJSER © 2013 http://www.ijser.org
International Journal of Scientific & Engineering Research Volume 4, Issue 2, February-2013 3
ISSN 2229-5518
This method finds a point representing the centre of gravity of the curve representing the output fuzzy set. As mentioned before, JI is a crisp number obtained after defuzzification. The mathematical expression employed for the centroid method is Eq. (3)
JI
F
( z) zdz
,
(3)
Fig. 1 Block diagram of the Fuzzy Logic System
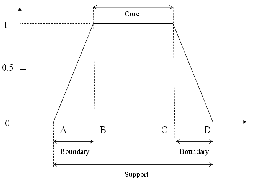
Fig. 2 Trapezoid membership function defining core, boundary and sup- port regions.
TABLE 1
VALUES A, B, C AND D OF TRAPEZOID FUNCTIONS CORRESPONDING TO EACH MEMBERSHIP FUNCTION
The defuzzification used for the FIS is the centroid method.
F ( z)dz
Where µF is the membership function that represents the out- put fuzzy set yield by the whole process and z is the universe Z. We define the universe to be between 0 and 100.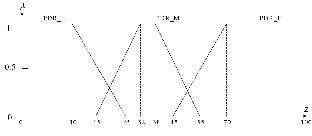
Fig. 3 Combined membership function for PDR
Another important component of the FIS is the set of rules. These set of rules were defined using the Comb method to avoid combinatorial explosion [12]. In this specific case, there are three (3) possible levels (High, Medium, and Low) defined as fuzzy sets and four (4) input variables that in a traditional fuzzy system would lead to 34= 81 different rules. This amount of rules demands a high processing time that hinders the reac- tion of the system. By using Comb method, it was possible to reduce this number to 3*4= 12 rules. The set of rules is defined as follows:
1. If BPR is low then JPI is low
2. Or if PDR is high then JPI is low
3. Or if CCA is low then JPI is low
4. Or if RSS is low then JPI is low
5. If BPR is med then JPI is med
6. Or if PDR is med then JPI is med
7. Or if CCA is med then JPI is med
8. Or if RSS is med then JPI is med
9. If BPR is high JPI is high
10. Or if PDR is low then JPI is high
11. Or if CCA is high then JPI is high
12. Or if RSS is high then JPI is high
To elaborate this set of rules, we investigated how jamming affects the metrics. Our experiments show that BPR and CCA both increase with jamming. Under a jamming attack RSS is either at a normal level or bigger than it is in regular condi- tions. On the other hand, PDR decreases with jamming. The results reported by literature support our observations. The authors in [13] [14] show how PDR deteriorates with jamming.
IJSER © 2013 http://www.ijser.org
International Journal of Scientific & Engineering Research Volume 4, Issue 2, February-2013 4
ISSN 2229-5518
Under high network congestion it can be 73%; however, in the presence of jamming it drops to 0%. The article [15] reports that CCA increases under a jammer attack. Additionally, au- thors of [8] [9] [16] affirm that jammers make BPR increase and also highlight how easy is to obtain this metric by check- ing the FCS. Regarding RSS, all the literature concludes that by itself this parameter does not provide valuable information when it comes to diagnosing the link; however, when com- bined with other metrics, RSS can tell if a dropping in PDR is due either to a jamming or to propagation loss. For example, if PDR is low but RSS is high, it is likely that there is jammer, on the other hand if RSS is normal or low, it indicates that the signal is being attenuated by the propagation media [17].
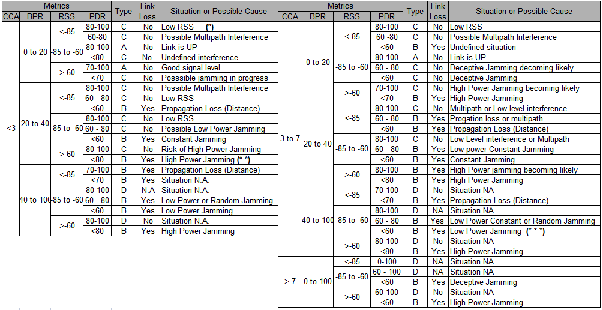
The proposed technique was built in Matlab. The FIS was con- figured by means of the Fuzzy Logic Toolbox of Matlab. This configuration included the definition of the membership func- tions using the graphical interface and the definition of the rules. The toolbox completed the operations of fuzzification of the input variables, application of the fuzzy operator (AND or OR) in the antecedent, implication from the antecedent to the consequent, aggregation of the consequents across the rules, and defuzzification. The FIS yields an output, JI, indicating the level of jamming. The algorithm also evaluates the status of the link in accordance with the values of the inputs CCA, BPR, RSS and PDR and following the combination of values shown in table 2. Specifically, the program first evaluates the value of CCA, and then it checks on BPR, RSS and PDR in strict order to determine the status of the link and the possible cause of this status. In the case of CCA>7, it skips BPR and goes direct- ly to verify the values of RSS and PDR. Additionally, the value of JI helps to corroborate the conclusion about the state of the link obtained from running the comparisons of table 2. For example, a link loss due to attenuation must be confirmed by a low JI. On the other hand, a link loss due to jamming is con- firmed with medium of high JI. The ranges for PDR, BPR, CCA and RSS depend upon the quality of service (QoS) and the tolerance to failures offered by a network. Concretely, the higher the QoS the more strict the ranges must be. For in- stance, in a network requiring QoS, a high PDR should be be- tween 95 and 100 whereas in a network with fewer require- ments, a high PDR could be between 80 and 100. The ranges in table 2 can be adjusted to finely tune the performance of the system. Table 2 illustrates the mapping between the ranges of the metrics and the state of the link and the cause. This table is similar to a tree where the root is CCA. We chose this variable because it is the most meaningful when it comes to indicate that there is interference or something delaying the access to the channel. We classify the situations in four different types. Type A groups the cases when the link is normal. Type B that the link is still working but it is likely that it fails. Type C comprehends the situations where the link is lost. Type D rep- resents situations that are not applicable. For instance, it is not likely to have Medium CCA, high BPR and high PDR at the same time. In the example indicated with (*) the CCA is low; therefore it is likely that there is no interference. The BPR is
medium and and PDR is HIGH that means the link is still working. However, the RSS is low. We classified this situation as type B since the RSS is low and there is a chance for a link loss to happen. In the example marked with (* *), although CCA is low, BPR is medium, and PDR low; therefore we con- sider that there is a link loss. The RSS is high, so we conclude that the link loss is due to a high power jamming attack. In the example indicated with (* * *), CCA is medium; therefore there must be some interference. We determine that there is a link loss because BPR is high and PDR is low. The same reasoning applies for the other situations.
We verified the effectiveness of the proposed system through software simulations and field tests. We did the simu- lations to verify that the program was working as expected and the field test to corroborate that the combinations of pa- rameters were appropriate for detecting the different states and situations of the link.
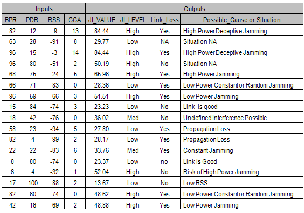
To perform the simulations, random values of BPR, PDR, CCA, and RSS are fed to the system. For every combination of PDR, CCA, and RSS, the system calculates the Jamming Index, determines the level of jamming (LOW, MEDIUM, or HIGH), and determines whether the link is lost or not as well as the possible cause of this loss. Examples of simulations results are shown in Table 3. This table shows different combinations of BPR, PDR, RSS and CCA, previously explained in the section Methodology, along with their corresponding outputs.
Results in the JI_VALUE column are produced by the fuzzy inference system, whereas the ones in the other three columns come from the subprogram that compares the inputs with pre- established threshold values following the rules defined in Table 2. “NA” and “Situation NA” outputs mean that the combinations of values (BPR, PDR, RSS, and CCA) yielding those results are unlikely to occur in a real situation. The col- umn JI_Value indicates the level of the node jamming. If the value of this output is high, this means that the node is close to the jammer. With this information, the communication system can start looking for other free channels. The gradient of JI_Value can indicate if the system is indeed being successful in its search. The exact mechanism to accomplish this new channel searching is out of the scope of this paper. The column Link_Loss indicates whether there is a link loss or not. This information is necessary to initiate some countermeasure to re- establish the link. Knowing the possible cause of the problem given by the last column of the table is important to determine the kind of action that needs to be taken. For example, if the link loss is due to propagation loss, the action is to increase the transmission power and receiver amplifier gain, but if the problem is caused by a jammer one possible action is to change the frequency. The information in table 3 is to be inter- preted by another program or system that controls the com- munication system.
IJSER © 2013 http://www.ijser.org
International Journal of Scientific & Engineering Research Volume 4, Issue 2, February-2013 5
ISSN 2229-5518
TABLE 2
RANGES OF VALUES USED BY THE PROGRAM TO DECIDE THE STATE OF THE LINK
In addition to simulations, we performed three different kinds of experiments in an open space. One type of experi- ment aimed to verify the efficiency of the system in detecting jamming. The other two types of experiments were to test the link loss detection due to attenuation and fading. For the
dBm. We counted the number of misdetections, false alarms and wrong situation to calculate the efficiency using the fol- lowing equation:
jamming detection test, we used the setup shown in figure 4. This figure illustates a network composed of transceivers Xbee connected to computers via USB acting as network nodes and![]()
Efficiency N m f r ,
N
(4)
a signal generator Hewlett Packard 8684C acting as a jammer.
TABLE 3
SAMPLE OF RESULTS OBTAINED FROM THE PRELIMINARY SOFT- WARE TEST WITH SIMULATED SITUATIONS EVALUATED WITH THE FUZZY LOGIC TECHNIQUE
A program running in each computer was used to send pack- ets to the other nodes and logged the status of the link along with the time and the possible cause of the link loss, when it applied, into an excel file. The program was the same used and tested through simulations. We used different levels of power for the jammer, specifically, -14 dBm, - 8 dBm, and 5
Where N represents the total number of simulated situations, m the number of misdetections, f represents the number of false alarms, and r represents the number of results with the wrong cause.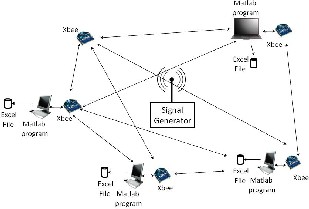
Fig. 4 Setup for constant and random jamming detection test
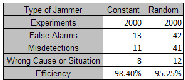
We performed 4000 experiments to test the jamming detec- tion performance whose results are shown in Table 4. As one can see, the efficiency is 98.4 % and 95.25% efficiency in detect- ing constant and random jamming, respectively. We noticed that the false detections occurred as soon as we changed the
IJSER © 2013 http://www.ijser.org
International Journal of Scientific & Engineering Research Volume 4, Issue 2, February-2013 6
ISSN 2229-5518
status of the jammer. One probable reason for the false detec- tions is that the program must take some time to calculate new metrics and make decisions. The time needed for that calcula- tion depends on the rate of packet transmission.
TABLE 4
RESULTS FOR THE FIELD TESTS
For the attenuation experiments, we set a two node net- work in an open space field. We gradually increased the dis- tance between nodes. We observed that when the distance between nodes was less than 97 meters the link worked nor- mally (UP) but with longer distances the program reported link loss (DOWN). We used a transmission power of 1mW. According to the manufacturer with that power the maximum range is 90 meters. Figure 5 shows the results of the test per- formed in the field. Every time the link was reported as DOWN the system gave “Propagation loss” as the cause for the link loss.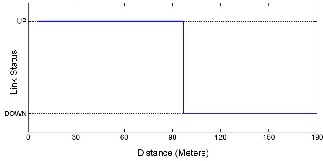
Fig. 5 Soccer Field Tests (Attenuation)
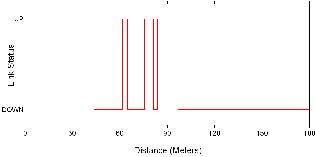
Fig. 6 Parking Lot (Multipath)
As a conclusion, the three different types of experiments al- lowed us to verify the effectiveness of the proposed system. The experiments showed that the system is able to detect link loss and determine if the cause was jamming, attenuation, or fading.
In this paper, we propose a fuzzy logic system that detects the loss of communication and identifies the possible cause. The system was implemented and extensively tested through sim- ulations and real experiments. In the field tests we obtained
98.4 % and 95.25% efficiency in detecting constant and random jamming respectively. The proposed technique is flexible enough to be implemented in other type of networks. Future work includes adding distance information to distinguish be- tween attenuation due to long distance and fading due to mul- tipath. Furthermore, the system will be tested using other types of jamming such as reactive jamming and deceptive jamming.
This work was supported by the ND EPSCoR grant # EPS-
0184442 as well as by the Rockwell Collins grant # UND0017909.
[1] A. Hamieh, J. Ben-Othman and L. Mokdad. "Detection of radio interference attacks in VANET". Presented at Global Telecommunications Conference,
2009. GLOBECOM 2009. IEEE. 2009. (Conference proceedings)
[2] M. Gerlach and F. Guttler. "Privacy in VANETs using changing pseudonyms- ideal and real". Presented at Vehicular Technology Conference, 2007. VTC2007-Spring. IEEE 65th. 2007. (Conference proceedings)
[3] K. Ren, T. Li, Z. Wan, F. Bao, R. H. Deng and K. Kim. "Highly reliable trust establishment scheme in ad hoc networks". Computer Networks Elsevier Volume 45, Issue 6, Pages 687–699, 2004. (Journal Paper)
[4] G. Theodorakopoulos and J. S. Baras. "Trust evaluation in ad-hoc networks".
Presented at Proceedings of the 3rd ACM Workshop on Wireless Security.
2004. (Conference Proceedings)
[5] O. Puñal, A. Aguiar and J. Gross. "In VANETs we trust?: Characterizing RF jamming in vehicular networks" Proceedings of the ninth ACM international workshop on Vehicular inter-networking, systems, and applications. pp. 83-
92. ACM 2012. (Conference Proceedings)
[6] R. Gummadi, D. Wetherall, B. Greenstein and S. Seshan. "Understanding and mitigating the impact of RF interference on 802.11 networks". Presented at ACM SIGCOMM Computer Communication Review. 2007. (Conference Proceedings)
[7] T. Karhima, A. Silvennoinen, M. Hall and S. G. Haggman. "IEEE 802.11 b/g wlan tolerance to jamming". Presented at Military Communications Confer- ence, 2004. MILCOM 2004. IEEE. 2004. (Conference Proceedings)
[8] W. Xu, W. Trappe, Y. Zhang and T. Wood. "The feasibility of launching and detecting jamming attacks in wireless networks ". Presented at Proceedings of the 6th ACM International Symposium on Mobile Ad Hoc Networking and Computing. 2005. (Conference Proceedings)
[9] M. Çakirolu and A. T. Özcerit. "Jamming detection mechanisms for wireless sensor networks". Presented at Proceedings of the 3rd International Confer- ence on Scalable Information Systems. 2008. (Conference Proceedings)
[10] M. Strasser, B. Danev and S. Capkun. "Detection of reactive jamming in sensor networks ". Month 8(634), pp. 14. 2009. (Journal Paper)
[11] T. J. Ross and University of New Mexico. "Fuzzy Logic with Engineering
Applications".Third Edition 2010. (Book)
[12] W. E. Combs and J. E. Andrews. "Combinatorial rule explosion eliminated by
IJSER © 2013 http://www.ijser.org
International Journal of Scientific & Engineering Research Volume 4, Issue 2, February-2013 7
ISSN 2229-5518
a fuzzy rule configuration ". Fuzzy Systems, IEEE Transactions on 6(1), pp. 1-
11. 1998. (Journal Paper)
[13] K. Pelechrinis, M. Iliofotou and V. Krishnamurthy. "Denial of service attacks in wireless networks: The case of jammers ". Communications Surveys & Tu- torials, IEEE (99), pp. 1-13. 2010. (Journal Paper)
[14] W. Xu, K. Ma, W. Trappe and Y. Zhang. "Jamming sensor networks: Attack and defense strategies ". IEEE Networks vol.20, no.3, pp. 41-47, 2006. (Journal Paper)
[15] A. D. Wood, J. A. Stankovic and G. Zhou."DEEJAM: Defeating energy- efficient jamming in IEEE 802.15. 4-based wireless networks". Presented at Sensor, Mesh and Ad Hoc Communications and Networks, 2007. SECON'07.
4th Annual IEEE Communications Society Conference on. 2007. (Conference
Proceedings)
[16] S. Misra, R. Singh and S. Mohan. "Information warfare-worthy jamming attack detection mechanism for wireless sensor networks using a fuzzy infer- ence system". Sensors 10(4), pp. 3444-3479. 2010. (Journal Paper)
[17] H. Reyes, N. Kaabouch, W. Semke and S. Salle, "Fuzzy logic method for link
loss detection during unmanned aerial vehicle flights," in Infotech@Aerospace
2012, Garden Grove, California, 2012. (Conference Proceedings)
IJSER © 2013 http://www.ijser.org