International Journal of Scientific & Engineering Research, Volume 3, Issue 7, July-2012 1
ISSN 2229-5518
Iterative Switching Filter for High Density Noise
Removal
Jisha John, Ann Mary Jacob, Mekha Prasannan, Priyanka Suja Pradeep, Sruthi Ignatious
Abstract— This paper proposes an efficient filter for the restoration of images that are corrupted by high dens ity of impulse noise. In this method an iterative switching filter is used that switches between two cases depending on the noise percentage in the input image. For low noise percentage it searches for the noise-free pixels within a small neighborhood. The noisy-pixel is then replaced with the average estimated from noise-free pixels. For high noise percentage weighted median is used to replace the corrupted pixels. The iterative process continues until all noisy-pixels of the corrupted image are filtered. The proposed filtering method is tested using standard test images and found to be more efficient than already existing high density noise removal techniques.
Index Terms— Salt-and-pepper Noise; noise-free pixel; Iterative Swiching Filterr; Noise Adaptive Weighted Switching Median Filter.
—————————— ——————————
OISE is a factor affecting the image, which is mainly produced in the processes of image acquisition, storage and transmission, thereby degrading the quality of im-
ages; therefore a common problem in applied science and en- gineering is the restoration of the corrupted images included in the image. Image filtering not only improves the image quality but also is used as a pre-processing stage in many ap- plications including image encoding, pattern recognition, im- age compression, etc.There are many methods for removal of impulse noises from the images. Usage of linear filters such as averaging filters produces blurring of the images. Non linear filters such as median filters are the most popular technique for removing impulse noise because of its good denoising power and computational efficiency. However most of the median filters are implemented uniformly across the image and thus tend to modify both noisy and noise free pixels. Con- sequently the effective removal of impulse noise is often ac- complished at the expense of blurred and distorted features thus removing fine details in the image.
Switching median filters are shown to be simple and yet more effective than uniformly applied methods such as median filters [1] [2]. There are different methods for impulse noise detection: fuzzy approaches [4-6], neural approaches [7] and boundary based approaches [8]. Among the three catego- ries boundary based approach [8] is preferred due to its sim- plicity compared to computational complexity and system structure of other two categories. The filtering window size is chosen adaptively and depends on the percentage of noise that corrupts the image[9].
————————————————
![]() Ann Mary Jacob,Mekha Prasannan, Priyanka Suja Pradeep,
Ann Mary Jacob,Mekha Prasannan, Priyanka Suja Pradeep,
Sruthi Ignatious, Btech Student Department of Information
Technology, Mar Baselios Engineering College, Nalanchira,
Trivandrum, Kerala, India.
The initial filtering window size is taken as 3×3 and maximum window size is chosen depending on the percen- tage of noise that corrupts a local region around the detected noisy pixel in the image. The noisy pixels are replaced by the weighted median value of uncorrupted pixels in the filtering window.
In the proposed method an iterative switching filter is proposed which gives better performance measures when compared to other existing methods and for high density noi- sy images it preserves the edges and finer details of the image. Section II explains the proposed method and the algorithm for implementation. Performance analysis is done in Section III while the result analysis and comparison is done in Section1V.
The noise removal technique as proposed in Iterative Switch- ing Filter is capable of removing high density of impulse noise effectively while preserving the fine image details for low noise density images while for high noise density images the fine details can be retrained. The different stages in this filter- ing process are the following:-
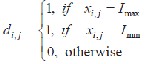
In this step, the detection map is constructed from the input noisy image X[3]. In case of salt-and-pepper noise, the maxi- mum and the minimum intensity values of the image dynamic range [Imax, Imin] provide information about the corrupted pixels .The detection map is computed from the noisy image as follows:
The entries of “1” and “0” in the detection map D represent the noisy and the noise-free pixels, respectively. This map pro- vides useful information about the noise intensity in the cor- rupted image.
IJSER © 2012
\International Journal of Scientific & Engineering Research, Volume 3, Issue 7, July-2012 2
ISSN 2229-5518
Inorder to process the image the noise density present in the image should be identified. The filtering is done based on this value. The calculation of noise density p, for a local window K×K is given as shown below:
In this proposed filter method there are two cases. Depending on the noise density the filter switches between the two cases. For noise density less than or equal to 40% the noisy pixel is replaced with the average of the noise free pixels in the 3X3 window. For higher noise density the corrupted pixel is re- placed with the weighted median of the pixel is replaced with the weighted median of the uncorrupted pixels. The weight assign is 3.This filtering process is continued until all the noisy pixels have been removed.
2.4 Proposed Algorithm
The proposed iterative switching filter the noise density in the input image is identified. A detection map is created which is a binary matrix of zeros and ones where the noisy pixels in the input image are represented as ones and noise free as ones. Depending on the noise density either average of the noise free pixel is found and replaces the noisy pixel otherwise weighted median is found and replaces the noisy pixel.
Noise density= (sum of the uncorrupted pixels of detection map)/size of D.
(i) Consider each pixel, Pi,j for processing.
(ii) If Pi,j is noisy go to step 6 otherwise go to step 4.
(iii)Consider the 3X3 neighbourhood of the pixel and construct
a vector R which contains the uncorrupted pixels.
(iv): If the noise density is less than or equal to 40% go to step
10 otherwise go to step 13.
(v) Compute the estimate which is the average of vector R and
assign it to G(I,j).
(vi): If the number of uncorrupted pixels is greater than or
equal to 3 go to step 9 otherwise go to step 13. (vii): Compute G(I,j) as the weighted median of R.
3 PERFORMANCE MEASURE
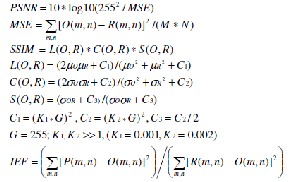
The performance of the restoration quantified using peak sig- nal-to-noise ratio (PSNR), structured similarity index (SSIM) and image enhancement factor (IEF), is defined as follows. The method has been compared with the NAWSM [4] and is found to give better results for the various performance meas- ures. For high density noisy images such as 90% noise the re- sultant image preserves the edges and finer details in the re- sultant image.
where O is the original Image, R is the restored image, P is the corrupted image, MSE is the mean square error, M × N is the size of the image, L is the luminance comparison, C is the contrast comparison, S is the structure comparison, μ is the mean and σ is the standard deviation.
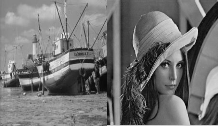
The performances of both filters have been evaluated qualita- tively and quantitatively through experimental analysis. Al- though extensive simulations were carried out using standard test images, only performance evaluation using images such as Lena image of size 512×512, Boat image of size 512 x 512 are explained in this section.
IJSER © 2012
International Journal of Scientific & Engineering Research, Volume 3, Issue 7, July-2012 3
ISSN 2229-5518
(a) (b)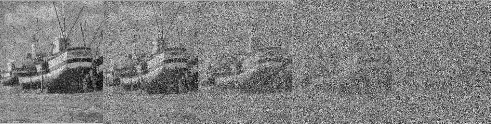
Figure 1. Standard test image of (a) BOAT, (b) LENA
(a) (b) (c) (d) (e) Figure 1. Images corrupted with salt-and-pepper Noise(a)with 20%, (b) with (40%),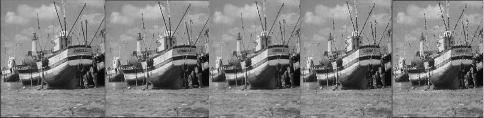
(c)with 60%, (d) with 80% ,(e)with 90%
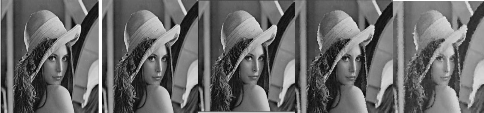
(a) (b) (c) (d) (e) Figure 2.(a)-(e) Results after the NAWSMF filtering for the respective noisy images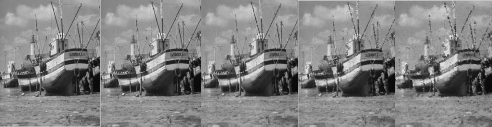
(a) (b) (c) (d) (e) Figure 3.(a)-(e) Results after the ISF filtering for the respective noisy images
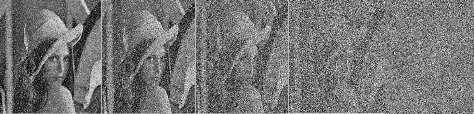
(a) (b) (c) (d) (e) Figure 4. Images corrupted with salt-and-pepper Noise(a)with 20%, (b) with (40%),
(c)with 60%, (d) with 80% ,(e)with 90%
IJSER © 2012
\International Journal of Scientific & Engineering Research, Volume 3, Issue 7, July-2012 4
ISSN 2229-5518
(a) (b) (c) (d) (e) Figure 5 .(a)-(e) Results after the NAWSMF filtering for the respective noisy images
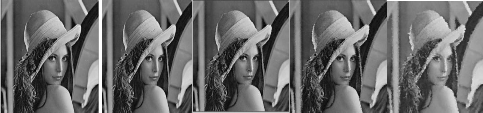
(a) (b) (c) (d) (e) Figure 6 .(a)-(e) Results after the ISF filtering for the respective noisy images
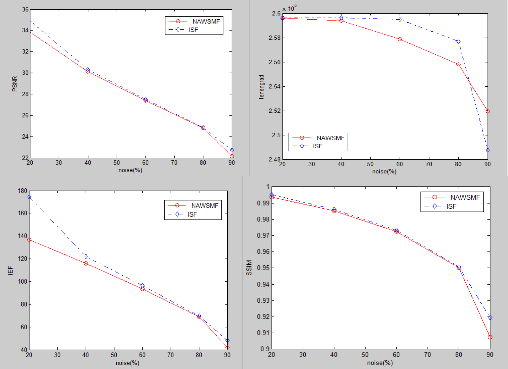
Table 1.Peformance comparison for the BOAT image corrupted with various Noise Density
Noise (%) | Tenengrad | PSNR | SSIM | IEF | ||||
Noise (%) | ISF | NAWSMF | ISF | NAWSMF | ISF | NAWSMF | ISF | NAWSMF |
20 | 259648 | 259593 | 34.8716 | 33.8250 | 0.9951 | 0.9938 | 174.3444 | 137.0092 |
40 | 259646 | 259373 | 30.3228 | 30.1078 | 0.9861 | 0.9853 | 121.9887 | 116.0960 |
60 | 259499 | 257868 | 27.5208 | 27.3871 | 0.9733 | 0.9723 | 96.3149 | 93.3949 |
80 | 257686 | 255801 | 24.8644 | 24.8174 | 0.9506 | 0.9500 | 69.5014 | 68.7536 |
90 | 248762 | 251933 | 22.7228 | 22.1543 | 0.9194 | 0.9075 | 47.8093 | 41.9427 |
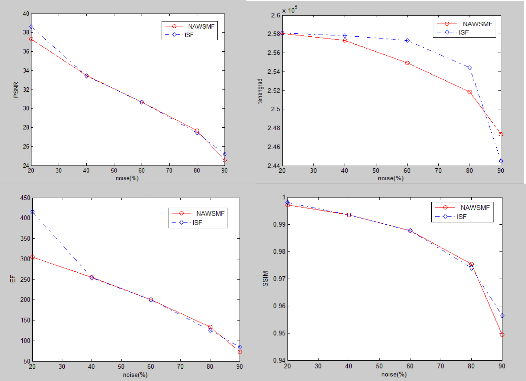
Table 2.Peformance comparison for the LENA image corrupted with various Noise Density
Noise (%) | Tenengrad | PSNR | SSIM | IEF | ||||
Noise (%) | ISF | NAWSMF | ISF | NAWSMF | ISF | NAWSMF | ISF | NAWSMF |
20 | 258087 | 258068 | 38.6426 | 37.2887 | 0.9981 | 0.9973 | 416.0056 | 304.5838 |
40 | 257803 | 257324 | 33.4470 | 33.4533 | 0.9936 | 0.9936 | 254.3767 | 254.7427 |
60 | 257287 | 254940 | 30.6749 | 30.6845 | 0.9878 | 0.9878 | 199.7483 | 200.1892 |
80 | 254393 | 251840 | 27.4158 | 27.6603 | 0.9741 | 0.9755 | 125.9112 | 133.2042 |
90 | 244502 | 247354 | 25.1705 | 24.5471 | 0.9565 | 0.9496 | 84.0864 | 72.8421 |
The performance measure (PSNR) of ISF is comparatively greater than that of NAWSMF. For 90% noisy image, ISF method preserves the finer details and edges of the image. The tenengrad value of ISF from the above tables is greater than that of NAWSMF. From these values also we can conclude that ISF method preserves the edges of the image efficiently. The performance measures, IEF and SSIM are also shown in the tables.
IJSER © 2012
\International Journal of Scientific & Engineering Research, Volume 3, Issue 7, July-2012 4
ISSN 2229-5518
IJSER © 2012
\International Journal of Scientific & Engineering Research, Volume 3, Issue 7, July-2012 4
ISSN 2229-5518
[1] Civicioglu, P.: Using Uncorrupted Neighbourhoods of the Pixels for Impulsive Noise Suppression with ANFIS. IEEE Transactions on Image Processing 16(3) (March 2007)
[2] Nair, M.S., Revathy, K., Tatavarti, R.: An Improved Deci- sion-Based Algorithm for Impulse Noise Removal. In: In- ternational Congress on Image and Signal Processing -CISP
2008, vol. 1, pp. 426–431. IEEE Computer Society Press,
Los Alamitos (2008),doi:10.1109/CISP.2008.21
[3] Abdul Majid, Muhammad Tariq Mahmood:A novel tech- nique for removal of high density impulse noise from digi- tal images.In 2010 6thInternational Conference on Emerg- ing Technologies(ICET)
[4] Madhu S. Nair and P.M. Ameera Mol: Noise Adaptive Weighted Switching Median Filter for Removing High Density Impulse Noise
[5] Luo, W.: Eficient removal of impulse noise from digital images. IEEE Transaction on Consumer Electronics 52(2),
523–527 (2006)
[6] Schulte, S., Nachtegael, M., Witte, V.D., Weken, D.V., Kerre, E.E.: A Fuzzy Impulse Noise Detection and Reduc- tion Method. IEEE Transactions on Image Processing
15(5),
1153–1162 (2006)
[7] Schulte, S., Witte, V.D., Nachtegael, M., Weken, D.V., Kerre, E.E.: Fuzzy Two-Step Filter for Impulse Noise Re- duction From Color Images. IEEE Transactions on Image Processing 15(11), 3567–3578 (2006)
[8] Nair, M.S., Raju, G.: A new fuzzy-based decision algorithm for high-density impulse noise removal. Signal Image and Video Processing, doi:10.1007/s11760-010-0186-4
[9] Ng, P.-E., Ma, K.-K.: A Switching Median Filter with Boundary Discriminative Noise Detection for Extremely Corrupted Images. IEEE Transactions on Image Processing
15(6), 1506–1516 (2006).
IJSER © 2012