Reduce Reduce reuse(RDF)
Biomedical Biomedical
Vermi Composting
International Journal of Scientific & Engineering Research Volume 2, Issue 3, March-2011 1
ISSN 2229-5518
Integer Programming Model for Integrated Planning of Solid Waste Management in Jaipur
Archana Gupta, D. C. Sharma
aharaja Jai Singh second founded Jaipur city in the year 1728.It is a uniquely planned city
with rich architectural heritage which attract to
foreign tourist and known as the “Pink city”. But environment degradation and lack of basic amenities threaten its viability. Solid waste management system of a city has vital role on quality of life. As per 2001 census the population of Jaipur city was 23 lacks approx. and as per Jmc’s figure it will increase by the rate of 2.8% per annum so the present population of Jaipur in 2010 is 29 ,25,663.It is observed that bigger the size of the city (population and density wise) , greater is the quantity of waste generated. As per information received from various sources, Jaipur city generates 1000-1100 MT of waste per day. There by usual everyday practice maximum solid waste goes in to dumping sites without any recycling and separation process. On an average more than 60% of the population disposed off their solid waste on streets, open spaces, drains, lanes, and storm water drainage. The system has resulted
unhygienic conditions in the city.
Presently we have only one RDF plant based on BOOT basis by ms.Grasim India Ltd. At Lagadiyawas, one bio-medical treatment plant at Khorarupadi on PPP run by Instromedics India private Ltd. And two open dumping spaces located at mathuradaspura and Sevapura sites. As per gathered information approximate 15% of total waste is used in RDF plant without segregation but it is not in everyday practice. The quantity of bio- medical waste expected to be generated 4 to 4.5MT in which approx.800kg.glassware has to be disinfected chemically, and only 0.15 MT is autoclaving and about 2.8 MT burned and disposed off at the site of plant. In Jaipur proper sanitary landfill has not been developed but one is under construction process at Lagadiyawas. Not proper plannining of collection and transportation method followed. Some time the collected waste of some wards goes to transfer station some time it will go to any dumping sites either sevapura or mathuradaspura.
So presently approx. 600-650 Ton/day of waste is crudely dumped at mathuradaspura dumping sites and 400-450 Tons/day at sevapura dumping sites without segregation and reuse.
So Proper planning and scheduling must be required in the present situation and we have to think with increasing emphasis on resource recovery of useful commodities from the waste (recycling), utilization of waste as a substitute for
fuel in power plant , composting and other
IJSER © 2011 http://www.ijser.org
International Journal of Scientific & Engineering Research Volume 2, Issue 3, March-2011 2
ISSN 2229-5518
advance technologies. In this paper our aim is to suggest the better way to improve the present system by implementing some changes in collection and transportation method, by applying segregation method, and empirically establish the existence of economics of scale for vermicular compost plant, recycling plant, mechanical compost plant, incinerator and one more sanitary landfill. So proposed model is used as an effective tool for efficient management when planner has made decision regarding political, social, and other practical aspects of the problem which are difficult to quantify. In our scientific optimization model we have total two transfer stations. MSW from a specific region should be firstly collected at different nodes, and by choosing suitable roots must be sent to a transfer station, then there it will sorted out by workers and allocated to various
waste treatment plants like mechanical compost plant, vermicular compost plant RDF plant, recycling, incinerator or landfills. Biomedical waste should be collected from all hospitals, dispensaries, clinics and diagnostic centers and directly sent to bio- medical treatment plant. With these versatile programming techniques, different waste diversion rates under multiple policy scenario and complex uncertainties could be analyzed which will be very helpful to reduce quantity of disposal waste in a better economic and more sustainable way.
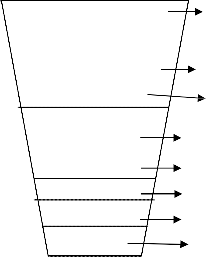
The current practice MSWM in all urban centers of the country is biased towards achieving 100% collection and its subsequent disposal with partial or no treatment/processing. Therefore an urgent need to shift the paradigm from open cycle to close
cycle of waste. (given in fig 1.)
Reduce Reduce reuse(RDF)
Biomedical Biomedical
Vermi Composting
Incineration
Incinerator RDF plant
Recycling
Landfall Mechanical compost
Landfill
(Present)
(Future)
This section describes the mathematical formulation of the integer linear programming model for integrated waste management planning. The model has been built upon the following assumptions.
1. Waste nodes are located at the centers of waste generating areas.
2. Waste separation is done at transfer stations.
3. All the proposed plants in the model are situated near landfill sites so that transportation cost of inert material transported from these plants to landfill is negligible.
IJSER © 2011 http://www.ijser.org
International Journal of Scientific & Engineering Research Volume 2, Issue 3, March-2011 3
ISSN 2229-5518
Xit1, Xjt2, i=1, 2…5, j=1…4:- respectively total number of trips made by dumpers to carry waste from node i to transfer station at t1 and from node j to transfer station at t2.
xit1, xjt2, , i=1,2…5, j=1,…4:- respectively total number of dumpers used everyday to carry waste from node i to transfer station at t1 and from node j to transfer station at t2.
Yt1r, Yt1m, Yt1s, Yt1f1, Yt2n, Yt2v, Yt2f2:- respectively total number of trips made by dumpers to carry waste from transfer station at t1 to R.D.F. plant at r, mechanical compost plant at m, recycling plant at s, landfill at f1 and from transfer station at t2 to incinerator at n, vermicular compost plant at v, landfill at f2.
yt1r, yt1m, yt1s, yt1f1, yt2n, yt2v, yt2f2:- respectively total number of dumpers used everyday to carry waste from transfer station at t1 to R.D.F. plant at r, mechanical compost plant at m, recycling plant at s, landfill at f1 and from transfer station at t2 to incinerator at n, vermicular compost plant at v, landfill at f2.
Krf1, Kmf1, Ksf1, Knf2, Kvf2:- respectively total number of trips made by dumpers to carry waste from R.D.F. plant at r, mechanical compost plant at m, recycling plant at s, to a landfill at f1 and from an incinerator at n, vermicular compost plant at v, to a landfill at f2.
krf1, kmf1, ksf1, knf2, kvf2:- respectively total number of dumpers used everyday to carry waste from R.D.F. plant at r, mechanical compost plant at m, recycling plant at s, to a landfill at f1 and from an incinerator at n, vermicular compost plant at v, to a landfill at f2.
Po: - number of trips made by special vehicles which collect the waste from all hospitals, dispensaries, clinics, and diagnostic centers of city to carry biomedical waste to biomedical treatment plant.
po: - number of special vehicles used to carry biomedical waste from all hospitals, dispensaries, clinics, and diagnostic centers of city to biomedical treatment plant.
Zr, Zm, Zs, Zn, Zv, Zo , Zf1, Zf2:- 0-1 variables indicate respectively, the presence of RDF plant at r, mechanical compost plant at m, a recycling plant at s, an incinerator at n, vermicular compost plant at v, bio-medical treatment plant at o and landfills at f1and f2.
Wr, Wm, Ws, Wn, Wv, Wo, Wf1, Wf2:- amount of waste transported everyday respectively, to a RDF plant at r, mechanical compost plant at m, a recycling plant at s, an incinerator at n, vermicular compost plant at v, bio-medical treatment plant at o and landfills at f1and f2.
D1 , D2 : -respectively total numbers of dumpers used and special vehicle used for biomedical
waste everyday.
ait1, ajt2, i=1, 2…5, j=1…4:- expected number of trips respectively made by dumpers per day to carry waste from node i to transfer station at t1 and from node j to transfer station at t2.
bt1r, bt1m, bt1s, bt1i1, bt2n, bt2v, bt2i2:- expected number of trips respectively made by dumpers per day to carry waste from transfer station at t1 to R.D.F. plant at r, mechanical compost
plant at m, recycling plant at s, landfill at i1 and from transfer
station at t2 to incinerator at n, vermicular compost plant at v, landfill at i2.
Ari1, Ami1, Asi1, Ani2, Avi2:- expected number of trips respectively made by dumpers per day to carry waste from R.D.F. plant at r, mechanical compost plant at m, recycling plant at s, to a landfill at i1 and from an incinerator at n, vermicular compost plant at v, to a landfill at i2.
a:- capacity (in tons) of a dumper.
IJSER © 2011 http://www.ijser.org
International Journal of Scientific & Engineering Research Volume 2, Issue 3, March-2011 4
ISSN 2229-5518
Cit1, Cjt2, i=1, 2…5, j=1…4:- respectively transportation cost from node i to transfer station at t1 and from node j to transfer station at t2.
dt1r, dt1m, dt1s, dt1U1, dt2n, dt2v, dt2U2:- respectively transportation cost from transfer station at t1 to R.D.F. plant at r, mechanical compost plant at m, recycling plant at s, and a landfill at i1 and from transfer station at t2 to incinerator at n, vermicular compost plant at v, and a landfill at i2.
ho:-transportation cost of special vehicles which collect the waste from all hospitals, dispensaries, clinics, and diagnostic centers of city.
Cr, Cm, Cs, Cn, Cv, Co :- revenue respectively per unit of waste from a RDF plant at r, mechanical compost plant at m, a recycling plant at s, an incinerator at n, vermicular compost
plant at v, bio-medical treatment plant at o.
Objective function represents the overall daily management cost.
The first component (F1) gives the total of transportation cost i.e. Transportation cost from nodes i=1,…5 to transfer station at t1 + transportation cost from nodes j=1,…4 to transfer station at t2 +transportation cost from transfer stations at t1 and t2 to either at any treatment plant or to a landfill sites at i1and i2 respectively + transportation cost of special vehicles used to collect biomedical waste. The second component (F2) gives the investment and handling expenses. The third component (F3) gives the total cost for buying all dumpers and special vehicles for bio-medical waste. The fourth component (B) gives the benefits at plants owing to the production at different plant.
5 4 l
F1 (X,Y) Cit1 Xit1 Cjt 2 X jt 2 dt1r Yt1r dt1m Yt1m dt1s Yt1s
f1, f2 :-respectively cost of buying dumpers and special vehicle
i 1
j 1
t1r t1m t1s
dt1 1 Yt1 1 dt 2n Yt 2n dt 2v Yt 2v dt 2 2 Yt 2 2 ho Po
for bio medical waste.
t1 1
t2n t 2v t 2 2 o
1, 2 :- are respectively total amount of waste at transfer stations at t1 and t2.
F2 Z, w Z
w Z
w Z
[1]
w
r r r
r r m m m
m m s s s s s
r, m, s, n, v, o :- fraction of unrecovered waste respectively
Z w
n n n n v v v v 1 1
Z w
n
Z w
v
1 1
1
at RDF plant at r, mechanical compost plant at m, a recycling
Z w Z
w
plant at s, an incinerator at n, vermicular compost plant at v, bio-medical treatment plant at o.
2 2 2
2 2
o o o o o
Qr, Qm, Qs, Qn, Qv, Qo , Qi1, Qi2:-capacity per day respectively for a RDF plant at r, mechanical compost plant at m, a recycling plant at s, an incinerator at n, vermicular compost plant at v,
bio-medical treatment plant at o and landfills at i1and i2.
F3 x, y, k f l D1 f 2 D2
[2]
[3]
ar, am, as, an, av, ao , ai1,ai2:-respectively fixed cost incurred in opening a RDF plant at r, mechanical compost plant at m, a recycling plant at s, an incinerator at n, vermicular compost plant at v, bio-medical treatment plant at o and landfills at i1and i2.
�r, �m, �s, �n, �v, �o , �i1,�i2:-respectively variable cost incurred in handling a RDF plant at r, mechanical compost plant at m, a recycling plant at s, an incinerator at n, vermicular compost plant at v, bio-medical treatment plant at o and landfills at i1and i2.
B w Cr 1 pr wr Cm 1 pm wm Cs 1 ps ws
r m s
Cn 1 pn wn Cv 1 pv wv Co 1 po wo n v o
[4]
So the objective function F to be minimizes is
IJSER © 2011 http://www.ijser.org
International Journal of Scientific & Engineering Research Volume 2, Issue 3, March-2011 5
ISSN 2229-5518
Total waste moved from each waste collection points i=1,…5 and j=1,…4 should at least be equal to
the total amount of waste at that point.
In constraint (14) amount of waste collected from all hospitals
, dispensaries, clinics, and diagnostic centers should at least be equal to the amount of waste found at that point.
5
X it1
i 1
4
X jt 2 t1
j 1
t 2
[6]
po wo Po
[14]
In constraints (7) and (8) amount of waste carried from transfer stations at t1 and t2, to different plants should at least be equal to the amount of waste found at that point.
In constraint (15)-(20) the maximum capacity for processing plants are accounted means amount of waste taken to different plants should not exceed the plant capacities. In constraints
(21) and (22) same thing is done for sanitary landfills i1and
t1r
t 2r
Yt1r
Yt 2r
t1m
t 2 m
Yt1m
Yt1m
t1s
t 2 s
Yt1s
Yt 2 s
t1 1
t 2 2
Yt1 1 dt1
[7]
Yt 2 2 dt 2
[8]
i2.
Wr < Qr Zr [15]
Wm < Qm Zm [16]
In constraints (9) – (13) amount of waste carried away from every plant to landfills i1and i2 should at least be equal to amount of waste found at that point.
Ws < Qs Zs [17]
p r wr
p m wm p s ws p n wn
pv wv
K r 1
K m 1
K s 1
K n 2
K v 2
[9] [10] [11]
[ 12]
[13]
Wn < Qn Zn [18] Wv < Qv Zv [19] Wo < Qo Zo [20] Wi1 < Qi1 Zi1 [21] Wi2 < Qi2 Zi2 [22]
IJSER © 2011 http://www.ijser.org
International Journal of Scientific & Engineering Research Volume 2, Issue 3, March-2011 6
ISSN 2229-5518
Constraints (23)-(34) means that, once the flow to either plant or sanitary landfill is positive that plant or landfill must exist. In constraint (35) same thing is done for bio-medical waste.
a Yt1rg < Qr Zr [23]
a Yt1mg < Qm Zm [24]
Yt1r, Yt1m, Yt1s, Yt1i1, Yt2n, Yt2v, Yt2i2 are integers and 2:0
Variables in (36)-(43) are defined as Boolean. These are used to determine existence of either plant or a landfill.
Zr {0, 1} [36]
a Yt1sg a Yt1i1g | < < | Qs Zs Qi1 Zi1 | [25] [26] | Zm |
| {0, 1} | [37] |
Zs |
| {0, 1} | [38] | ||||
a Yt2ng < | Qn Zn | [27] | |||||
Zn |
| {0, 1} | [39] | ||||
a Yt2vg < | Qv Zv | [28] | Zv |
| {0, 1} | [40] | |
a Yt2i2g < | Qi2 Zi2 | [ 29] | Zo |
| {0, 1} | [41] |
a Kri1g < Qi1 Zi1 [30] a Kmi1 < Qi1 Zi1 [31] a Ksi1g < Qi1 Zi1 [32] a Kni2g < Qi2 Zi2 [33] a Kvi2g < Qi2 Zi2 [34]
a Pog < Qo Zo [35]
All the variables are integers and positive.
i.e., Xit1, Xjt2, are integer, i=1,…5, j=1,…4 and 2: 0
Zi1 {0, 1} [42]
Zi2 {0, 1} [43]
In definition (44)-(57) which were already mentioned in the beginning gives the expected number of trips made by dumpers per day from waste nodes i=1,…,5 and j= 1,…,4 to transfer stations t1 and t2, and from transfer stations at t1 and t2 to different plants and landfills are given.
Xit1 = ait1 xit1 I = 1,…, 5 [44] Xjt2 = ajt2 xjt2 I = 1,…, 4 [45]
Yt1r = bt1r yt1r [46]
IJSER © 2011 http://www.ijser.org
International Journal of Scientific & Engineering Research Volume 2, Issue 3, March-2011 7
ISSN 2229-5518
Yt1m | = | bt1m yt1m | [47] | Wn Wv | = = | I a Yt2n I a Yt2v | [61] [62] |
Yt1s | = | bt1s yt1s | [48] | Wi1 | = | I a Yt1i1 | [63] |
Yt2n | = | bt2n yt2n | [49] | Wi2 | = | I a Yt2i2 | [64] |
Yt2v | = | bt2v yt2v | [50] | Wo | = | I a Po | [65] |
Yt1i1 = bt1i1 yt1i1 [51]
Yt2i2 = bt2i2 yt2i2 [52]
Equations (66)-(67) indicates the amount of waste disposed of in a sanitary landfills i1and i2, everyday. Equation (68) gives total amount of waste collected from all waste sources per day. (This excluded waste generated from plants.)
Kri1 = Ari1 kri1 [53]
Kmi1 = Ami1 kmi1 [54]
� 1 W 1
� 2 W 2
K r 1
r
K n 21
n
K m 1
m s
K v 2
v
K s 1 [66] [67]
W W W W W W W W W
Ksi1 = Asi1 ksi1 [55]
r m s n v
r m s n v
1 2 o
1 2 o
[68]
Kni2 = Ani2 kni2 [56]
Equation (69) gives the total number of dumpers and
Special vehicles used per day are determined.
Kvi2 = Avi2 kvi2 [57]
D
Definitions (58)-(62) indicates the amount of waste transported from transfer stations at t1 and t2 to processing
5
xit1
i 1
yt 2 n
4
x jt 2
j 1
y t 2 v
t1r
yt1r
yt 2 2
t1m
y t1m
p o
t1 s
y t1s
t1 1
yt1 1
plants, while definitions (63) and (64) gives the amount of
t 2 n
t 2 v
t 2 2 o
[69]
waste transfer to landfills at i1and i2.equation (65) gives
amount of waste collected from all hospitals, dispensaries, clinics and diagnostic centers and send to bio-medical treatment plant
Wr = I a Yt1r [58] Wm = I a Yt1m [59]
Ws = I a Yt1s [60]
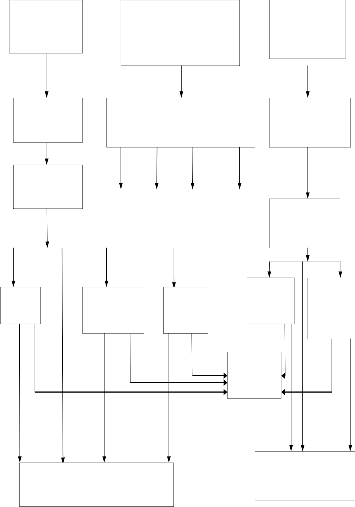
Jaipur is divided in eight Zones having 77 wards.Zonewise quantity of waste generated per day in Jaipur is given in figure (3). In our model we have two transfer stations, First at Delhi road near meena petrol pump (t1) and second at Zalana
(t2) and two landfill sites, first at Lagadiyawas (i1) and second
at Sevapura(i2). RDF plant (r) , mechanical compost plant (m),
and recycling plant (s), are located at Lagadiyawas site land and Incinerator (n), and vermicular compost plant (v), are located at Sevapura site land, and one bio-medical treatment
plant located at khorarupadi.City is divided by north east
IJSER © 2011 http://www.ijser.org
International Journal of Scientific & Engineering Research Volume 2, Issue 3, March-2011 8
ISSN 2229-5518
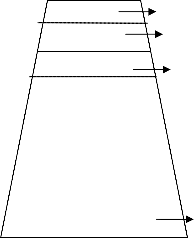
corner to south west corner in such a way that waste from Hawamahal (east), Hawamahal (west), Motidugri zone, Amer zone, and Civil line zone(18-22, 41-43, 63 wards) will be collected at nodes i=1,…5 respectively and then transfer to the transfer station at (t1). Waste from Saganer zone, Mansarovar zone, Vidyadharnagar zone, and Civil line(11-14 wards) will be collected at nodes j=1,…4 respectively and then transfer to the transfer station at (t2).At transfer station waste are segregated by workers and then transfer to the different plants which is shown in figure (2). Collection cost from house to house collection to nodes i=1…5 and j=1…4 will not be incorporated in the model. Biomedical waste shall be segregated into containers/bags at the point of generation treated and disposed in accordance with category given in the
following table1.
House to house collection at nodes i=1,2….5
Transfer station (t1)
Sorted by workers
Biomedical waste collected from all hospitals, Dispeneries, clinics& diagnostic centers
Biomedical waste plant process (0)
Autoclaving/ incinerator Autoclaving/ Disposed off
Microwaving/ chemical treatment/ Chemical treatment distruction/
Shredding
House to house collection at nodes j=1, 2,…4
Transfer station (t2)
Sorted by workers
Biomedical waste is handled without any adverse effect to human health and the environmental. The following precautions should be taken by every person/occupier of an institution who involved in handling of biomedical waste.
1. Bio-medical waste shall not be mixed with other waste.
2. No untreated bio-medical waste shall be kept beyond a period of 48 hours.
3. Not withstanding any thing contained in the motor
vehicle act, 1988, on rules there under untreated bio- Medical waste shall be transported only in such vehicle
R D F plant
(r)
Mechanical compost plant (m)
Landfill (e1)
Recycling
(s)
Incinerator
(n)
(Sold)
market
Vermicular
Compost
Plant (v)
Landfill (e2)
as may be authorized for the purpose by the competent authority as specified by the government.
4. Deep burial shall be an option available only in towns with population less than five lakes and in rural areas.
5. Chlorinated plastics shall not be incinerated.
6. Mutilation/shredding must be such so as to prevent unauthorized reuse.
7.Liquid waste generated from laboratory, wasting, cleaning, also liquid chemical waste should be disinfected by chemical
treatment and discharge into drains.
IJSER © 2011 http://www.ijser.org
International Journal of Scientific & Engineering Research Volume 2, Issue 3, March-2011 9
ISSN 2229-5518
Container color coding | Type of container-Waste category | Treatment option |
Yellow | Plastic bags-human anatomical waste, animal waste, microbiology and biotechnology waste, solid waste items contaminated with blood. | Incineration/d eep burial |
Red | Disinfected container/plastic bag- microbiology and biotechnology waste, solid waste generated from disposal items other than the sharps such as tunings, catheters, intravenous sets etc. | Autoclaving/ microwaving/ chemical treatment |
Blue/white translucent | Plastic bags/puncture proof- waste sharps like needles, syringes, scalpels, blades, glass etc., and also waste generated from disposal items other than waste sharps. | Autoclaving/ microwaving/ chemical treatment and destruction/sh redding |
Black | Plastic bags- discarded medicines and cytotoxic drugs, ash from incineration of any biomedical waste, chemicals used in production of biological, chemicals used in disinfection, as insecticides, etc. | Disposed in secured landfill |

Zone wise Quantity of waste generated in Jaipur shown by the following chart.(Fig.3)
![]()
H
The proposed model is a good starting point upon which future variation can be built. The existing status of waste management and the littered streets all over the city Cleary speak about the poor environmental health of the city. The aforesaid policies, if implemented have the potential to bring
an improvement in the SWM system in the Jaipur city. A
careful attention has been paid to provide a proper characterization of the system, as regards waste composition, heating value, material recovery and possible treatment which are mentioned in the proposed model. In such a way, it would be possible to determine optimal sequence of interventions, (building of new plants) over a given time horizon, capable of optimally deriving the MSW management system from the Present configuration to a final one.
1. P. costi, R. Minciardi, M. Robba, M. Ravati, R. Sacile, An environmentally sustainable decision model for urban solid waste management , waste management
24,(2004), 277-295.
2. Y. Sun , G. H. Huang, Y. P. Li, ICQSWM: An inexact chance- constrainedquartic solid waste management model, Resources, conservation and recycling
54,(2010), 641-657.
3. Gordon H. Huang, D. Linton, Julian Scott Yeomans, Reena Yoogalingam, Policy planning under uncertainty: efficient starting populations for simulation- optimization methods applied to municipal solid waste management. Journal of Environmental management 77, (2005) , 22-34.
4. Ministry of environment and forests notification, New
Delhi, 20th July 1998.
5. Minciardi,R.,Paolucci,M.,Robba,M.,Sacile,R., A multi objective approach for solid waste management.IEMSS 2002 Congress, Lugano, Switzerland, June 24-27, (2002) , 205-210.
6. Michael K. Nganda, Mathematical Models in
municipal solid waste management.P.hd. Thesis, Chalmers University of Technology and Gotebarg University, Sweden. (2007).
![]()
IJSER © 2011 http://www.ijser.org
International Journal of Scientific & Engineering Research Volume 2, Issue 3, Marc h-2011 10
ISSN 2229-5518
IJSER ©2011