International Journal of Scientific & Engineering Research Volume 2, Issue7, july-2011 1
ISSN 2229-5518
Improving Cost Efficient Manufacturing unit by Considering unit facility and Supplier Routing Cost in Supply Chain
S . Shakeel ahamed , Dr.G. Ranga Janardhana , Dr.E.L.Nagesh
—————————— • ——————————
lobal competition, shorter product life cycles, dynamic changes of demand patterns and product varieties and environmental standards frequently cause significant changes in market scenario compelling manufacturing enterprises to supply their best in order to survive [5]. Considerable stress is placed on their supply chains by this change that demands for an improved coordination of the performed actions and supply chain management techniques that can concurrently improve the customer service and reduce the cost are available for companies [6]. Supply chain (SC)
management is a network of
organizations, people, activities, information and resources and it is engaged in the physical flow of products from supplier to customer [4]. Nowadays, inventory management is considered as an important field of Supply chain management [2]. Maintaining the cost efficiencies while transporting the right product to the right place at the right time is the basic objective of supply chain management [10]. Inventory is a reserve of goods preserved for meeting future demand. Determining appropriate ordering time and
ordering quantity is the objective of inventory management. Typical supply chain configuration decisions include identifying location for production and distribution facilities, choosing supplier and creating links between the supply chains units [13]. Several
manufacturing companies use a production
inventory system to manage changes in
demand of the consumers for the product. A
completed goods warehouse to store products
that are not sold immediately after production
and a manufacturing plant exists in such systems [8]. The material handling and storage system greatly influence the performance of any manufacturing company .Routing has emerged as one of the most significant kinds of supply chain management, because it is one of the most crucial elements in managing the global supply chain. Companies are compelled to constantly search for ways to improve their operations by the characteristics of the present competitive environment for example the rapidity with which products are designed, produced and delivered, in addition to the requirement for superior efficiency and lower operational expenses (30). One of the difficult to optimally solve combinatorial optimization problems is the inventory-routing problem (27). Identifying a distribution strategy that
IJSER © 2011 http://www.ijser.org
International Journal of Scientific & Engineering Research Volume 2, Issue7, july-2011 2
ISSN 2229-5518
decreases long term distribution costs is the objective of inventory routing problem (IRP) (29).
Finding the best reordering point and
best ordering quantity according to the facility
of the manufacturing unit is an important
factor which avoids the over ordering and
lack ness in product storage. The prior
research of the author [] finds the optimized reorder point and the ordering quantity of the manufacturing unit which develops the sample best chromosome as in table:1. The proposed research improves the prior research
. In this research we improve the ordering
quantity according to the facility of the manufacturing unit by finding the facility
agreeable efficient solution demand matrix using
by finding capacity agreeable efficient solution demand matrix. In the real time, the shipment department in each supplier plant considers the factors like delay cost, path cost and transportation cost. The decision of choosing the best supplier providing the minimum routing cost for the required raw materials is the challenging feature for the inventory control of the manufacturing unit. The proposed system also finds the best routed supplier with minimum routing cost.
demand rate of each raw material for the preceding M period is forecasted to determine the optimized amount of order and optimized reorder point of ‘ MN ’ for the period of M = {M 1 , M 2 , M k } ;1 < k 5; 12 . Let
Genetic algorithm. This research also finds the best routed supplier for ordering the products.
![]()
D1 = {D1
i = 1, , ![]() R
R ![]() ; 1 <
; 1 <
![]()
![]()
j 5; M } be
Let ‘ MN ’ be the manufacturing system which
the forecasted demand rate for each material
uses the raw
in R , where
D1ij
is the predicted demand for
materials R = {R1 , R2 , R3 ....Rn }for
the ith
raw material for the jth
month forecasted
production and these raw materials are shipped from the suppliers S = {S1 , S 2 , S3 ....S n } . The
using the observed historical data.
the ith month. The generated ordering quantity in the solution demand matrix is tuned to be efficient by using the holding capacity ‘ C ’ of the
he forecasted demand rate
D1 is used to create
manufacturing unit. The Pseudocode-1
the associated solution demand matrix
represents the process of finding the capacity
![]()
D2 = {D2
D2ij
< N max
; i = 1, , | R |;1 <
j 5;
![]()
![]()
M a}greeable efficient solution demand matrix.
The generated solution demand matrix and the
consisting of the forecasted solution demands for
each raw material for the interval M ,
maximum holding capacity of the manufacturing unit is given as input to the procedure. The sum
where N max
= Max(D1) + 0.20 x Max(D1)
of ordering quantity of every positive order and
. The arbitrarily created solution demand rate for
the number of positive orders are calculated. If
the sum of ordering quantity for a month in the
each raw material is smaller than Nmax
and each
demand solution matrix is greater than the
row of the connected solution demand matrix
capacity of the manufacturing unit then the
yields the likely ordering amount of each raw material in R . From the solution demand matrix
ordering quantity is adjusted by the
Re j value
D2 the efficient solution demand matrix
so that it can satisfy the holding capacity.
Eventually, we obtain �D2ij , an efficient
![]()
�D2 = {�D2 �D
= D2
- Re
; if
![]()
![]()
D2 > C ; i = 1, , | R |;1 <
j 5; M }
ij ij ij j
D2ij
ij solution matrix that can satisfy the capacity of the
manufacturing unit.
where
Reij =
Cnt
is the reduction
amount and Cnt is the no of positive orders in
IJSER © 2011 http://www.ijser.org
International Journal of Scientific & Engineering Research Volume 2, Issue7, july-2011 3
ISSN 2229-5518
Input : Solution Demand matrix D2 , Maximum Holding capacity C
Output : The Resultant Solution demand matrix �D2 with facility
M k -7Months
D2( ki )
Re j
Pseudocode:
-7 Ordering quantity of ith raw material for the kth month.
-7 Reducing amount
For each M k M
Set S k =
D2
th
Set count k =
no of positive order for k
month
Set Re k
= S k
/ count k
For each
D2ki
If positive order and S k > C
End If
End For
�D2 ki
= D2 ki - Re k

The manufacturing unit ‘ MN ’ purchases the
‘Supplier-2’ may have the cost ‘C2’ which is greater than ‘C1’.The Table -1 illustrates the
raw materials
' R'
from the supplier
' S '
that
sample best chromosome which represents the
are needed for production .Each supplier has the different routing cost for shipping the product from the supplier plant to the manufacturing unit. The same raw material may have the different routing cost among the various suppliers. For example for the raw material ‘R1’ the ‘Supplier-1’ may fix the cost ‘C1’ where the
optimized reorder point of the raw materials for
the ‘M’ months. The table1 represents that the raw materials to be purchased for the month ‘M1’ is ‘R1,R4,R9,R10’. The ‘1’ in the table illustrates the positive ordering status of the raw material and ‘0’ represents the negative ordering status of the raw material.
R1 | R2 | R3 | R4 | R5 | R6 | R7 | R8 | R9 | R10 | |
M1 | 1 | 0 | 0 | 1 | 0 | 0 | 0 | 0 | 1 | 1 |
M2 | 1 | 0 | 0 | 1 | 0 | 0 | 0 | 0 | 0 | 1 |
M3 | 0 | 0 | 1 | 1 | 0 | 0 | 0 | 0 | 0 | 1 |
M4 | 1 | 0 | 0 | 0 | 0 | 0 | 1 | 0 | 0 | 1 |
M5 | 1 | 0 | 0 | 1 | 0 | 0 | 0 | 0 | 0 | 0 |
M6 | 0 | 1 | 0 | 0 | 0 | 0 | 0 | 1 | 1 | 0 |
M7 | 0 | 0 | 1 | 0 | 0 | 0 | 1 | 0 | 0 | 1 |
M8 | 1 | 0 | 0 | 0 | 0 | 0 | 0 | 0 | 0 | 0 |
M9 | 0 | 0 | 0 | 1 | 1 | 0 | 0 | 0 | 0 | 0 |
M10 | 1 | 0 | 0 | 0 | 0 | 0 | 1 | 0 | 0 | 1 |
M11 | 0 | 0 | 1 | 0 | 0 | 0 | 1 | 0 | 0 | 0 |
M12 | 0 | 0 | 0 | 0 | 0 | 1 | 0 | 0 | 0 | 0 |
IJSER © 2011 http://www.ijser.org
International Journal of Scientific & Engineering Research Volume 2, Issue7, july-2011 4
ISSN 2229-5518
Let
PRki ; i = 1..10 be the set of the raw materials
combination list of supplier having the minimum routing cost is found out first and among ‘n’
to be purchased for the kth month, where
k=1..12, SC ={SCi ; i =1..![]() S
S ![]() } be the set of raw materials that are supplied by the each supplier
} be the set of raw materials that are supplied by the each supplier
combination the combination having the
minimum routing cost is selected for the first month. This process is repeated for every month
and the supplier list �S
with minimum routing
where
SCi
= { R j
|; j
1..10}
is the raw
cost for the required raw material is generated.
materials supplied by the ith supplier and
RC = {RCij
|; j
1..10} is the routing cost of
the raw materials supplied by the ith supplier.
For example, from the table1 the raw materials to
be purchased for | the | 1st | month | is |
R1, R4, R9, R10 . | The |
DA = {DAi
|; i
1..10}is the combination of
the raw materials supplied by the supplier with their routing cost are separated and stored according to their length wise.
The Pseudo code 2 below represents the steps
used for finding the best routing supplier. From the best chromosome, the raw material list to be purchased for a month is identified and their each combination list is generated. The ‘n’
Input : Best Chromosome BC , The raw materials supplier by the Suppliers
SC, RC the routing cost of the raw materials supplied by the supplier, DAr the combination database.
with minimum routing cost for the required raw material.
M k -7 Months
PRk -7 Purchasing raw material
PRcombi
-7 Combination list of purchasing raw material
Pseudo code:
For each M k M
Get PRk
Generate PR
combi
Set l = length(PRk )
Randomly select r < l
For each i 5; r
Sel = r length data in PR
If Sel exist in DAr
RCost = RCr
Endif
SS = min (Rcost)
RR = DAr (min (Rcost))
r=r-1
combi
End for
End for
�S = �S + RR

IJSER © 2011 http://www.ijser.org
International Journal of Scientific & Engineering Research Volume 2, Issue7, july-2011 5
ISSN 2229-5518
sample best chromosome having the optimized reorder point for ordering the raw materials.
R1 | R2 | R3 | R4 | R5 | R6 | R7 | R8 | R9 | R10 | |
M1 | 0 | 1 | 1 | 0 | 0 | 0 | 0 | 1 | 0 | 0 |
M2 | 1 | 0 | 0 | 1 | 0 | 0 | 0 | 0 | 0 | 0 |
M3 | 0 | 1 | 0 | 0 | 0 | 1 | 0 | 1 | 0 | 0 |
M4 | 0 | 0 | 0 | 0 | 1 | 1 | 0 | 0 | 0 | 0 |
M5 | 0 | 0 | 1 | 1 | 0 | 1 | 1 | 0 | 0 | 0 |
M6 | 1 | 1 | 0 | 0 | 0 | 0 | 0 | 0 | 0 | 0 |
M7 | 0 | 0 | 1 | 0 | 0 | 0 | 1 | 0 | 1 | 0 |
M8 | 0 | 0 | 0 | 1 | 1 | 0 | 1 | 0 | 0 | 0 |
M9 | 0 | 0 | 1 | 0 | 0 | 0 | 1 | 0 | 0 | 1 |
M10 | 1 | 0 | 0 | 0 | 1 | 0 | 0 | 0 | 0 | 1 |
M11 | 0 | 0 | 0 | 1 | 0 | 1 | 0 | 0 | 0 | 0 |
M12 | 1 | 0 | 0 | 0 | 1 | 0 | 0 | 1 | 0 | 0 |
Mont h | Raw materials to be purchased |
M1 | R2,R3,R8 |
M2 | R1,R4 |
M3 | R2,R6,R8 |
M4 | R5,R6 |
M5 | R3,R4,R6,R7 |
M6 | R1,R2 |
M7 | R3,R7,R9 |
M8 | R4,R5,R7 |
M9 | R3,R7,R10 |
M10 | R1,R5,R10 |
M11 | R4,R6 |
M12 | R1,R5,R8 |
From the table 2 the raw materials to be purchased are identified by their values and table 3 represents the purchasing list of the raw materials to be purchased for the whole period. The raw materials which are supplied
by the supplier are listed and their combination with the routing cost is stored in the database according to their length wise.
IJSER © 2011 http://www.ijser.org
International Journal of Scientific & Engineering Research Volume 2, Issue7, july-2011 6
ISSN 2229-5518
Supplier | Combination | Routing cost |
1 | 2 | 75 |
1 | 3 | 84 |
1 | 9 | 40 |
1 | 7 | 10 |
1 | 1 | 27 |
2 | 5 | 58 |
2 | 6 | 100 |
2 | 4 | 37 |
3 | 8 | 18 |
3 | 10 | 88 |
3 | 2 | 28 |
3 | 3 | 85 |
3 | 9 | 81 |
3 | 7 | 19 |
3 | 1 | 98 |
The table 4 represents the sample raw material list supplied by the suppliers which are arranged by their length. The Raw materials to be purchased for the
month ‘M1’ is chosen first also the combination of the purchasing list are generated. The table 5 illustrates the combination list of the materials.
IJSER © 2011 http://www.ijser.org
International Journal of Scientific & Engineering Research Volume 2, Issue7, july-2011 7
ISSN 2229-5518
Sno | Combination |
1 | R2 |
2 | R3 |
3 | R8 |
4 | R2,R3 |
5 | R2,R8 |
6 | R3,R8 |
7 | R2,R3,R8 |
The count of the raw materials to be purchased is found out first. In our example the count of the raw materials to be purchased for the first month is ‘l=3’. Randomly choose a number less than ‘l’ for choosing the supplier list. If the randomly choose number is 2 then the occurrence of the two length combination in the purchasing list is searched in the two length supplier list. It is occurs then the corresponding routing cost ‘RR’ is selected and stored, then the all the ‘1’ length combination item in the purchasing
list is searched in the 1 length supplier list
and their routing cost is found out and finally a best combination represents the supplier list to be chosen are found. The above steps are repeated ‘n’ times to get ‘n’ combination of the supplier list. From the
‘n’ combination, the best combination having the minimum routing cost is selected for the first month. Like wise the best combination are chosen for the each month in the whole period. The best combination supplier list, corresponding routing cost and minimized total routing cost for the dataset -1, are illustrated in table-6(a).
IJSER © 2011 http://www.ijser.org
International Journal of Scientific & Engineering Research Volume 2, Issue7, july-2011 8
ISSN 2229-5518

2 3 => 5 => 39
8 => 4 => 36
1 | => | 4 => | 46 |
4 | => | 5 => | 44 |
2 => 3 => 67
6 8 => 2 => 55
5 | => | 4 => 53 |
6 | => | 4 => 63 |
3 4 => 2 => 56
6 => 4 => 63
7 => 2 => 36
1 | => | 4 => | 46 |
2 | => | 3 => | 67 |
3 | => | 5 | => | 30 |
7 | => | 2 | => | 36 |
9 | => | 3 | => | 3 |
4 | => | 5 | => | 44 |
5 | => | 4 | => | 53 |
7 | => | 2 | => | 36 |
3 | => | 5 => | 30 |
7 10 => 5 => 70
1 | => | 4 | => | 46 |
5 | => | 4 | => | 53 |
10 | => | 2 | => | 43 |
4 => 5 => 44
6 => 4 => 63
1 => 4 => 46
5 8 => 4 => 42
IJSER © 2011 http://www.ijser.org
International Journal of Scientific & Engineering Research Volume 2, Issue7, july-2011 9
ISSN 2229-5518
The performance of the proposed approach is evaluated using different data set. The performance is evaluated by comparing the total routing cost given by the recommended suppliers by the proposed method with the routing cost of the non recommend suppliers. The figure(a) represents the comparison graph of the routing cost of the recommend suppliers with the routing cost of the non recommendedsuppliersfordataset-1,
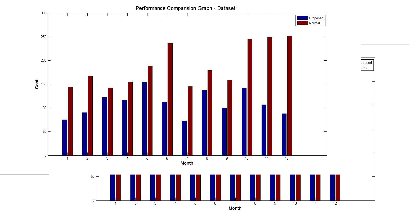
The figure-(a) below illustrates that the routing cost of the suppliers recommend by the proposed method is less than the routing cost of the non recommended suppliers.
Inventory management is fundamentally related to specification of the quantity and placement of stocked goods. Safeguarding the normal and forecasted course of production against the arbitrary disturbance of running out of materials or goods necessitate inventory management at several locations within a facility or within multiple locations of a supply network. Selection of the least cost, distance, and time route from diverse choices for a good decision to arrive at its destination is called routing. Inventory routing problems in which inventory control and routing decisions are to be made at the same time is one of the more significant and more challenging extensions of vehicle routing problems. It can be used for the management of storage capacity for raw materials in manufacturing units. The proposed system improves the prior research of the author by finding the facility agreeable solution demand matrix and also this research finds the best routed supplier having the minimum routing cost.
[1]Peters mileff, Károly Nehez,Tibor Toth,” A new inventory control method for supply chain management”, In proceeding of the 12th
International Conference on Machine Design and
Production, September 2006.
[2] P. Radhakrishnan, V.M. Prasad and M.R. Gopalan,” A Optimizing Inventory Using Genetic Algorithm for Efficient Supply Chain Management”, Journal of Computer Science Vol.5 (3), p.p. 233-241,
2009
[3]Chin-Hsiung Hsu, Ching-Shih Tsou, and Fong- Jung Yu,” Multicritiria tradeoff in inventory control using memetic particle swarm optimization”, International Journal of Innovative Computing, Information and Control, No. 11(A), Vol. 5, November 2009.
[4]Behnam Fahimnia, Lee Luong, Remo Marian,” Optimization/simulation modeling of the integrated production distribution Plan: an innovative survey”, Wseas transaction on business and economics, No. 3, Vol. 5, March 2008.
[5]P.Radhakrishnan , Dr. V.M.Prasad ,Dr. M. R. Gopalan,” Inventory Optimization in Supply Chain Management using Genetic Algorithm”, IJCSNS International Journal of Computer Science and Network Security, No.1,Vol.9, January 2009.
[6]Philip Doganis, Eleni Aggelogiannaki, and Haralambos Sarimveis,” A Model Predictive Control and Time Series orecasting Framework for Supply Chain Management”, World Academy of Science, Engineering and Technology 2006.
[7]Chitriki Thotappa, Dr. K.Ravindranath,” Data mining Aided Proficient Approach for Optimal Inventory Control in Supply Chain Management”, Proceedings of the World Congress on Engineering, Vol. 1, 2010.
[8] Md. Azizul Baten and Anton Abdulbasah Kamil, "Direct solution of Riccati equation arising in inventory production control in a Stochastic manufacturing system",International Journal of the Physical Sciences Vol. 5(7), pp. 931-934, July 2010.
[9] M. Aslam, Farrukh, A. R. Gardezi and Nasir Hayat,” Design, Development and Analysis of Automated Storage and Retrieval System with Single and Dual Command Dispatching using MATLAB”, World Academy of Science, Engineering and Technology 2009.
[10] M. Sreenivas, T.Srinivas,” Effectiveness of Distribution Network”, International Journal of Information Systems and Supply Chain Management, Int’l Journal of Information Systems and Supply Chain Management, Int’l Journal of Information Systems and Supply Chain Management, Vol.1(1), p.p.80-86 , January-March
2008.
[11] V. A. Temeng,P. A. Eshun,P. R. K. Essey, "Application of Inventory Management Principles to Explosive Products Manufacturing and Supply
– A Case Study”, International Research Journal
of Finance and Economics, 2010.
IJSER © 2011 http://www.ijser.org
International Journal of Scientific & Engineering Research Volume 2, Issue7, july-2011 10
ISSN 2229-5518
[12] Arumugam Mahamani and Karanam Prahlada Rao,"Development of a spreadsheet vendor managed inventory model for a single echelon supply chain: case study”, Serbian Journal of Management Vol.5 (2), p.p.199 - 211,
2010.
[13] Charu Chandra, Janis Grabis,"Supply chain configuration using simulation based optimization", Proceedings of the 35th conference on winter simulation: driving innovation, 2003.
[14] Steven P. Landry, Monterey,"Do Modern Japanese Inventory Methods Apply To Hong Kong?", International Business & Economics Research Journal ,Vol. 7, No. 4 April 2008.. [15]Soheil Sadi-Nezhad a, Shima Memar Nahavandia and Jamshid Nazemia,"Periodic and continuous inventory models in the presence of fuzzy costs”, International Journal of Industrial Engineering Computations, 2010.
[16]Haruhiko Tominaga, Tatsushi Nishi, and
Masami Konishi, "Effects of inventory control on
bullwhip in supply chain planning for multiple
company”, International Journal of Innovative
Computing, Information and Control, No. 3, Vol.
4, March 2008.
[17] Adel A. Ghobbar, Chris H. Friend, “The
material requirements planning system for
aircraft maintenance and inventory control: a
note”, Journal of Air Transport Management,
Vol.10, p.p.217–221, 2004.
[18] A. R. Ismail,E. Hashim,J.A.Ghani,R.Zulkifli,N.Kamilah,M. N. A. Rahman,"Implementation of EIS: A Study at Malaysian SMES",European Journal of Scientific
Research, No.2 ,Vol..30, pp.215- 223 , 2009.
[19] QM. He a, E.M. Jewkes b, J. Buzacott
c,"Optimal and near-optimal inventory control
policies for a make-to-order inventory–
production system “European Journal of
Operational Research Vol.141 , p.p.113–132,2002.
[20] Patrick J. Rondeau Lewis A. literal,
“Evaluation of manufacturing control system:
from reorder point to enterprise resource planning", production and inventory management journals, 2001.
[21] Alp Muharremoglu, Nan Yang "Inventory Management with an Exogenous Supply Process" Operational research, issue 0030-364X, Vol. 58, No. 1, pp. 111–129, 2010.
[22] Sanjoy Kumar Paul, Abdullahil Azeem,"Selection of the optimal number of shifts in fuzzy environment: manufacturing company’s facility application”, journals of industrial Engineering and management, vol.3, no.1. p.p. 54-
67 ,2010.
[23] Thomas Fiig, Karl Isler , Craig Hopperstad
,Peter Belobaba ," Optimization of Mixed Fare
Structures: Theory and Applications”, Journal of
Revenue and Pricing Management, 7th April
2009.
[24] Arumugam Mahamani and Karanam
Prahlada Rao,"Development of a spreadsheet
bases vendormanaged inventory model for the
single echelon supply chain: A case study", Serbian Journal of Management, Vol. 5 (2) p.p.199
– 211 , 2010.
[25] M.Zadieh and S.Molla-Alizadeh-
Zavaedehi,"synchronized production and
distribution scheduling with Due window ",
Journal of applied sciences, Vol. 8(15), p.p. 2752-
2757, 2008.
[26] Luca Bertazz, Martin Savelsbergh, and M.
Grazia Speranza "Inventory
Routing",transportation Science, Vol.36 , p.p.44-
54,February 2002 .
[27] SombaSt indhuchao,"A Very Large Scale Neighborhood (Vlsn) Search Algorithm for an Inventory- Routing Problem", ThammasatI nt. J.Sc.Tech. ,Vol.ll. , October-December 2006.
[28] Zuo-Jun Max Shen and Lian Qi,"Incorporating inventory and routing costs in strategic location models", European Journal of Operational Research 2006.
[29] Jin-Hwa Song and Martin Savelsbergh, "Performance Measurement for Inventory Routing", Institute for Operations Research and the Management Sciences, Vol. 41, No.1, February
2007.
[30] Ana Maria Sarmiento and Rakesh Nagiy,"A
Review of Integrated Analysis of Production-
Distribution Systems", IIE Transaction ,Vol. 31,
No. 11, P.p. 1061 - 1074, 1999.
[31] Ling-Feng Hsieh, Chao-Jung Huang and
Chien-Lin Huang, "Applying Particle Swarm
Optimization to Schedule Order Picking Routes in
a Distribution Center", Asian Journal of
Management and Humanity Sciences, Vol. 1, No.
4, p.p. 558-576, 2007.
[32] Hamid Afshari, Majid Amin-Nayeri, and
Amir Ardestanijaafari,"Optimizing Inventory Decisions in Facility Location within Distribution Network Design", Proceedings international multi conferences of Engineers and Scientists
Vol.III,2010.
[33] S Shakeel ahamed, G. Ranga
Janardhana,E.L.Nagesh,“GA Based Inventory
Control for Manufacturing Unit”, published in
American Journal of Scientific Research, may2011
issue 17.
-----------------------------------------*------------------------------------------
IJSER © 2011 http://www.ijser.org
International Journal of Scientific & Engineering Research Volume 2, Issue7, july-2011 11
ISSN 2229-5518
.s.shakeel ahamed is presently pursuing his phd degree program in mechanical engineering at jntu Hyderabad, Email:shakeelkdp@gmail.com.
.Dr.G.Rangajanardhana is working as principal,jntu kakinada vijayanagaram campus. A.P India. Email:ranga.janardana@gmail.com.
Dr.E.L.Nagesh is working as principal netaji institute of engineering and tecnology Hyderabad. India. Email:el.nagesh@gmail.com
IJSER © 2011 http://www.ijser.org
International Journal of Scientific & Engineering Research Volume 2, Issue7, july-2011 12
ISSN 2229-5518
IJSER © 2011 http://www.ijser.org