International Journal of Scientific & Engineering Research, Volume 3, Issue 11, November-2012 1
ISSN 2229-5518
Implementation of Possibilistic Fuzzy C-Means Clustering Algorithm in Matlab
Neelam Kumari, Bhawna Sharma, Dr. Deepti Gaur
Dept.of Computer Science &IT,ITMUniversity,Gurgaon, INDIA. singh.neelam693@gmail.com bhawnash.6@gmail.com deepti_k_Gaur@yahoo.com
Abstract—Clustering means classifying the given observation data sets into subgroups or clusters. It is a process of grouping data objects into disjointed clusters so that the data in the same cluster are similar, yet data belonging to different clusters are different. Different fuzzy data clustering algorithms exist such as Fuzzy C- Means( FCM), Possibilistic C-Means(PCM), Fuzzy Possibilistic C-Means(FPCM) and Possibilistic Fuzzy C- Means(PFCM). In this paper we present the implementation of PFCM algorithm in Matlab and we test the algorithm on two different data sets.
Index Terms— Data clustering , Clustering algorithms, K-Means, FCM, PCM, FPCM, PFCM.
—————————— ——————————
I.INTRODUCTION
There are various algorithms of data clustering, every algorithm has its own advantages and disadvantages. Such as K-Means algorithm does not allow overlapping of clusters which is a major disadvantage of this algorithm. The FCM has problems dealing with noise and outliers. The
PCM has the problem of coincident clusters and the FPCM
{ ( )
∑ ∑( ) ‖ ‖
∑ ∑( ) } ( )
has difficulties when the data set is big because the typicality values will be very small. All the apparent problem of FPCM is that it imposes a constraint on the typicality values (sum of the typicalities over all data points to a particular cluster is 1).We relax the constraint on the typicality values but retain the column constraint on the membership values. The PFCM is a good clustering algorithm to perform classification tests because it possesses capabilities to give more importance to typicalities or membership values. PFCM is a hybridization of PCM and FCM that often avoids various problems of PCM,FCM and FPCM.
II. PFCM CLUSTERING ALGORITHM PFCM lead to optimize the following objective function:
subject to the constraints∑
Here a , b , m , and
is the objective function. U is the partition matrix. T is the typicality matrix. V is a vector of cluster centers, X is a set of all data points, x represents a data point, n is the number of data points and c is the number of cluster centers which are
described by s coordinates.‖ ‖ is any norm
used to calculate the distance between cluster
center and data set(also represented by ). Here we are using Euclidean Distance(calculated by using Equation 4).
The constants a and b define the relative importance of fuzzy membership and typicality values in the objective function. Note that, in Eq. 1 has the same meaning of membership as that in FCM. Similarly, has the same interpretation of typicality as in PCM. If we increase the importance (weight) of membership then that necessarily forces us to reduce the importance of typicality by the same amount. Also, we will see later that the optimal typicality values depend on the magnitude of b. So by constraining a b 1, we lose modeling
IJSER © 2012 http://www.ijser.org
International Journal of Scientific & Engineering Research, Volume 3, Issue 11, November-2012 2
ISSN 2229-5518
flexibility.PFCM uses the objective functions of
PCM and FCM given in Eq.2 and Eq.3 respectively.
{ ( )
∑ ∑( ) ‖
‖ } ( )
{ ( ) ∑ ∑( ) ‖ ‖
∑ ∑( ) } ( )
[∑( ) ] ( ) If b , and for all i , then Eq.1 reduces to the FCM optimization problem in Eq.2; while converts it to the usual PCM model in Eq.3. Later, we will see that when b even if we do not set
for all i ,Equation 1 implicitly becomes equivalent to the FCM model. Like FPCM, under the usual conditions placed on c-means optimization problems, we get the first-order necessary conditions for extrema of .
( )
.Equation 7 shows that if we use a high value of b compared to a , then the centroids will be more influenced by the typicality values than the membership values. On the other hand, if we use a higher value of a then the centroids will be more influenced by the membership values. Thus, to reduce the effect of outliers, we should use a higher value for b than a. Similar effects can also be
obtained by controlling the choice of . For
example, if we use a large value of m and a smaller value for , then the effect of outliers on the
centroids will be reduced. However, a very large value of m will reduce the effect of memberships on the prototypes and the model will behave more like the PCM model.
III. EXPERIMENTAL ANALYSIS
We run the algorithm for the two data sets. The Matlab code for following six files for Possiblistic Fuzzy C-Means clustering algorithm are as follows:
function[center,U,T,obj_fcn]=
pfcm(data,cluster_n,options)![]()
(∑ ( )
![]()
![]()
( )
) ( )
n
( ) ( )
n
%pfcmDatasetclusteringusingpossiblistic fuzzy c-
%meansclustering.
[CENTER,U,OBJ_FCN]=FCM(DATA,N_CLUST ER) %findsN_CLUSTER
%number of clusters in the data set DATA.
%DATA is size M-by-N, where M is the number![]()
∑ ( )
∑ ( )
(7)
%of data points and N is the number of coordinates
%for each datapoint. The coordinates for each
%cluster center are returned in the rows of the
%matrix CENTER. The membership function
%matrix U contains the grade of membership of
PFCM behaves like FCM as the exponents grow without bound. That is, irrespective of the values of the constants a and b, all c centroids approach the
%each data point in each cluster. The values 0 and
%1 indicate no membership and full membership
%respectively. Grades between 0 and 1 indicate
%that the data point has partial membership in a
overall (grand) mean as
m and
%cluster. At each iteration, a possiblistic degree
IJSER © 2012 http://www.ijser.org
International Journal of Scientific & Engineering Research, Volume 3, Issue 11, November-2012 3
ISSN 2229-5518
%same as in pcm T objective function is
%minimized to find the best location for the
%clusters and its values are returned in OBJ_FCN.
%[CENTER,..]=PFCM(DATA,N_CLUSTER,OPTIO
%NS)specifies a vector of options fort he
%clustering process:
% OPTIONS(1): exponent for the matrixUdefault:
%2.0)
% OPTIONS(2): maximum number of % iterations
%(default: 100)
% OPTIONS(3): minimum amount of
% improvement (default: 1e-5)
% OPTIONS(4): info display during
% iteration (default: 1)
% OPTIONS(5): user defind constant a
%(default: 1)
% OPTIONS(6): user defined constant b %should be greater than a (default:4)
% OPTIONS(7): user defined constant%nc
(default:nc=2.0)
% The clustering process stops when the maximum
% number of iterations is reached, or when
%objective function improvement between two
% consecutiveiterations is less than the minimum
% amount specified. Use NaN to select the default
% value.See also pinitf, tinitf, pdistfcm,pstepfcm ifnargin ~= 2 &nargin ~= 3,
error('Too many or too few input arguments!');end data_n = size(data, 1);
in_n = size(data, 2);
% Change the following to set default options default_options = [2;100;1e-;1;1;4;2];
ifnargin == 2,options = default_options;
else
% If "options" is not fully specified, pad it with
% default values.
if length(options) < 7, tmp = default_options;
tmp(1:length(options)) = options;options = tmp;
end
% If some entries of "options" are nan's, replace them
% with defaults.
nan_index = find(isnan(options)==1); options(nan_index) = default_options(nan_index); if options(1) <= 1,
error('The exponent should be greater than 1!');
end end
expo = options(1); max_iter = options(2); min_impro = options(3); display = options(4); a=options(5); b=options(6);
nc =options(7); ni=input('enter value of ni'); obj_fcn = zeros(max_iter, 1);
% Array for objective function center = input('initialize the centre');
IJSER © 2012 http://www.ijser.org
International Journal of Scientific & Engineering Research, Volume 3, Issue 11, November-2012 4
ISSN 2229-5518
U = pinitf(cluster_n, data_n); % Initial fuzzy partition
T = tinitf(cluster_n,data_n); % Initial typicality matrix
for i = 1:max_iter,
[U,T,center, obj_fcn(i)] =
pstepfcm(data,center,U,T,cluster_n, expo,a,b,nc,ni);
if display,
fprintf('Iteration count = %d, obj. fcn = %f\n', i, obj_fcn(i));
end
% check termination condition if i > 1,
if abs(obj_fcn(i) - obj_fcn(i-1)) <min_impro,break;
end,endenditer_n = i; % Actual number of terations obj_fcn(iter_n+1:max_iter) = [];
col_sum = sum(T); u=col_sum(ones(cluster_n, 1), :); T = T./u;
col_sum = sum(U); u=col_sum(ones(cluster_n, 1), :); U = U./u;
function [U_new,T_new,center_new,obj_fcn]=
pstepfcm(data,center,U,T,cluster_n, expo,a,b,nc,ni)
% PSTEPFCM One step in possiblisticfuzzy c-mean
% clusteringperforms one iteration of pfcm
% clustering, where DATA: matrix of data to be
% clustered. (Each row is a data point.)U:partition
% matrix. (U(i,j) is the MF value of data j in cluster
% j.) CLUSTER_N: number of clusters.EXPO:
% exponent (> 1) for the partition matrix.U_NEW:
%new partition matrix of fcmT_new: new partition
%matrix of pcmCENTER: center of clusters. (Each
% row is a center.) obj_fcn: objective function for
% partition U and T. Note that the situation of
% "singularity" (one of the data points isexactly the
% same as one of the cluster centers)
% isnotchecked.However, it hardly occurs in
% practice.
mf = U.^expo; % MF matrix after exponential
%modification tf=T.^nc;tfo=(1-T).^nc;
center_new = (a.*mf+b.*tf)*data./((ones(size(data,
2), 1)*sum(a.*mf'+b.*tf'))')
dist = distfcm(center, data)
% fill the distance matrix obj_fcn=sum(sum((dist.^2).*(a.*mf+b.*tf)))+sum(ni
*sum(tfo))
% objective function
tmp = dist.^(-2/(expo-1)); U_new=tmp./(ones(cluster_n,1)*sum(tmp)); tmpt=((b/ni)*dist.^2).^(1/(nc-1));
T_new = 1./(1+tmpt);
function out = pdistfcm(center, data)
IJSER © 2012 http://www.ijser.org
International Journal of Scientific & Engineering Research, Volume 3, Issue 11, November-2012 5
ISSN 2229-5518
%PDISTFCM Distance measure in possiblistic fuzzy
%c-mean clustering.OUT = PDISTFCM(CENTER,
%DATA) calculates the Euclidean distancebetween
%each row in CENTER and each row in DATA, and
%returns a distance matrix OUT of size M by N,
%where M and N are row dimensions of CENTER
%and DATA, respectively, and OUT(I, J) isthe
%distance between CENTER(I,:) and DATA(J,:). out = zeros(size(center, 1), size(data, 1));
% fill the output matrix
if size(center, 2) > 1,
index2 = find(U(2,:) == maxU);
line(dataset1(index1,1),dataset1(index1,2),'marker','*'
,'color','g);
line(dataset1(index2,1),dataset1(index2,2),'marker','*'
,'color','r');
%Plot the cluster centers plot([center([1 2],1)],[center([1
2],2)],'*','color','k')
holdoff;
for k = 1:size(center, 1),
out(k, :) = sqrt(sum(((data-ones(size(data,
1),1)*center(k,:)).^2)'));
end else
for k = 1:size(center, 1),
out(k, :) = abs(center(k)-data)';
end
end
%see also
The file dataset1.dat stores the whole data set on which PFCM clustering algorithm is to be applied.The result obtained after calling pfcm.m
%pfcm,dataset1,pinitf,tinitf,pdistfcm,pstepfcm. [center,U,T,obj_fcn] = pfcm(dataset1,2); plot(dataset1(:,1), dataset1(:,2),'o');
holdon;
maxU = max(U);
%Find data points with highest grade of membership
%in cluster1
index1 = find(U(1,:) == maxU);
% Find the data points with highest grade of
%membership in cluster2
function(implemented in matlab) for the above
data set-1 and data Set-2 is shown below:
Centpfcm center value of ni0.08
initialize the centre[0.07 0.36;0.40 0.99]
IJSER © 2012 http://www.ijser.org
International Journal of Scientific & Engineering Research, Volume 3, Issue 11, November-2012 6
ISSN 2229-5518
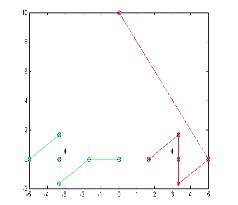
Figure-1
1 | 2 | |
1 | 0.21895919 | 0.71971108 |
2 | 0.67929641 | 0.31389837 |
3 | 0.83096535 | 0.47903993 |
4 | 0.053461635 | 0.77931485 |
5 | 0.68677271 | 0.52219568 |
6 | 0.091964891 | 0.71405761 |
7 | 0.65391896 | 0.16631787 |
8 | 0.70119059 | 0.422224 |
9 | 0.91032083 | 0.31883553 |
10 | 0.73608188 | 0.45760685 |
11 | 0.63263857 | 0.14380738 |
12 | 0.7226604 | 0.3206678 |
13 | 0.75335583 | 0.46373323 |
IJSER © 2012 http://www.ijser.org
International Journal of Scientific & Engineering Research, Volume 3, Issue 11, November-2012 7
ISSN 2229-5518
loadfcmdata.dat
[center, U,T, obj_fcn] = pfcm(fcmdata, 2);
maxU = max(U);
index1 = find(U(1, :) == maxU); index2 = find(U(2, :) == maxU); line(fcmdata(index1, 1), fcmdata(index1, 2),
'linestyle',...'none','marker', 'o','color','g');
line(fcmdata(index2,1),fcmdata(index2,2),'linestyle',..
.'none','marker', 'x','color','r'); holdon plot(center(1,1),center(1,2),'kx','markersize',15,'Line Width',2) plot(center(2,1),center(2,2),'kx','markersize',15,'Line Width',2)
Centerpfcm
enter value of ni0.085
initialize the centre[0.07 0.36;0.40 0.99] Iteration count = 1, obj. fcn = 169.719992
Iteration count = 2, obj. fcn = 30.906949
Iteration count = 3, obj. fcn = 28.911804
Iteration count = 4, obj. fcn = 28.624657
Iteration count = 5, obj. fcn = 30.545798
Iteration count = 6, obj. fcn = 30.565587
Iteration count = 7, obj. fcn = 32.824230
Iteration count = 8, obj. fcn = 32.436485
Iteration count = 9, obj. fcn = 34.899085
Iteration count = 10, obj. fcn = 33.981948
Iteration count = 11, obj. fcn = 36.337822
Iteration count = 12, obj. fcn = 34.968145
Iteration count = 13, obj. fcn = 36.884404
Iteration count = 14, obj. fcn = 35.170103
%See also
Iteration count = 15, obj. fcn = 36.419926
Iteration count = 16, obj. fcn = 34.483684
%fcmdata,pfcm,pinitf,tinitf,pdistfcm,pstepfcm.
Iteration count=17,obj.fcn=35.006450
Iteration count= 18,obj. fcn=33.015857
IJSER © 2012 http://www.ijser.org
International Journal of Scientific & Engineering Research, Volume 3, Issue 11, November-2012 8
ISSN 2229-5518
Iteration count = 19, obj. fcn = 32.888743
Iteration count = 20, obj. fcn = 31.018486
Iteration count = 21, obj. fcn = 30.451930
Iteration count = 22, obj. fcn = 28.824755
Iteration count = 23, obj. fcn = 28.097759
Iteration count = 24, obj. fcn = 26.787371
Iteration count = 25, obj. fcn = 26.062699
Iteration count = 27, obj. fcn = 24.435272
Iteration count = 28, obj. fcn = 23.771498
Iteration count = 29, obj. fcn = 23.218869
Iteration count = 30, obj. fcn = 22.764694
Iteration count = 31, obj. fcn = 22.360895
Iteration count = 32, obj. fcn = 22.057192
Iteration count = 33, obj. fcn = 21.795550
Iteration count = 34, obj. fcn = 21.606641
Iteration count = 35, obj. fcn = 21.456819
Iteration count = 36, obj. fcn = 21.351975
Iteration count = 37, obj. fcn = 21.275950
Iteration count = 38, obj. fcn = 21.224284
Iteration count = 39, obj. fcn = 21.189212
Iteration count = 40, obj. fcn = 21.165943
Iteration count = 41, obj. fcn = 21.150726
Iteration count = 42, obj. fcn = 21.140799
Iteration count = 43, obj. fcn = 21.134421
Iteration count = 44, obj. fcn = 21.130304
Iteration count = 45, obj. fcn = 21.127677
Iteration count = 46, obj. fcn = 21.125992
Iteration count = 47, obj. fcn = 21.124918
Iteration count = 48, obj. fcn = 21.124232
Iteration count = 49, obj. fcn = 21.123794
Iteration count = 50, obj. fcn = 21.123515
Iteration count = 51, obj. fcn = 21.123337
Iteration count = 52, obj. fcn = 21.123223
Iteration count = 53, obj. fcn = 21.123151
Iteration count = 54, obj. fcn = 21.123104
Iteration count = 55, obj. fcn = 21.123075
Iteration count = 56, obj. fcn = 21.123056
Iteration count = 57, obj. fcn = 21.123044
Iteration count = 58, obj. fcn = 21.123036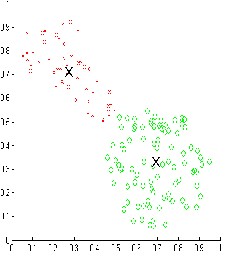
Figure-2
IV.RESULT
The result shown in figure-1 and figure-2 is quite good as compare to FCM and PCM. The PFCM algorithm overcome the problem of Overlapping of the coincident clusters.
V.CONCLUSION
IJSER © 2012 http://www.ijser.org
International Journal of Scientific & Engineering Research, Volume 3, Issue 11, November-2012 9
ISSN 2229-5518
We have implemented the PFCM in Matlab taking all the considerations in mind that about the membership value and typicality.
REFERENCES
[1] Nikhil R. Pal,Kuhu Pal, James M. Keller, and James C. Bezdek,” A Possibilistic Fuzzy c-Means Clustering Algorithm,”IEEE Trans. on Fuzzy Systems, vol. 13, no. 4, pp. 517-530, Aug. 2005.
[2] Jian Cui, Qiang Li, Jun Wang and Da-Wei Zong,” Research on Selection Method of the Optimal Weighting Exponent and ClusteringNumber in Fuzzy C-Means Algorithm ,” International Conference on Intelligent Computation Technology and Automation, pp. 104-107, 2010.
[3] Jiang-She Zhang and Yiu-Wing Leung,” Improved Possibilistic C-Means ClusteringAlgorithms,” IEEE Trans. on Fuzzy Systems, vol. 12, no. 2, pp. 209-217, April 2004.
[4] S. Nefti and M. Oussalah,” Probabilistic-Fuzzy Clustering Algorithm,” IEEE lntemational Conference on Systems, Man and Cybemetics, pp. 4786-4791, 2004.
[5] Jiabin Deng, JuanLi Hu, Hehua Chi and Juebo Wu,” An Improved Fuzzy Clustering Method for Text Mining,” Second International Conference on Networks Security, Wireless Communications and Trusted Computing, pp. 65-69, 2010.
[6] Maryam hajiee,” A New Distributed Clustering Algorithm Based on K-means Algorithm,” 3rd International Conforence on Advanced Computer Theory and Engineering, pp. 408-411, 2010.
[7] Jiang Haiyan and DU Min,” Research on the Detection of Gold Immunochromatographic Assay by the Image Histogram Feature Vectors and Fuzzy C-means,”EightInternational Conference on Fuzzy Systems and Knowledge Discovery, pp. 467-471, 2011.
[8] JialunLin ,Xiaoling Li and Yuan Jiao,” Text Categorization
Research Based on Cluster Idea,” Second International Workshop on
Education Technology and Computer Science, pp.483-486, 2010.
IJSER © 2012 http://www.ijser.org