International Journal of Scientific & Engineering Research, Volume 2, Issue 1, January-2011 1
ISSN 2229-5518
Image Processing For Biomedical Application
Gauri Bhoite
Abstract— Karyotyping, a standard method for presenting pictures of the human chromosomes for diagnostic purposes, is a long standing, yet common technique in cytogenetics. Automating the chromosome classification process is the first step in designing an automatic karyo- typing system. However, even today, karyotyping is manually performed. Here we intend to automate Karyotyping completely. Karyotyping is a common technique in cytogenetics, to classify human chromosomes into 24 classes. Karyotyping can be used to predict genetic disorders or abnormalities in pre-natal stage which may happen to occur in future generation.
Index Terms— Classification, Feature extraction, Karyotyping, Segmentation, Straightening Algorithm.
—————————— • ——————————
Chromosomes analysis is an essential procedure for detecting genetic abnormalities in cells. Traditionally, cells are classified according to their karyotype ,which is a tabular array where the chromosomes are aligned in pairs. Karyotyping is a useful tool to detect deviations from normal cell structure since abnormal cells may have an excess or a deficit of chromosomes. Normal cells con- tain 46 chromosomes which consist of 22 pairs of similar, homologous chromosomes and two sex-determinative chromosomes (XY: male and XX: female). Normally, the procedure of assigning each chromosome to a class (karyotyping) is based on the visual scanning of chromo- some images by experts (biologists, cytogeneticists). This visual inspection is a time consuming process and expen- sive. Hence, many attempts have been made to improve visual analysis of chromosomes.
2 Perform segmentation of the metaphase image to separate out each chromosome
3 Application of the straightening algorithm to each
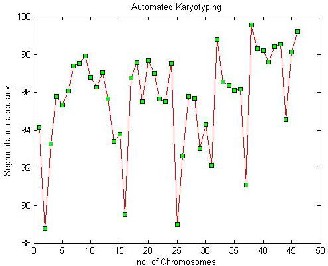
Fig. 1 Shows as the number of chromosomes increases the segmen- tatinon accuracy also increases.
separated chromosomes..
4 Extract features from each chromosome.
F From the segmented image obtained in above step a
chromosome is taken at a time. Greyscale chromosome
5 Classification of chromosomes based on the feature extracted
The goal of this stage is to create a mask of pixels to be classified. First the image gradient magnitude of the initial image is computed. In order to reduce the number of minima of the gradient magnitude we apply the grays- cale transform. The watershed transform is a popular segmentation method originated in the field of mathemat- ical morphology. The image is considered as a topograph- ical relief, where the height of each point is related to its grey level. Imaginary rain falls on the terrain. The water- sheds are the lines separating the catchment basins.
image is one in which an object (chromosome) is lying on a
uni-color background with a different gray scale value.. An effective threshold value to separate the object from the background can be determined by locating the global minimum of the histogram Using this threshold all those pixels with a gray value smaller than the threshold are set to 1 (white) and the remaining pixels are set to 0 (black) producing the binary format of the input image.For hori- zontal projection vector, the pixel values of each row are summed up in the binary image. Considering that the binary image includes only 1s (white pixels) and 0s (dark pixels). The location of the extracted global minimum in
the horizontal projection vector of the target image corre-
http:/I/JwSEwRw©.2ij0s10er.org
2 International Journal of Scientific & Engineering Research, Volume 2, Issue 1, January-2011
ISSN 2229-5518
sponds to the bending centre. The horizontal line passing through the point on the chromosome image represents the bending axis of the chromosome. The most outward intersecting point between the bending axis and the chro- mosome body is the so called bending centre of the curved chromosome.
The binary image is first separated into two sub-images along the bending axis. The two sub-images must now be rotated so that the two arms to be vertical. Now we apply the same procedure to the real gray scale image rather than its binary version. Next, the two aligned gray scale images of the chromosome arms must be connected to produce the final straightened chromosome picture
.
1. Length
The total length of the chromosome is obtained.
2 Centromeric index:
The centromeric index (C.I.) is the ratio of the length of the short arm to the whole length of a chromosome.
3 Normalized density profile:
Density profile is a one-dimensional graph of the banding pattern property of the chromosome computed at a sequence of points along the possi- bly curved chromo some medial axis. The density profile for a chromosome is obtained from mea- surements made along a transverse line, perpen- dicular to the tangent of the medial axis.
It is another significant morphological feature
used to identify the chromosome.
Neural Network; it is the second stage of initiation of the Multi-Layer Neural Network with Back-Propagation algorithm and the suitable architecture form, train and transfer functions.
After creating the Neural Network, the typical chromo- somes have been inserted in it to be the target in the train- ing process. The output of the segmentation algorithm, which will be an array of objects, will be converted from matrix form into vector form. This vector represents the new input to the Neural Network. This Neural Network uses Back-Propagation algorithm.cap.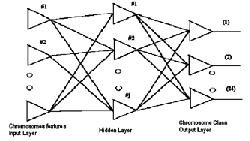
.
Fig.1 Neural network architecture for multilayer network.
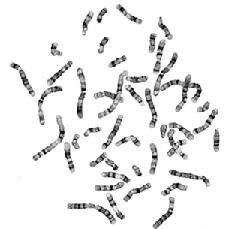
Fig.2 Metaphase stage of human chromosomes
Fig:3 Karyotyped image of human chromosome.
By using the following method we found that is an ef- ficient way of classifying the chromosomes. It introduces chromosome imaging and the concept of karyotyping. We studied various characteristics of chromosome images and features of chromosomes that are used for karyotyp- ing and classification
This work was supported by Birth Right Genetic Clinic, Pune and Denanath Mangeshkar Genetic Lab, Pune
[1] G. Agam, I Dinstein, “Geometric separation of partially overlapping non-rigid objects applied to automatic chromo- some classification,” IEEE Trans. Pattern Anal. Machine In- tell, vol.PAMI-19, pp. 1212-1222, 1997.
[2] B.Lerner, “Toward a completely automatic neural network based on human chromosome analysis, ”IEEE Trans. Syst.
Man Cyber.Special issue on Artificial Neural Network, vol.
IJSER © 2010
International Journal of Scientific & Engineering Research, Volume 2, Issue 1, January-2011 3
ISSN 2229-5518
28, pt. B, pp. 544-552, 1998.
[3] J. Liang, “Fully automatic chromosome segmentation,” Cy tometry,vol. 17, pp. 196-208, 1994.)
[4] Moradi, M., Setarehdan, S.K., Ghaffari, S.R., 2003b. Auto-
matic landmark detection on chromosomes_ images for fea- ture extraction purposes. In: Proceedings of the 3rd Interna- tional Symposium on.Image and Signal Processing and Analysis (ISPA 2003), pp. 567–570.
[5] Shin, F.Y., Pu, C.C., 1990. Medial axis transformation with single-pixel and connectivity preservation using euclidean distance computation.In: Proceedings of the 10th Interna- tional Conference on Pattern Recognition, pp. 723–725.
[6] Mehdi Moradi, S.KamaledinSetarehdan ,”New Features for Automatic Classification of Human Chromosome classifica- tion of Human Chromosomes:A feasibility study :, Science Direct Trans,August 2005.
[7] Mehrsan Javan roshtkhari,Seyed Kamaledin Setarehdan, “A
novel algorithm for straihtening highly curved images of uman chromomsome” ,Science Direct Trans,Februaury
2008.
[8] “A Multichannel Watershed-Based Segmentation Method for Multispectral Chromomsome Classification”,Petros
S.Karvelis, Alexandros T.Tzallas, Dimimtrios I. Fotiadis.
IJSER © 2010