𝜒 = 𝜇 − 1 = 𝐶′
International Journal of Scientific & Engineering Research, Volume 5, Issue 9, September-2014 1221
ISSN 2229-5518
1 Pure and Applied Physics Department, Ladoke Akintola University of Technology, P.M.B 4000, Ogbomoso, Oyo state, Nigeria.
daveajadi@yahoo.com
2 Department of Physics. The Polytechnic, Ibadan P.M.B 22, U.I post Office, Ibadan, Oyo state, Nigeria.
Correspondence viz: aremurichard@yahoo.com +2348032413944.
3 Department of Physical Science, Ajayi Crowther University P.M.B 1056,Oyo. Oyo State, Nigeria. olabodebobby@yahoo.com
The critical temperature and the magnetic susceptibility of Gadolinium (Ferromagnetic) were measured using Susceptometer. The critical temperature was determined by measuring the magnetic susceptibility as a function of temperature. The analysis of experimental results indicates that the bipolar magnet with strong tetragonal distortion in external magnetic field applied along the axis resembles the behaviour of the two dimensional Ising model on the rectangular lattices. The values of Critical temperature Tc, was found around 290.8K and 290.6K for 20x20 and 50x50 square lattices respectively. The susceptibility is the same for both square lattices and it is equal to 6.62x10⁻⁵.
Key words: Critical temperature, Ferromagnetic, Gadolinium, Lattice, Simulation, Susceptometer.
IJSER © 2014 http://www.ijser.org
International Journal of Scientific & Engineering Research, Volume 5, Issue 9, September-2014 1222
ISSN 2229-5518
![]()
𝜒 = 𝜇 − 1 = 𝐶′
𝑇−𝛩
(2)
Where 𝜒 and 𝜇 are magnetic susceptibility and magnetic
permeability respectively.
The magnetic susceptibility χ is a dimensionless proportionality constant that indicates the degree of magnetization of a material in response to an applied magnetic field.
Virtually all substances in nature exhibit cooperatively in one sense or another, some substances display critical phenomena by undergoing a change of phase in configuration space at some critical temperature.
Above the characteristic temperature Θ, called the Curie temperature, ferromagnetic substances become paramagnetic. The magnetization vector M then changes with temperature according to the Curie law [1]
Analysis of dynamic critical properties is a major problem in statistical physics and theory of phase transition [1,2]. The substantial progress achieved to date in this field became possible mainly through theoretical and experimental studies. Nevertheless, the development of a rigorous and consistent theory of dynamic critical phenomena based on microscopic Hamiltonians remains a challenging problem in the modern theory of phase transitions and critical phenomena [3,4]. The critical dynamics of magnetically ordered crystals, especially Gadolinium (Ferromagnetic), is characterized by a great diversity and complexity due to the importance of both exchange interaction and relatively weak relativistic effects (such as anisotropy and dipole-dipole interaction). The most essential factor of the latter kind is dipole-dipole interaction, which plays an increasingly important role as![]()
𝑀 = 𝐶 𝐵
𝑇
(1)
the critical point is approached. Note that the
aforementioned classification of universal dynamics
Where C is the Curie's constant, B is the magnetic flux and T is the absolute temperature. This law is valid when the magnetizing field is of relatively low intensity, far from the magnetic saturation of the substance. In the laboratory experiment, it is more convenient to make use
of the Curies-Weis law.
critical behaviour does not allow for any effect due to dipole –dipole interaction. Further analysis [5-7] have shown that theories taking
Taking into account dipole-dipole interaction predicts dynamics of two types, normal and stiff, each characterized by a specific set of critical exponents.
It is clear that experimental studies can hardly elucidate the current discrepancy between observations and predictions, because high-precision measurement of critical parameters is a very difficult task. Moreover, since almost any experimental result is due to the combined effects of all factors, their individual strengths and contributions are practically impossible to single out. The problem is also unlikely to be amenable to rigorous theoretical analyses in view of enormous mathematical difficulties.
In recent studies, method of computational physics has played an increasingly important role in dealing with complex issues of this kind. Highly accurate and reliable calculations of critical parameters can be performed by applying these methods, at least, in studies of static critical behaviour [8]. In particular, the advantages of Monte Carlo and molecular theory dynamics simulations include not only rigorous mathematical foundations and error control within their respective frameworks, but also the possibility of evaluating the relative importance of individual parameters.
The approach to ferromagnetism as a function of temperature is described by the Curie –Weiss law [4] which gives the magnetic susceptibility as a function of
temperature
IJSER © 2014 http://www.ijser.org
International Journal of Scientific & Engineering Research, Volume 5, Issue 9, September-2014 1223
ISSN 2229-5518
![]()
𝜒 = 𝜇 − 1 = 𝐶
𝑇𝐶
(3)
performed using a vibrating sample magnetometer (VSM),
an expensive piece of apparatus not readily available to all
Where 𝜒 𝑎𝑛𝑑 𝜇 are the magnetic susceptibility and
relative magnetic permeability of the material
respectively, C is a constant and TC is the curie or critical temperature. Equation (1) valid above the Curie temperature. The relative magnetic permeability of the sample can be written as
physics laboratories [8,9]. The technique used in this work to measure critical temperature and magnetic susceptibility has advantage over other technique due that it is an inductive, noncontact measurement. This method presents a rapid means of measuring samples without the need for current or voltages leads. Ac-susceptibility can
probe an entire sample volume and therefore it provides us![]()
𝜇 = 𝛾 𝐿(𝑇)
𝐿𝑜
(4)
with a volume average of the sample's magnetic response.
Where L(T) is the inductance of the coil at temperature T
and 𝐿𝑜 is the inductance of the coil without the sample.
This is not exactly the relative permeability since not all
the magnetic flux will couple to the sample. From equation (3) and (4)
−1
Thermistor and the thermometer were placed inside the oil bath at room temperature so as to calibrate the temperature controller. The technique presented in this work uses a pair of coils wound in opposition and placed in a time-![]()
d = �𝛾𝐿(𝑇) − 1�
𝐿𝑜
![]()
= 𝑇−𝑇𝐶
𝐶
(5)
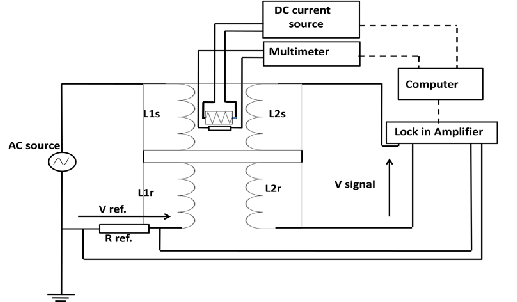
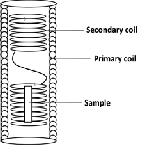
varying but spatially uniform magnetic field produced by
a homemade solenoid. Schematic of primary and
d is a linear function of the temperature T, characterized
by the slope 1/C and the intercept −𝑇𝑐�𝐶 . The left hand
side of equation (5) is zero when T =Tc. Thus, the
intersection of the straight line with the horizontal
(temperature) axis directly determines the value of the
critical temperature. The value of the constant 𝛾 does not
influence the position of the point of intersection.
AC susceptibility is the standard tool for determining the physics of superconductors, in particular for measuring critical temperature. In the normal state (above the critical temperature), superconductors typically have a small susceptibility. In the fully superconducting state, the sample is a perfect diamagnetic and so χ' = –1. Typically, the onset of a significant nonzero χ' is taken as the superconducting transition temperature. An example is the long-awaited detection of superconductivity in platinum, which was found to have a critical temperature in the 1 mK range for compacted powders [7].
Traditionally, Curie temperature measurements in ferromagnetic material, as well as critical temperature measurements of superconducting materials have been
secondary coils arrangement is presented in Fig.2. The sample (Gadolinium) and Thermistor are placed inside the coil together with a small piece of sponge rubber to hold everything in place. The whole assembly is then placed in a small beaker filled with mineral oil which serves as a heat sink. The controller programme MC363.exe located as an icon on the desktop is then open and initialize. The set temperature is entered into the upper left-hand box. The inductance of the coil as a function of temperature in steps of 0.1oC from 18oC to 28oC was noted. The temperature was changed slowly so that the sample temperature and Thermistor temperature stay in equilibrium. The inductance value was somewhere around
3 and 6mH. It was ensured that the temperature of the sample has stabilized before the inductance value was recorded.
Susceptibility was measured by applied an alternating current in the primary coil (figure 2), this induces a magnetization in the specimen (Gd) which in turn offsets the current in the secondary coil. The offset is proportional to the magnetic susceptibility of the
specimen.
IJSER © 2014 http://www.ijser.org
International Journal of Scientific & Engineering Research, Volume 5, Issue 9, September-2014 1224
ISSN 2229-5518
IJSER © 2014 http://www.ijser.org
International Journal of Scientific & Engineering Research, Volume 5, Issue 9, September-2014 1225
ISSN 2229-5518
Apparatus | Description |
Gadolinium sample | This is inform of a rod 7.50mm in diameter and 5.0cm long |
Coil | 2.54mH |
Thermocouple thermometer | Fluke model 51type K. with a range of -220oC to 1400oC. rated accuracy ± 0.1% |
Thermometric cooler | Model TCP -30 |
Programmable temperature controller | Model 5C7-362 |
Thermistor sensor | Model TS67, base resistance 15000Ω at 25oC. ± 0.1% |
Inductance meter | Metric model DLM-240, digital LCR meter. The inductance range from 200μH to 200H. |
IJSER © 2014 http://www.ijser.org
International Journal of Scientific & Engineering Research, Volume 5, Issue 9, September-2014 1226
ISSN 2229-5518
Coil geometry | Primary coil | Secondary coil |
Length of the coil | 150.00mm | 40.00mm |
Outer diameter | 6 5.00mm | 55.00mm |
Diameter of wire | 1.00mm | 0.28mm |
Number of turns | 3000.00 | 600.00 |
Number of layers | 16.00 | 5.00 |
Figure. 5 show the variation of in phase of Susceptibility
against Temperature. As the sample is cooled down from high temperature, the Susceptibilities are almost constant having a value of zero between 289 to 290.60 kelvin. The Susceptibilities starts' rising sharply and later descends, the two samples has a peak at 6.62x10⁻⁵ at temperatures
290.8K and 290.6K known as critical temperature, this reflects Feromagnetics nature of Gadolinium. Figure 6
.
shows the variation of AC susceptibility as a function of Temperature at different frequencies. It is worth noting that even at different frequencies considered for this study; the temperature is still within the range of Curie temperature of Gadolinium. 50Hz frequency has the lowest susceptibility around 9x10⁻⁵. Hence, Susceptibility of Gadolinium is directly proportional to frequency.
Gadolinium.
IJSER © 2014 http://www.ijser.org
International Journal of Scientific & Engineering Research, Volume 5, Issue 9, September-2014 1227
ISSN 2229-5518
![]()
𝐿𝑜−1
)−1 on temperature for 20x20 square lattice Gadolinium
IJSER © 2014 http://www.ijser.org
International Journal of Scientific & Engineering Research, Volume 5, Issue 9, September-2014 1228
ISSN 2229-5518
![]()
𝐿𝑜−1
)−1 on temperature for 50x50 square lattices Gadolinium
Figure 7 and 8 shows the measured valued of temperature dependence of d, the curves are in agreement with the expression of equation (5). The point of intersection
indicates the critical temperature 𝑇𝐶 for the two samples.
The values are 290.8K and 290.6K for 20x20 and 50x50
square lattices respectively. The value of 𝑇𝐶 is in good
agreement with the literature value. At lower temperatures
(Ferromagnetic phase) the function 𝑑 = 𝑑(𝑇) shows
different bahaviour, in accordance with theoretical
considerations.
We have studied the critical temperature and magnetic
susceptibility (Critical behaviour) of two square lattices Gadolinium using a magnetic susceptometer and AC magnetic Susceptibility scaling analysis. The work shows that a paramagnetic to ferromagnetic transition does take place at a critical temperature 290.8K and 290.6K for
20x20 and 50x50 square lattices respectively. The
Susceptibilities starts' rising sharply and later descends,
the two samples has a peak at 6.62x10⁻⁵. The work shows that melt spinning has created a two-phased system that has to some extent suppressed the long range interactions normally present in feromagnetics the values of critical temperature in this study is in good agreement with the literature value.
IJSER © 2014 http://www.ijser.org
International Journal of Scientific & Engineering Research, Volume 5, Issue 9, September-2014 1229
ISSN 2229-5518
[1] Kh. K. Aliev, I. K. Kamilov, Kh. I. Magomedgadzhiev, and M.-G. K. Omarov, Sov. Phys.
JETP 68, 1096 (1989).
[2] B.Stosic, S.Milosevic, and M.E. Stanley, "Exact results for the two dimensional Ising model in a magnetic field: Tests of finite-size scaling theory”, Physical Review B, 41 (1990) 11466-
11478
[3] L. Stodolsky and J. Wosiek, “Exact density of states and its critical behavior”, Nuclear
Physics B, 413 (1994) 813-826.
[4] S.-Y. Kim, “Yang-Lee zeros of the antiferromagnetic Ising model”, Physical Review Letters,
93 (2004) 130604:1-4.
[5] S. Ma, Modern Theory of Critical Phenomena (Benjamin, Reading, Mass., 1976; Mir, Moscow, 1980).
[6]. P. C. Hohenberg and B. I. Halperin, Rev. Mod. Phys. 49, 435 (1977). [7] I. K. Kamilov and Kh. K. Aliev, Phys. Usp. 41, 865 (1998).
[8]. M. Nikolo, Am. J. Phys. 63 January (1995)57.
[9]. D. Fisher and W. Franz, Am. J. Phys. 63 March (1995) 240.
IJSER © 2014 http://www.ijser.org