International Journal of Scientific & Engineering Research, Volume 5, Issue 9, September-2014 523
ISSN 2229-5518
Heavy Metal Concentration in Peri-urban Soils and Crops under Untreated Wastewater
Shazia Akhtar, Shazia Iram, M. Mahmood ul Hassan, Vishanda Suther, Rizwan Ahmad
Abstract-In present study four peri-urban agricultural areas (Multan, Kasur, Lahore and Gujranwala) were selected and surveyed. Total 138 Soil samples, 131 plants and 52 wastewater samples were collected. Soil samples were analyzed for their physiochemical parameters which were particle size distribution, pH, electrical conductivity, percentage organic matter, lime contents and heavy metals contents. Wastewater samples were analyzed for pH, electrical conductivity, chloride ions, carbonate, bicarbonate, sodium, potassium and heavy metal contents. Plants samples were also tested for heavy metals contents. Soil and effluent samples were also processed for fungal isolation. Results indicated that lead (Pb) and chromium (Cr) were found above than recommended permissible levels in Multan, Kasur, Lahore and Gujranwala soil samples. Whereasexceeded level of copper (Cu) was observed in Multan and Gujranwala locations. In overall assessment Pb and cadmium (Cd) was showing high level of contamination in the studied areas. Accumulation of metals in crops was also estimated with major problem of Cd in crops and fodder plants and incase of Kasur Cr was found maximum. Exceeded concentration of Pb, Cd and Cr was also observed in Lahore and Gujranwala. Maximum fungal diversity was found in Multan followed by Kasur, Lahore and Gujranwala peri-urban agricultural areas. Aspergillus is the main dominant and wide occurring genera in heavy metal contaminated samples which indicates its resistance towards harmful heavy metals. This preliminary assessment concludes that at vast scale remediation procedures required for the treatment of industrial, domestic and sewage wastewater and used for irrigation purposes.
Index term-Wastewater, heavy metals, contaminated soils, plant analysis
—————————— ——————————
1 INTRODUCTION
WITH the rapid process of urbanization, industrialization and economic development, fresh water
availabilityhas becomean important limitingfactor to people’s lives and agriculture. Alternatively farmers havebegun to use municipal and industrial effluent for irrigation purposes in peri-urban setting. Waste water application to agricultural land is a common practice as it contains organic matter and some essential plant nutrients like N and P which have fertilizers value [1]. Its application enhances soil productivity and improves soil physical conditions [2]. In addition to this, waste water application to agricultural land is also an alternative due to its practical and economic concerns [3].
Although, application of municipal and industrial effluents enhances crop yield and soil conditions, it contains high concentration of toxic heavy metal [4]. Long term application of untreated municipal and industrial effluent of high metal concentrations is elevation the metal concentrations in the soils. Therefore heavy metal contamination of arable land has becoming serious problem in peri-urban setting. [5].

• Shazia Akhtar: Ph.D student, Environmnetal Sciences Depatment, Fatima
Jinnah Women University, The Mall Rawalpindi. Shazoo_786@yahoo.com
051-9270050-203
• Shazia Iram, Environmnetal Sciences Depatment, Fatima Jinnah Women
University, The Mall Rawalpindi. M. Mahmood Ul Hassan, Vishanda
Suther, Rizwan Ahmad National Agricultural Research Center Islamabad.
051-90733128.
It is obvious that heavy metals are translocatedto food and fodder crops when grown in contaminated soils. Long term consumption of these contaminated crops having elevated metals concentrations can cause life threatening human health hazards. The application of untreated municipal/industrial effluents and solid wastes containing toxic metals contaminate the arable land and ultimately affects the biodiversity of that ecosystem [6]. Prolonged exposure to heavy metals such as copper, cadmium, lead, zinc, andnickel can cause harmful health effects in humans (Reilly 1991). Previous studies revealed carcinogenic effects of several heavy metals such as chromium (Cr), cadmium (Cd), lead (Pb), mercury (Hg) and arsenic (As) [7]. This is particularly a problem in densely populated developing countries where pressure on irrigation water resources is extremely great, including in Pakistan. As agricultural soils are already rich in heavy metals as aresult of the use of various agro-chemicals such as fungicides, herbicides, phosphate fertilizers, organic manureand the decaying plant and animal residues and old landfill sites (particularly those that accepted industrialwastes). The use of sewage sludge and waste water for irrigation further increases the concentration of heavymetals in agricultural soils. Estimation indicates that more than fifty countries of the world including Pakistanwith an area of twenty million hectares is treated with polluted or partially treated water [8]. Inpoor countries of the world more than 80% polluted water have been used for irrigation with only seventy to eighty percent food and living security in industrial urban and semi-urban areas [9]. In most of the developing countries, implementation of environmental guideline is not strictly followed, therefore factories release their discharge directly in to nearby sewer, drains and rivers which are mixed with ground water raising levels of
523
IJSER © 2014 http://www.ijser.org
International Journal of Scientific & Engineering Research, Volume 5, Issue 9, September-2014 524
ISSN 2229-5518
heavymetals, higher than the levels recommended by WHO and cross the limits NEQS [10]. This paper describes impacts of wastewater irrigation on heavy metal contamination of soil and crops grown in these soil in peri- urban areas.
2 MATERIALS AND METHODS
2.1 Sampling
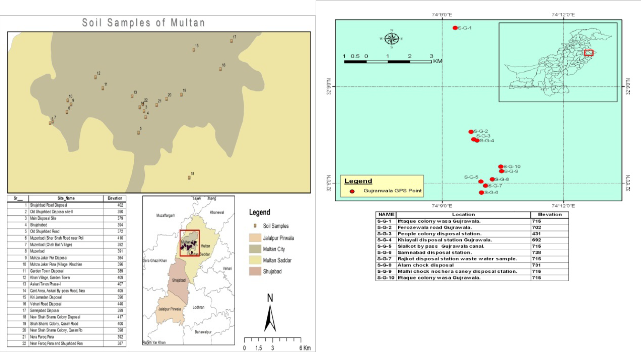
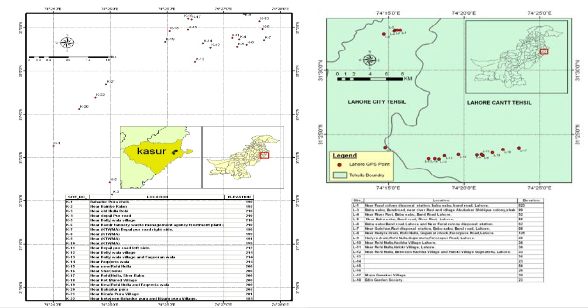
Peri-urban agricultural soils, plants, vegetables and effluents samples were selected and collected due to contaminations of heavy metals. In present study soil associated with vegetables, fodder crops and municipal/industrial effluents samples were collected from peri-urban areas of Multan, Kasur, Lahore and Gujranwala. Total 138 Soil samples, 131 plants and 52 wastewater samples were collected during April 2012 and March 2013.
2.2 Soil physiochemical analysis
Soil samples were air-dried, crushed and passed through 2- mm mesh sieve and stored at ambient temperature prior to analysis. Soil samples were analyzed for particle- size distribution by the hydrometer method [11], pH in a 1:2 soil to water ratio [12]. Other was determinate organic carbon [13] calcium carbonate. Total metal content in soil was measured after digestion. For digestion 1gram of soil was digested in teflon beaker using 30% H2 O2 , HF, HNO3 , HClO4 and HCl. The digested samples were filtered through quantitative acid-washed filter paper into 50 mL volumetric flask. The metal contents in aqueous solution were measured using atomic absorption spectroscopy with graphite furnace (PerkinElmer AAnalyser 800).
2.3 Water analysis
All wastewater samples were taken in clean dry plastic bottles which were first rinsed with the sample water atthe sampling site and then filled properly and preserved in refrigerator. Wastewater samples were pretreated with concentrated HNO3 to prevent microbial degradation of heavy metals. Electrical conductivity (EC) wasmeasured with the help of conductivity meter (Model-4070). pH was measured with the help of pH meter(Orion 720A+ ).
Soluble Na+ and K+ were determined by flame photometer. Carbonate (CO3-2) and bicarbonate (HCO3-) were determined by titration method against 0.05N H2 SO4 . Chloride was determined by titration method against 0.05
N Sliver nitrate (AgNO3 ) solution. Municipal/Industrial effluents were first filtered by using 0.45μm cellulose filter
paper and then analyzed through atomic absorption Spectrophotometer for the determination of Pb, Cd, Cr and Cu.
2.4 Plant (crop/vegetable) analysis
The freshly harvested mature vegetables were brought to the laboratory and washed primarily with running tapwater, followed by three consecutive washings with distilled water to remove the soil particles. Samples werecut into small pieces and dried in oven at 70 °C for 48 h and then ground to powder. 0.5 g each of vegetable samples was digested. A 0.5 g sample was digested by using Perchloric and Nitric acid mixture (1:2 ratio). Pb, Cu, Cr and Cd were analyzed by Atomic Absorption Spectroscopy (PerkinElmer AAnalyser 800
Model).
2.5 Isolation of fungal strains from soil and wastewater
Serial dilutions (from 10-¹ to 10-³) were carried out using test tubes. One gram of soil was dissolved in 9mlsterilized distilled water to form an aliquot then 1/1000 dilutions of sample were prepared and 0.5ml volumes were pippetted onto fairly dried surface of solidified Potato Dextrose Agar and incubated at 26°C for 7days [14]. Similarly 1 ml wastewater was poured and spreaded on plates in triplicates.Morphological studies were carried out by classical method in which the compound microscope was used atmagnification of 100X, 400X and 1000X in which characterization was done on the basis of conidia shape,conidia structure, presence of reproductive structures, measurement on hyphal color, septation and any othervisible structure [15]. Fungi were preserved in slants of PDA for further studies. The data was analyzed.
IJSER © 2014 http://www.ijser.org
524
International Journal of Scientific & Engineering Research, Volume 5, Issue 9, September-2014 525
ISSN 2229-5518
Multan Location Gujranwala Location
Kasur Location Lahore Location
IJSER © 2014 http://www.ijser.org
525
International Journal of Scientific & Engineering Research, Volume 5, Issue 9, September-2014 526
ISSN 2229-5518
3 RESULTS AND DISCUSSION
Soil quality can be monitored by a set of measurable attributes termed indicators. These indicators can be broadly grouped as physical and chemical indicators and one can assess overall soil quality by measuring changes in these indicators [16]. In the present study various physico- chemical properties of the metals contaminated soils of the peri urban agricultural areas were evaluated and these values were compared with the recommended permissible limits.
The selected physico-chemical properties which can be used as the indicator of the soil are presented in table 1.The pH values of all the soils samples analyzed from the four cities were close, ranging from 6.87 to 9.66 tending towards neutral or alkaline. Results of conductivity measurements were quite high with values ranging from 82.3-1751 µs/cm. These results indicates that at Kasur sampling sites movement of charge particles are more than other three
sites which is a good indicator for the growth of plants.
As the texture of the soil plays a very important role in
plant species establishment and development and also
influences physical parameters of the soil, the soil texture
class was evaluated for all the study sites. Soil texture
analysis resulted in 23.51% clay, 38.2 silt and 32.4% sand
contents in overall soil samples of Multan (table 1).Soil texture classification was based on the fractions of separates present in the soil, the main constituents (clay, silt and sand) of Kasur soil is given in table 1, Clay content was
observed 11.5-46.5%, silt 11.5-71% and sand 5-75%. In Lahore soil samples average clay content was 42.63% and silt and sand were found 39.91 and 17.44% respectively (table 1). Analysis of Gujranwala soils showedlay content was observed 31.8%, silt 29.9% and sand 36.2%.
Average percentage organic matter of soil samples was observed 1.7, 1.56, 0.96 and 1.12% for Multan, Kasure, Lahore and Gujranwala respectively. Calcium carbonates ranges from 10.00 to 42.63% in all sites of four areas.
TABLE 1
RESULTS OF PHSIOCHEMICAL CHARACTERISTICS OF SOIL SAMPLES.
Multan (n*=40)

pH EC O.M CaCO3 Clay Silt Sand

(µS/cm) (%) (%) (%) (%) (%)
Min 6.89 82.3 0.56 0 13.6 14.5 6
Max 8.99 943.1 2.8 41 47.5 69.2 65.3
Mean 7.45 351.4 1.7 12 23.51 38.2 32.4
Kasur (n=42)
Min 6.87 179.1 0.23 0 11.5 11.5 5
Max 9.43 1751 3.91 46 46.5 71 75
Mean 7.94 499.08 1.56 17.63 25.73 40.62 33.65
Lahore (n=36)
Min 9.03 141.9 0.40 4.50 17.5 2.5 2
Max 9.55 630 1.60 22.50 55 60 70
Mean 9.66 394.88 0.96 12.37 42.63 39.91 17.44
Gujranwala (n=20)
Min 7.3 225 0.8 2.5 10 13 19
Max 8.6 513 1.4 11.4 48 55 71

Mean 8.02 352.2 1.12 6.76 31.8 29.9 36.2
n=number of samples analyzed
3.1 Heavy metal analysis of soil samples
Total metal concentrations of selected heavy metals have been given in table 2. From the present study, It was observed that contamination of Pbwas found in soil samples collected from Multan, Kasur and Gujranwala where as soil samples collected from Lahore areas were
under safe limits. Pb concentrations were more in upper layer (0-6”) than lower layer analyzed (0-12”) in Kasur and Gujranwala. In Multan Pb concentration was exceeded in
5% soil samples collected from both depths than recommended permissible limits. Kasur showed 16 and 6% exceeded level of Pb in 0-6” and 6-12” depth respectively. Pb contamination was found in 40% soil samples collected
526
IJSER © 2014 http://www.ijser.org
International Journal of Scientific & Engineering Research, Volume 5, Issue 9, September-2014 527
ISSN 2229-5518
from upper layer of Gujranwala and 20% in samples collected from lower layer. Pb in these areas may be attributed to use of some pesticides and atmospheric deposition owing to it very closed surrounding of high vehicular traffic highways. Cd contamination was found in soils of all four areas. Multan was highly contaminated with Cd as Cd concentration was more than recommended permissible limits in 100% analyzed soil samples. Cd pollution level was observed higher in Gujranwala after Multan and then in Kasur and Lahore. Cu contamination was noticed in Multan and Gujranwala. Maximum Cu concentration (170.8 mg kg-1) was found in soil samples of Gujranwala. Cr pollution was observed in all four studied areas. Maximum Cr concentration (579 mg kg-1) was observed in Kasur where 100% analyzed soil samples were showing Cr concentration more than recommended permissible limit (table 2). Utilization of municipal and industrial wastewater for soil irrigation and its related effluents to land dates back 400 years and now it has become a common trend in many parts of world (Reed et
al., 1995). Worldwide it has been estimated that 20 million hectares of arable land is irrigated with wastewater. In some Asian and African cities, studies suggested that around 50% of vegetable supply is from the area which isirrigated with wastewater [17]. Sewage irrigation improved the form of soil aggregates and increased soil fertility to a certain extent under safe concentrations of heavy metals. The improvement of soil quality might result in a large amount of valuable nutrients in the sewage. Sewage irrigation can alleviate the water shortage to some extent, but it can also bring some toxic materials, especially heavy metals, to agricultural soils, and cause serious environmental problems. This is particularly a problem in densely populated developing countries. From the study it was concluded that Pb, Cd and Cr was found above than recommended permissible levels in Multan, Kasur, Lahore and Gujranwala soil samples. Whereas exceeded level of Cu was observed in Multan and Gujranwala only. In overall assessment Pb and Cd was showing high level of contamination in the studied areas.
TABLE 2:
TOTAL METAL CONCENTRATIONS (MG KG-1) OF SOILS OF MULTAN, KASUR LAHORE AND GUJRANWALA IRRIGATED WITH EFFLUENT.

Multan Kasur Lahore Gujranwala


0-6" (20a) 6-12" (20) 0-6" (21) 6-12"(21) 0-6" (18) 6-12" (18) 0-6" (10) 6-12"(10)
Pb
18.9-
Range 15.55-106. 21.15-107.4 28-236.1
18130 20.8-73.8 30-65.7 39.9-190.8 44.7-116.15
Means 45.37 42.8345 49.9 9580.5 36.203 47.572 96.295 77.1
Above RPL*
(%) 5 5 16 6 0 0 40 20
Cd
Range
3.85-
128.85 3.4-74.2 0.8-58.5 0.1-7.9 0.05-3.65 1-6.5 1.0-5.0 3-62.7
Means 23.1 16.30255 3.4 2.6 1.455 2.827 3.335 15.2
Above RPL
(%) 100 100 32 32 22.222 38.89 70 90
Cu
Range 24.15-601 17.3-79.8 12-58.9 6.55-57.95 21.85-46.2 2.5-37.6 11.45-615 20.45-292.65
Means 74.63 37.2395 26.4 29.2 33.119 21.652 170.865 89.83
Above RPL
(%) 15 0 0 0 0 0 50 20
Cr
Range
35.7-
433.57 25.1-382.1 86.2-5767 42.4-7004 53.2-119.8 45.95-107 47-310.8 70.2-326.2
Means 177.75 124.009 579 518.7 86.775 18.490 163.07 123.9
Above RPL

(%) 70 35 100 79 22.222 27.778 70 10
*Recommended permissible limits
IJSER © 2014 http://www.ijser.org
527
International Journal of Scientific & Engineering Research, Volume 5, Issue 9, September-2014 528
ISSN 2229-5518
A Number of samples
3.2 Physiochemical Analysis of Collected
Wastewater Samples
Physiochemical analysis effluent water showed that pH was in range of 6.6-9.25. Most of the samples were showing pH values in accordance to WHO limits (6.0-8.5) but few samples showed pH values above then permissible limits. Wastewater with high pH value is notsuitable for irrigation. At high pH most of the metals become insoluble and accumulate in the sludge and sediments. The toxicity of heavy metals also gets enhanced at particular pH(Kavitha et al., 2012).
Maximum EC was noticed in wastewater samples of Gujranwala. In present study, all the effluent samples showed EC above the limits prescribed by WHO (1400μS/cm) and hence they are unfit for irrigation .Thus suitable treatments are required before they are released to the sewage. Chloride ranges from 0.355 to 3195 mg L-1 in all four studied areas. Similarly this study showed various concentrations of carbonates, bicarbonates, sodium and potassium shown in the table 3.
Multan
TABLE 3
PHYSIOCHEMICAL ANALYSIS OF MUNICIPAL/INDUSTRIAL WASTEWATER.


pH EC Cl- CO3-- HCO3- Na+ K+ (dS/m) (mg/L) (meq/L) (meq/L) (ppm) (ppm)
Mean (n*=14) 7.3 6.3 251.2 21.4 1022.6 239 55.7
Minimum 6.6 1.4 99.3 0 432 76 17
Maximum 9.1 735 453.8 144 1596 480 154
Kasur
Mean (n=10) 7.3 8.8 8 0.8 10.1 21.2 29.4
Minimum 6.5 2.4 2.5 0.2 0 0 0
Maximum 8.8 22.7 16.5 2.8 17.6 59.9 59.9
Lahore
Mean (n=18) 8.39 1015.40 0.70 0.00 4.06 16.393 3.279
Minimum 7.78 2.12 0.3195 0 1 1.1 1.2
Maximum 9.28 1865 2.485 0 9 30.6 5
Gujranwala
Mean (n=10) 8.34 1292.16 0.586 0.00 4.1 19.68 5.28
Minimum 7.78 3.38 0.355 0 1 2.3 1.9

Maximum 8.95 1994 1.029 0 7 28.7 7.5
n= number of samples analyzed.
3.3 Heavy metals Analysis of wastewater
In Multan effluent samples data regarding metals content in untreated municipal/industrial effluents applied for irrigation are presented in table 4. Pb and Cd concentrations were found above the permissible limits given by FAO/WHO (2001) ( Pb 0.01 and Cd 0.065 mgL-1.
The range of Cd concentration was from 0.013 to 0.043 mgL-1
with anaverage value of 0.025 mgL-1. The concentration of
Cr in untreatedmunicipal/industrial effluents samples
collected from Multan peri-urban areas ranged from 0.051 to
0.370 mg L-1 with an average value of 0.225 mg L-1 (Table 4).
71% effluent samples were showing exceeded level of Cr.
According to [18]. standard guideline for wastewater irrigation, the maximum permissible limit of Cu is 0.2 mg L-
1. By comparing this limit, it was found that 50 percent samples were found above permissible limit.
In Kasur among all the analyzed samples Pb was found in
higher than permissible limits in 67% samples, while Cr
wasnoticed more than permissible limits in 36% wastewater
samples, Cd in 91% but in contrast to this Cu concentration
was found within the permissible limits (table4).
In the present study it was found that the range of Pb
concentration in untreated municipal/industrial effluents of
Lahore was found between 0 to 0.68 mgL-1 and an average
528
IJSER © 2014 http://www.ijser.org
International Journal of Scientific & Engineering Research, Volume 5, Issue 9, September-2014 529
ISSN 2229-5518
value was 0.450 mg L-1. 79% samples were above the permissible limit (0.065 mg Pb L-1).
The range of Cd concentration was from 0 to 0.033 mg L-1 with an average value of 0.0180 mg L-1. Incomparison with the standard guideline for wastewater irrigation, 89% samples were abovethe permissible limit (0.01 mg Cd L-1). The concentration of Cr in untreated municipal/industrial effluentssamples collected from Lahore peri-urban areas ranged from 0.022 to 16.59 mg L-1 with an average value of1.308 mg L-1 (table4). 63% samples were above the permissible limit (0.10 mg Cr L-1). The result regarding Cucontent16 % samples were foundabove permissible limit.
In Gujranwalathe range of Pb concentration in effluents was found between 0.488 to0.787 mg L-1 and an average value was 0.584 mg L-1. 100% samples were above the permissible limit. Thecadmium content in effluents used for irrigation in Gujranwala peri-urban areasare summarized in table 4. The range of Cd concentration from 0.018 to 0.26 mg L-1 with an average value of0.0523 mg L-1. 100%samples were above the permissible limit (0.01 mg Cd L-1). In case of Cr 90 % samples were above the permissible limit (0.10 mg Cr L-1). The range of Cu concentration was found from 0.0 to 0.018 mg L-1and all the samples were under permissible limits.
TABLE 4
METAL CONCENTRATIONS OF MUNICIPAL/INDUSTRIAL EFFLUENT USED FOR IRRIGATION


Metal Sites

Multan Kasur Lahore Gujranwala
Range Means Range Means Range Means Range Means
0.058- Pd 0.281
0.013- Cd 0.043
0.17
(93a) 0.031-0.199 0.175(67) 0-0.68 8.208 (79) 0.488-0.787 0.5836(100)
0.02
(100) 0-0.06 0.066(91) 0-0.033 8.797(89) 0.018-0.26 0.0523(100)
Cr 0.051-0.37 0.23 (71) 0-8.022 0.112(36) 0.022-16.59 9.430(63) 0.009-0.3 0.1914(90)
0.001-

Cu 0.075 0.03 (50) 0-0.007 0.101(0) 0-0.027 10.117(16) 0-0.018 0.0055(0)
IJSER © 2014 http://www.ijser.org
529
International Journal of Scientific & Engineering Research, Volume 5, Issue 9, September-2014 530
ISSN 2229-5518
Heavy metal analysis of collected plants
(crops/vegetables) samples
Heavy metals concentrations in vegetables and fodder crops grown in wastewater irrigated soils were given in table 5, 6, 7 and 8. (2001 FAO/WHO) and European Unioncommission suggested the critical level for vegetable and fodder are 0.3 mgKg-1 for Pb, 2.3 mg Kg-1 for Cd, 0.2 mg Kg-1for Cr and 10
mg Kg-1for Cu. In plants samples collected from Multan areas 95.56% plants samples were showing Pb concentration above than permissible limits. 100% samples were shwing exceeded levels of Cd and Cr. Whereas Cu was noticed more than recommended permissible limits in 26.67% plants samples in Multan area.
TABLE 5
METAL CONCENTRATIONS (MG KG-1) OF MULTAN VEGETABLE SAMPLES GROW N IN SOILS IRRIGATED WITH MUNICIPAL/INDUSTRIAL EFFLUENT.


Site/plant Lead Cadmium Chromium Copper

Multan Range Mean Range Mean Range Mean Range Mean
Chillies (n=3*) 0-19.1 6.37 1.2-19.4 7.33 9.9-23.3 14.6 6-9.3 8.13
Tomato (n=3) 0-28.5 10.47 4.9-36.5 21.1 13.6-33.4 22.3 4.5-6.7 5.6
Wheat (n=10) 0-35 15.06 0-66 16 0-527 101.9 0.8-19.2 4
Onion (n=7) 0-25 9.33 0-5.4 1.39 0-42.3 8.9 0.8-6.6 2.9
11.6-
Brinjal (n=2) 0.7-4.6 2.65 1.2-36 18.5 5.4-209 107.4
Spongegourd
14.6 13.1
(n=2) 0-10.3 15.5 0-2.8 1.4 3.3-36.5 19.9 8.2-11.5 9.85
Cabbage (n=1) 0 0 0-10.5 10.5 0-24.7 24.7 0-3.6 3.6
Corriander (n=1) 0 0 0-25.7 25.7 0.15.9 15.9 0-61 61
Okra (n=3) 1.9-15.4 7.77 0-35.6 22.4 0-132.1 65 7.4-8.3 7.8
Berseem (n=10) 0-10.8 3.38 0.1-64 9.79 3.2-32.2 9.4 6.7-19.2 11.5
Sorghum (n=3) 0-54 29.3 0-34 20.2 4.8-223 88.3 7.8-98 39
RPL 0.3 2.3 0.2 10

%> RPL 95.56 100 100 26.67
n= number of samples analyzed.
From Kasur a total of 23 plant samples (6 vegetables and 17
crops) were analyzed for their metal contents. Invegetables
maximum Cd content was observed in spinach that was 8.9
mg kg-1 which was very high ascompared to permissible
limit (0.2 mg kg-1). Similarly maximum Cr concentration was found in rice (291.6 mgkg-1) followed by pearl millet (95.9 mg kg-1). In case of Cu maximum accumulation was shown in rice crop (75.4 mg kg -1). Average Pd concentration in all the analyzed crops/vegetable samples was 5.50 mg kg-1 withmaximum accumulation in Maiz 14.8 mg kg -1. The
results showed that Pb was found more than recommendedlimits in 65% plants samples. Similarly 100% plants samples showed higher Cd concentrations. In addition tothis 22, and 91% plant samples were showing exceeded levels of Cu and Cr respectively. From the above resultsit is concluded that spinach is good candidate for accumulation of Cd, MaizfroPd, Rice for Cr and Cu.
IJSER © 2014 http://www.ijser.org
530
International Journal of Scientific & Engineering Research, Volume 5, Issue 9, September-2014 531
ISSN 2229-5518
TABLE 6
METAL CONCENTRATIONS (MG KG-1) OF KASUR VEGETABLE SAMPLES GROW N IN SOILS IRRIGATED WITHMUNICIPAL/INDUSTRIAL EFFLUENT.


Cd Cr Cu Pb

Crop/vegetable Mean Range Mean Range Mean Range Mean Range
Radish (n=2) 7.20 6.2-8.2 3.5 2.7-3.5 6.2 2-10.4 9.7 5.6-13.7
Rice (n=6) 7.30 7.1-7.6 52.7 2.4-5.8 24.2 3.5-75.4 3.3 0-6.99
Sorghum (n=4) 40.08 8.5-73 42.8 4.1-155.7 7.5 5.2-10.7 5.0 0-9.62
Maiz (n=2) 26.27 6.3-65 34.6 2.4-95.9 34.6 2.4-95.9 8.8 2.83-14.8
Pearl Millet (n=3) 26.27 6.3-65 34.6 2.4-95.9 6.8 5.8-8.2 6.0 0-18
Edible Arum (n=1) 7.80 - 0.5 - 13.8 - 0.0 -
Sweet potato (n=1) 7.10 - 43.6 - 8.7 - 9.6 - n= Spinach (n=1) 8.90 - 31.0 - 9.3 - 11.2 -

of Spinach (n=2) 7.90 6.9-8.9 30.8 30.6-31 8.2 7.1-9.3 10.9 10.6-11.2
number
samples analyzed.
A total of 33 plant samples (vegetables / crops) were analyzed for their metal contents from Lahore. In vegetables maximum Cd content was observed in barseem that was
1.397 mg kg-1 which was very high as compared to permissible limit (0.2 mg kg-1). Similarly maximum Cr concentration was found in oat (10.39mg kg-1) followed by barseem (9.47 mg kg-1). In case of Cu maximum accumulation was shown in wheat crop (11.898 mg kg -
1).Maximum average Pd concentration in all the analyzed crops/vegetable samples was found accumulated
incauliflower which was 5.55 mg kg-1 and with minimum accumulation in wheat 3.9.7 mg kg -1 . However it isabove than recommended permissible limits. The results showed that Pb was found more than recommendedlimits in 100% plants samples. Similarly 96.875% plants samples showed higher Cd concentrations. In addition to this 34.375, and
100% plant samples were showing exceeded levels of Cu and
Cr respectively. From theabove results it is concluded that
barseem is good candidate for accumulation of Cd, cauliflower for Pd, oat forCr and wheat for Cu.
TABLE 7
METAL CONCENTRATIONS (MG KG-1) OF LAHORE VEGETABLE SAMPLES GROW N IN SOILS IRRIGATED WITH MUNICIPAL/INDUSTRIAL EFFLUENT.


Pb Cd Cu Cr

Crop/vegetable Mean Range Mean Range Mean Range Mean Range
Mustard (n=5) 4.29 0.87-8.47 0.62 0.25-1.02 2.51 0.35-3.65 8.59 3.4-16.05
Berseem (n=9) 4.86 0-12.1 1.39 0-5.55 5.3 0.6-23.25 9.466 2.27-28
Wheat (n=11) 3.94 0-7.4 1.09 0.1-0.75 11.9 0-112.6 4.64 0-12.1
Turnip (n=2) 4.46 4.37-7.55 0.42 0.1-0.75 1.64 0.57-2.7 3.14 0.57-5.7
Cauliflower (n=1) 5.55 0.02 0.05 2.50

Oat (n=4) 4.281 0-9.2 0.55 0.25-0.97 2.87 0.3-5.17 10.31 4.8-15.07
n= number of samples analyzed.
From Gujranwala total of 30 plant samples (vegetables / crops) were collected analyzed for theirmetal contents. In vegetables maximum Cd content was observed in potato plant that was 5.75 mg kg-1 whichwas very high as compared to permissible limit (0.2 mg kg-1). Similarly
maximum Cr concentration was foundin cabbage (7.53 mg kg-1). In case of Cu maximum accumulation was shown in brinjal( 6.03 mg kg -1).Maximum average Pd concentration in all the analyzed crops/vegetable samples was found accumulated in Fenugreek/ methy which was 20.00 mg kg-1
531
IJSER © 2014 http://www.ijser.org
International Journal of Scientific & Engineering Research, Volume 5, Issue 9, September-2014 532
ISSN 2229-5518
and with minimum accumulation in cabbage which was 1.33 mg kg -1 .However it is above than recommended permissible limits.The results showed that Pb was found more thanrecommended limits in 100% plants samples. Similarly 100 % plants samples showed higher Cd
TABLE 8
concentrations.In contrast to this Cu accumulation was found lower than recommended permissible limits in all the plantsamples tested. In the case of Cr analysis 100% plant samples were showing exceeded levels Cr thanrecommended permissible limits.
METAL CONCENTRATIONS (MG KG-1) OF GUJRANWALA VEGETABLESAPLES GROW N IN SOILS IRRIGATED WITH MUNICIPAL/INDUSTRIAL EFFLUENT.


Pb Cd Cu Cr

Mean Range Mean Range Mean Range Mean Range
Berseem (n=4) 4.73 3.27-6.9 4.73 0.37-4.22 3.54 2.15-4.77 2.53 0.35-8.17
Onion (n=5) 3.43 1.52-5.5 1.22 0.3-3.5 2.26 0.32-4.6 1.91 0.27-3.6
Spinach (n=40) 5.50 3.2-8.95 1.55 0.025-3.5 3.27 0.67-6.52 4.81 1.57-9.2
Corriander (n=2) 6.05 2.45-9.65 1.21 0.95-1.47 2.90 1.35-445 5.34 1.17-9.5
Potato (n=1) 4.93 5.75 0.32 2.28
Mustard (n=2) 5.09 2.9-7.275 2.36 0.2-4.525 1.90 0.27-3.5 4.25 2-6.5
Brinjal (n=1) 4.35 0.65 6.03 7.00
Cauliflower (n=3) 2.49 0-3.77 4.54 1-12.1 1.66 1-2.9 6.47 5.72-7.82 cabbage (n=1) 1.33 0.43 1.10 7.53
Garlic (n=1) 5.33 1.28 3.80 1.40

Methy (n=1) 20.00 0.75 0.49 7.13 n= number of samples analyzed.
From the above results it is concluded that potato is good candidate for accumulation of Cd, Fenugreek/methyfor Pd, cabbage for Cr and brinjal for Cu. Detailed results of metal analysis of Lahore plant samples are given intable 8. For avoiding the possibility of contamination entering into humans through the food chain, furtherstudies are needed to determine the extent of heavy metals in edible plants and crops, which will be helpful toevaluate the health and safety of crop quality in sewage irrigation areas. Furthermore, because compoundcontaminations of organic pollutant and heavy metals are common in sewage (Gremionet al., 2004), organic pollutants in wastewater and irrigation areas need to be investigated as well as heavy metals. A study by [19] concluded Cd accumulation is directly proportional to summer season. Summer increasesthe probability of Cd accumulation and present study samples were collected in mid of April and highertemperature in Multan as compared to Islamabad. Similarly [20] reported high metals in vegetable samples irrigated with wastewater. A study conducted by Okoronkwo et al. (2005) proved that metalsbecome a part of food chain and ultimately result in high human and animal exposure of toxic elements via foodchain, ingestion of windblown dust or direct ingestion. The high quantity ofheavy metals accumulated in the soils and then their translocation to plants could badly affect their growth andproduction [21]. The elevated metal concentrations disintegrate organelles inthe cell and disrupt the outer membranes [22]. It also act as mutagenic substance
[23] causing the disorder in the physiological functions, i.e., photosynthesis [24] or through deactivating the respiration process, proteinformation and carbohydrate metabolism [25]. Living organisms are not able to prepare and adaptrapidly to a sudden and huge load of different toxic elements. Accumulation of certain elements, especially ofheavy metals with toxic effect, can cause undesirable changes in the biosphere bearing unforeseeableconsequences [26].
Isolation of Fungi from Collected Soil Samples Multan: A total of 11 fungal strains were isolated from soil samples collected from Multan areas. Highestcolony forming unit obtained was 92000 in sampling site 39. The lowest colony forming unit was found 2000 atsite 20 and 33. Aspergillusnigerwas found in all the sampling sites. The most widespread genera wereAspergillus, Acremoniumand Penicillium. The most common species were Aspergillusniger, Aspergillusflavusand Aspergillusterreus. Soil fungal diversity coming from Multan, Kasur, Lahore and Gujranwala datais useful in monitoring changes of microbial diversity caused by environmental fluctuations and pollution [27]. There are many factors influencing fungal diversity, such as nutrient quality, soil textureand chemical pollution of soil [28]. In this study, not all heavy metals reach obviouslydangerous concentrations but Cd and Cr are showing elevated concentrations, many factors including heavymetals and soil characteristics influencing fungal
532
IJSER © 2014 http://www.ijser.org
International Journal of Scientific & Engineering Research, Volume 5, Issue 9, September-2014 533
ISSN 2229-5518
diversity. If the concentration of heavy metals continued toincrease with further usage of the sewage, it would pose a threat to microorganism health and furthermore affectcrop production and ecological safety of the agriculture soil. Therefore, it is necessary to appropriately treat theheavy metals in sewage before irrigation. It is known fact that a chronic application of soil and water to heavymetals go ahead to considerable alteration of their microbial diversity, their activity, populations, and theirnumber. The isolated fungal isolates from Multan and Kasur belonged to genera Aspergillus, Curvularia,Acremonium, and Mucor.
Kasur: A total 12 strains were obtained from collected soil
samples of Kasur. Maximum colony forming unit(37333) was
found in soil sample collected from site 11 Near DepalPur
road left side and minimum colonyforming unit was observed at site 3 Near old NullaRohi (1333).Most common genera were Aspergillus, Mucor,Curvularia, Acremoniumand Penicillium. Most widely distributed fungal strains were AspergillusnigerandAspergillusflavus. The reasons underlying stress-related changes in the diversity of soil fungus populations,particularly those due to the presence of heavy metals, are not completely understood. It is a well known factthat heavy metals cannot be chemically degraded. A better understanding of the phenomenon behind thesechanges in fungal diversity, and mainly of those on which fungal adaptation and tolerance to metals are based, is
important, since such an understanding could facilitate the
management of these soil microorganisms forrestoration
and/or bioremediation program [29].
Lahore: A total 9 type fungal strains were obtained from collected soil samples of Lahore. Maximum colonyforming unit (24000) was found in two soil sampling sites of Lahore site-8 (Near Hadyra drain, RohiNulla,Gujumatchock,FarozpureRoad,Lahore) and site-
10 (Near RohiNulla,Kachha Village Lahore). Whereasminimum colony forming unit was observed at site-
11 (Near RohiNulla,Haloki Village, Lahore). Most common fungi found in agricultural soils of Lahore city were Aspergillusnigerand Aspergillusflavus.
Gujranwala: A total of 7 fungal strains were isolated from soil samples collected from Gujranwala agriculturalsoils. Highest colony forming unit obtained was 32000 at site-10 and in the depth ranging from 0-6. In contrastto this minimum colony forming unit was noticed at Site-5 which was 11000 and also in upper soil depth (0-
6”).AspergillusnigerandPenicillium sp. was found most
prevalent and in almost in all the sampling
sites.Environmental stresses brought about by the
contamination of heavy metals could be a reason for the
reductionin microbial species; however it can also increase
the population of few surviving species [30]. Thesoil samples collected from polluted sites were more affected by wastewater used for irrigation because of highmetal concentrations and hence affected the population density of
fungi. The differences between both thesampling sites in microbial population and diversity seem to be closely associated with the degree of heavymetal pollution. Generally, greater the soil and water heavy metal pollution lesser the microbial diversity[31]. reported that one gram of a fertile surface soil micro fungi are around 4×10⁵.
Isolation of Fungi from Wastewater Samples
Multan: A total of 8 fungal type strains were isolated from wastewater samples of Multan areas. Highest colonyforming unit was 44000/ml in sample site number 12. Wastewater samples showed minimum fungal diversitybut Aspergillusgenera remained dominant in all the samples. The results of water samples confirm that 239fungal species belong to genus Aspergillus, 8 species belong to genus Acremonium, 5 species belong to genusMucor, 4 species belong to genus Penicilliumand 3 species belong to genus Oidiodendron. Aspergillusniger,Aspergillusflavus, Aspergillusterreus, AcremoniumspMucorsp, Oidiodendronsp, Penicilliumsp were42.47%, 28.57%, 20.84%,
3.08%, 1.93%, 1.54%, and 1.15% while
Aspergillusfumigatusappears to be lessabundant among all the isolated fungi of wastewater.
Kasur: A total 5 types fungal strains were isolated from wastewater collected from Kasur. The mainlydistributed generas were Aspergillus, Mucorand Acremonium. .In case of wastewater samples of Kasur,maximum colony forming
unit was noticed in sample number 10 Near between BahadurPura and NizamPuraVillage and minimum in sample number 5 Near Kasur tannery waste management agency treatment plant. [32] investigated the fungal diversity in areas of Lahore, Islamabad, Faisalabad, WahCantt, Kasur andMultan. It has been reported that Multan soils are plentiful in Aspergillusnigerspecie and its colony formingunit (CFU) was low as compared to other sampling areas. A research was conducted by [33] in British soils, where 267 strains of actinomycete fungi were isolated. The study was carried out using selectivemedia at various pH levels. According to [33] a similar study was done in India in which metalresistant fungi were isolated from soil treated with waste water. It was found out that fungi belonged to generaAspergillus, Penicillium, Alternaria, Geotrichum, Fusarium, Rhizopus, Monillaand Trichoderma.
Lahore: A total 4 types fungal strains were isolated from wastewater collected from different locations ofLahore. The mainly distributed generas were Aspergillus, Mucorand Fusarium. The most dominating generawas Aspergillus.In case of wastewater samples of Lahore, maximum colony forming unit was noticed in samplesite one Near Fazal colony disposal station, babusabu, bund road, Lahore. Minimum colony forming unit wasnoticed in sample number 7 Near Gulshan,Ravi disposal station, Babusabu, Band road, Lahore.
Gujranwala: A total 4 types fungal strains were isolated from wastewater collected from different locations ofGujranwala. The mainly distributed generas were Aspergillusand Mucor.
IJSER © 2014 http://www.ijser.org
533
International Journal of Scientific & Engineering Research, Volume 5, Issue 9, September-2014 534
ISSN 2229-5518
The most dominating genera wasAspergillus.In case of wastewater samples of Gujranwala, maximum colony forming unit was noticed at twosampling sites 1 and 10 (Iftaque colony) but location 9 (Malhi chock nosherasaney disposal station) showedminimum colony forming units. CONCLUSION
Heavy metals Pb, Cd and Cr were found above than recommended permissible levels in Multan, Kasur, Lahoreand Gujranwala soil samples. Whereas exceeded level of Cu was observed in Multan and Gujranwala locations.In overall assessment Pb and Cd was showing high level of contamination in the studied areas. Accumulation of
metals in crops was also estimated with major problem of Cd
in crops and fodder plants and incase of Kasur Crwas found
maximum. Analyzed plants samples are also showing
exceeded concentration of Pb, Cd, Cu and Crin Lahore
whereas, in Gujranwala Pb, Cd and Cr was found above the permissible limits in contrast to this Cuwas noticed below the threatening level of concentration.
ACKNOWLEDGMENT
The research was conducted as part of a grant supported by the Pakistan Agricultural Research Council, Islamabad (Project No CS- 262). This financial support is greatly appreciated.
REFERENCES
1. Minhas, P. S. and Samra, J. S. ‘Quality assessment of water resources in Indo-Gangetic basin part in India’, Central Soil Salinity Research Institute, Karnal, India, p68, 2013.
2. Khurana MP, Pritpal S. Waste water Use in Crop Production
Resources and Environment Vol. 2(4), 163-618, 2012.
3. Cunningham, J.D., J.A. Ryan and D.R. Keeney. Phytotoxicity
and metal uptake from soil treated with metal amended
sewage sludge. J. Environ. Qual. 4: 55-460, 1975.
4. M. Mahmood-ul-Hassan, Vishandas, E. Rafique, R. Ahmad
and M. Yasin "Metal contamination of vegetables grown on soils irrigated with untreated municipal effluent" Bulletin of Environmental Contamination and Toxicology Vol:88 pp:204-209, 2012.
5. Mustafa, T. Determination of heavy metals in fish samples of
the middle Black Sea (Turkey) by graphite furnace atomic adsorption spectrometry, Food Chem., 80 (1),119-123, 2003.
6. Djukic, D. and L. Mandic. Microorganisms and technogenic pollution of agroecosystem. Acta. Agri.Serbica. 5(10): 37-44,
2000.
7. Trichopoulos, D. Epidemiology of cancer. In: DeVita, V.T. (Ed.), Cancer, Principles and Practice of Oncology. Lippincott Company, Philadelphia, pp. 231-258, 1997.
8. Mahmood, S. and A. Maqbool. Impacts of Wastewater
Irrigation on Water Quality and on the Health of Local
Community in Faisalabad Pakistan. J. Water Res.,10: 19-22,
2006.
9. Gulfraz, M., Afzal, A.A., Asrar, M. and Hayat, M.A. A study of water pollution caused by the effluents ofvarious studies located in the vacinity of Sohan River. Pakistan journal of science., 49(12): 13-1, 1997.
10. (Gulfraz, M., Y. Mussaddeq, R. Khannum and T. Ahmad.
Quality assessment of effluents from various industries at
vicinity of Rawalpindi and Islamabad. Journal of Biological
Science, 10: 697-698, 2002.
11. Gee, G. W., and J. W. Bauder. Particle-size analysis. Pages
IJSER © 2014 http://www.ijser.org
278–283 in R. C. Dinauer, editor. Methods of soil analysis. Part 1. Physical and mineralogical methods—SSSA book series no. 5. Soil Science Society of America, Madison, Wisconsin. Methods of Soil Analysis, Part 2: Chemical and Microbiological, 2006.
12. Mclean, E.O. Soil pH and lime requirement. In: Methods of
soil analysis. (Eds.): A.L. Page, R.H. Milelr and D.R. Keeney. Part 2. 2nd ed. Agron. 9: 209-223, 1982.
13. Nelson, D.W., Sommers, L.E. Total carbon, organic carbon,
and organic matter. In: Page, A.L., Miller, R.H., Keeney, D.R. (Eds.), Properties. American Society of Agronomy, Madison, WI, pp. 539–579, 1982.
14. Iram, S., Ahmed. I., N. K and Akhtar. S. Study of Fungi from
the contaminated soils of peri-urban agricultural areas. Pak.
J. Bot., 43(4): 2225-2230, 2011.
15. Zafar, S., Aqil, F. and Ahmad, I. Metal tolerance and
biosorption potential of filamentous fungi isolated from metal contaminated agricultural soil. Bioresour. Technol., 98:
2557-2561, 2006.
16. Dalal RC, Moloney D. Sustainability indicators of soil health
and biodiversity, In Management for sustainable ecosystems,
ed. P. Hale, A. Petrie, D. Moloney, and P. Sattler. Brisbane: Centre for Conservation Biology, University of Queensland. pp 101–108, 2000.
17. Bjuhr, J. Trace Metals in Soils Irrigated with Waste Water in
a Periurban Area Downstream, HanoiCity, Vietnem, Seminar Paper, InstitutionemarkvetenskapSverigeslantburk- o suniversitet (SLU),Uppsala, Sweden, 2007.
18. Anonymous. Codex Alimentarius Commission (FAO/WHO). Food additives and contaminants-Joint FAO/WHO Food Standards Programme. 2001,ALINORM
01/12A, pp. 1-289, 2001.
19. Sharmaa, R. K., Agrawala, M. and Marshall, F. (2007). Heavy metal contamination of soil and vegetables insuburban areas of Varanasi, India. Journal of Ecotoxicology and Environmental Safety. 66, 258–266, 2007.
20. Mapandaa, F., Mangwayanaa, E. N., Nyamangara, J., and
Gillera, K. E. The effect of long- termirrigation using wastewater on heavy metal contents of soils under vegetables in Harare, Zimbabwe. Journalof Agriculture, Ecosystem and Environment. 107: 151-165, 2005.
21. Moftah, A.E. Physiological response of lead polluted tomato
and eggplant to the antioxidant ethylene diurea. Menufiya
Agri. Res. 25: 933-955, 2000.
22. Stresty, E.V., Madhava and K.V. Rao. Ultrastructural alterations in response to zinc and nickel stress in the root cells of pigeon pea. Environ. Exp. Bot. 41: 3-13, 1999.
23. Sharmaa, R. K., Agrawala, M. and Marshall, F. . Heavy metal contamination of soil and vegetables insuburban areas of Varanasi, India. Journal of Ecotoxicology and Environmental Safety. 66, 258–266, 2007.
24. Van, A.F. and H. Clijsters. Effects of heavy metals on enzyme activity in plants. Plant Cell Environ. 13: 195-206,
1990.
25. Shakolnik MY. Trace elements in plants. Elsevier, NewYork, pp 140–171Djukic, D. and L. Mandic. 2000. Microorganisms and technogenic pollution of agroecosystem. Acta. Agri. Serbica. 5(10): 37-44, 1994.
26. Djukic, D. and L. Mandic. Microorganisms and technogenic pollution of agroecosystem. Acta. Agri.Serbica. 5(10): 37-44,
2000.
27. Staddon, W.J., Duchensne, L.C., Trevors J.T. Microbial diversity and com- munity structure of post-disturbance forest soils as determined by solem carbon-source utilization patterns. Microb. Ecol.34, 125–130, 1997.
28. Lakzian A, Murphy P, Turner A, Beynon JL, Giller KE.
534
International Journal of Scientific & Engineering Research, Volume 5, Issue 9, September-2014 535
ISSN 2229-5518
Rhizobium leguminosarum bv. viciae populations in soils with increasing heavy metal contamination: abundance, plasmid profiles, diversity and metal tolerance. Soil Biology and Biochemistry 34: 519-529, 2002.
29. Comis, D. Green remediation: using plants to clean the soil.
J. Soil Water Conserv. 51: 184-187, 1996.
30. Griffioen, W.A.J. Characterization of a heavy metal tolerant endomycorrhizal fungus from the surroundingsof a zinc refinery. Mycorrhiza., (4): 197-200, 1994.
31. Azaz, A.D. Isolation and identification of soil borne fungi in fields irrigated by GAP in Harran Plain using two isolation methods. Turk. J. Bot. 27: 83-92, 2003.
32. Iram, S., Ahmed. I., N. K and Akhtar. S. Study of Fungi from
the contaminated soils of peri-urban agricultural areas. Pak.
J. Bot., 43(4): 2225-2230, 2001.
33. Zafar, S., Aqil, F. and Ahmad, I. Metal tolerance and
biosorption potential of filamentous fungi isolated from metal contaminated agricultural soil. Bioresour. Technol., 98:
2557-2561, 2006.
IJSER © 2014 http://www.ijser.org
535