International Journal of Scientific & Engineering Research, Volume 5, Issue 1 2, December-2014 115
ISSN 2229-5518
Heat treatment effects on microstructure and magnetic properties of Mg–Zn ferrite prepared by Conventional ceramic method.
Kadhum. J. K.1, Atheer. I. A.2
Abstract—Fabrication of Mg1-XZnXFe2O4 (where x = 0.0, 0.2, 0.4, 0.6, 0.8, 1.0), samples using a Conventional ceramic method is prepared. Oxides of magnesium, zinc and iron with purity of about 99.99% were mixed with distilled water this mixture was dried in furnace at 150 ºC for 4 h. By using the Electric grinder for three minutes then ball milling machine for six hours the dried mixtures are ground to a fine powder. By using the sieve fine we got on fine particles with diameters (20) µm. The fine powder was pre-sintered (calcined) at 950ºC for 4 h and sintered at 1000°C,
1050°C and 1100°C. The magnetic and the crystal structure of the prepared Samples were identified using Microwave Measurement, X-Ray Diffraction analysis and scanning electron microscope (SEM). The X-ray diffraction analysis showed major peak at plane (3 1 1) of the cubic structure for all the ferrites. The largest value of density achieved was (4.375 gm.cm-3). Reflectance coefficient (S11) and transmission coefficient (S21), has measured using network analyzer device then the attenuation coefficient and absorbance were calculated at the X-band range (8-12.5
GHz), The SEM micrographs shows the uniform distribution of the particles.
Index Terms— Mg–Zn ferrite, Conventional ceramic method, ferromagnetic materials, magnetic properties.
—————————— ——————————
1. Introduction
Ferrites are usually non-conductive ferrimagnetic ceramic compound materials which contain oxygen and at least two magnetic ions in order to produce spontaneous magnetization, having chemical formula (AB2O4), where A and B represent various metal cations. Consisting of various mixtures of iron oxides such as Hematite (Fe2O3) or Magnetite (Fe3O4) and the oxides of other metals like NiO, CuO, ZnO, MnO and CoO.[1] Ferrites with the spinel structure are important materials for solid state microwave devices and for soft magnetic applications. The suitability of these materials depends on both the intrinsic properties of the material and the effects of grain size. There are many methods and technique used to prepare ferrites Samples such as Conventional ceramic methods, sol–gel methods, Solid state reaction method, Pulsed laser deposition techniques, hydrothermal processes and co-precipitation and many other methods. and techniques Conventional ceramic methods for
2. Experimental
The raw materials consist of MgO, ZnO and Fe2O3 according to their weight ratio were mixed with the distilled water this mixture was dried in furnace at 150 ºC for 4 h. By using the Electric grinder For three minutes then ball milling machine For six hours, the dried mixtures are ground to a fine powder. By using the sieve fine, we got on fine particles with diameters (20) µm. The fine powder was pre-sintered ( calcined ) at 950ºC for 4 h with heating rate (50ºC/min), then was left to be spontaneously cooling inside the furnace. The samples are crashed and ground again by using electric grinder to get fine powder. The powder was pressed at (102 MPa) by the piston oil to obtain samples as Parallelogram of (2.4×1.2×1.2) cm in Dimensions, where
————————————————
Kadhum. J. K. AL – Mustansiriyah University, College of Science, Department of Physics, Baghdad, Iraq. Kadhum57@yahoo.com
Atheer. I. A. School of Applied Sciences, University of Technology,
Baghdad, Iraq. atheer_alkfage@yahoo.com
the preparation of ferrites often yield less than ideal grain structure. A variety of other methods designed to retain a small grain size have been applied to the preparation of ferrites with the spinel structure [2]. It is because their magnetic properties are easy to control as it depends regularly on the variation of the compositions and cation distribution. Moreover it often has high permeability in the Radio-Frequency (RF) region, high electrical resistivity, mechanical hardness, chemical stability and reasonable cost [3] nowadays, ferrites have a primary position of economic and engineering importance within the family of magnetic materials because of their excellent physical properties [4]. Practically all TV sets, portable radios, long distance carrier telephone circuits are employing ferrite cores in filters, antennas and transformers [5]. Soft ferrites, in particular, are among the most widely used magnetic materials having low cost, high performance for high-frequency applications. Mn-Zn, Ni-Zn and Cu-Zn ferrites have many important applications in this context [6].
template was used for this purpose. The samples were sintered for 5 h at three sintering temperatures (1000ºC, 1050ºC, 1100 ºC) with the rate of heating (50 ºC/min), then were left to be spontaneously cooling inside the furnace. Refine the samples to make its dimensions (2.26×1.0×1.0) cm. Where these last dimensions are the dimensions of the network analyzer device chamber. In this work the X-ray diffraction analysis is used to characterize the crystal structure of the prepared samples, the magnetic properties which is attenuation coefficient and absorbance was studded by measuring the s-parameter which is Reflectance coefficient (S11) and transmission coefficient (S21) using tow port network analyzer device type Anritsu MS4642A-20 GHz.
3. Results and Discussion
3.1 X-Ray Diffraction Results
To investigate the crystal structure of the prepared samples after
sintering , phase analysis was done by x-ray diffraction (XRD) using Cu-Kα radiation type of (XRD -6000) which is made in Japan by SHIMADZU, and wavelength λ = 1.54060 Å ; the range of the Braggs
IJSER © 2014 http://www.ijser.org
International Journal of Scientific & Engineering Research, Volume 5, Issue 1 2, December-2014 116
ISSN 2229-5518

angles are taken (2θ=10˚- 50˚) for the Mg0.6Zn0.4Fe2O4 sample sintering at (1100 ˚C) , The (h,k,l) values which diffracts in X-ray spinels are (111) , (220), (311), (222), and (400) as show on figure (1). All the
planes are the allowed planes, which indicate the formation of single-
phase cubic spinel structure [7].The lattice parameter was calculated
√ (1)
0.94
using equation (1) which is standard relation for the cubic system [8] the
average grain size was calculated using Scherer’s Formula as in

g
cos( )
(2)
equation )2). [9] The micro strains are caused during the sintering stage, and will be raised from stretching or compression in the lattice to make a deviation in the a-lattice constant of the cubic structure from the ASTM value. So the strain broadening is caused by varying displacements of the atoms with respect to their reference lattice position [10]. This strain can be calculated from the equation (3) [11]:

| | (3)
Where Δ is the full width at half maximum in radian units, δ is the
micro strain The X-ray Diffraction (XRD) Results matched perfectly
with the international standard (ASTM) as shown in Table (1).
3.2 Scanning Electron Microscope Results.
The SEM micrographs of Mg0.6 Zn0.4 Fe2O4 sample sintering at (1100
°C) is shown in figure (2) indicate the distribution of grains the variation
in grain size can be attributed to the grain growth mechanism involving diffusion coefficients, sintering temperature and the concentration of
dissimilar ions. [12]. the grain growth mechanism is compromised between driving force for grain boundary movement and retarding force of pores and inclusion during the sintering process. The strength of the driving force depends on diffusivity of constituent ions [12].
3.3 Absorption Results
The absorbance tests of the Mg-Zn ferrite samples have been carried
out for all x values, where x= (0.0, 0.2, 0.4, 0.6, 0.8, 1.0), at the X-band range (8-12.5) GHz. The samples were sintered at 1000°C, 1050°C, and
1100°C, and the thickness of the samples is (10 mm). This study calculated the, attenuation coefficient and absorbance from the scattering parameters (S11 and S21), the scattering parameters are always measured in the form of decibel values (dB) to covert S parameters in the form of percentage (%); one must use the equation (3
- 4): [14-15]
| ⁄ (4)
| ⁄ (5)
The absorbance % can be calculated by substituting the result of
equation (4) and (5) in equation (6)
(6) The attenuation coefficient or reflection loss in (dB) unit is calculated from the equation (7). [15]
| | (7)
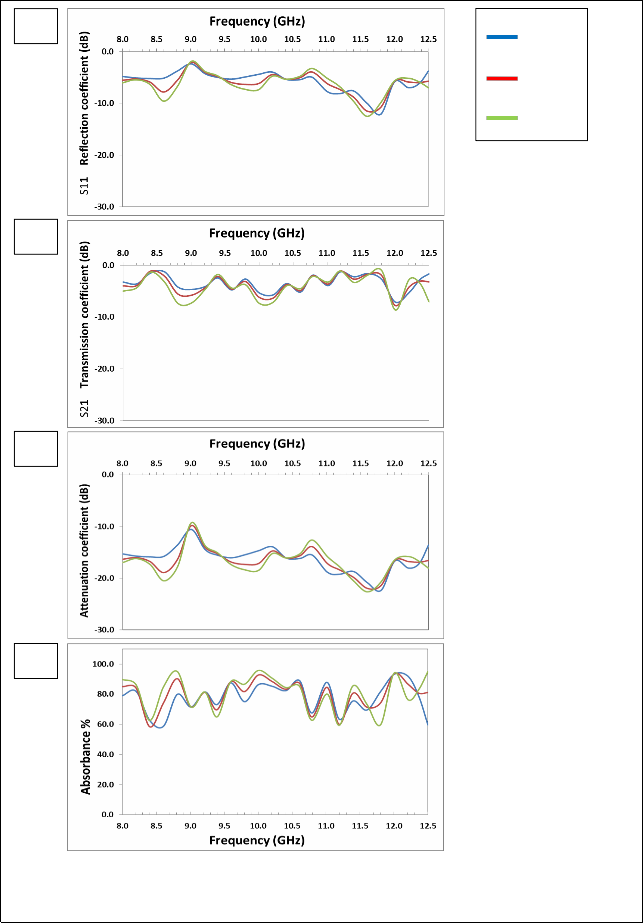
The figure (3-a) shows that there are two resonance peaks for the
ZnFe2O4 samples, these peaks are formed when there is matching between the relative permeability and relative permittivity of ferrite, and also one can note that the best values for the reflection coefficient is at 1100°C, due to the completion of ferrite in this class, as well as
3.4 Measuring the density and Porosity
The density of the prepared samples has been measured after a process
increased density which reduces the porosity. The highest values of the reflection coefficient at (1100 °C) are (-9.57, -12.50) dB at frequencies (8.6, 11.6) GHz respectively.
The figure (3-b) shows that the overlap of the values of transmission coefficient is at (1100°C) and (1150°C), which confirms formation the ferrite between these two temperatures. For ZnFe2O4, in the figure (3–c) showed the attenuation coefficient with frequency we note similarities between volatility and stability, with the figure and the best form of subsequent results because of the lack of the zinc. There are two resonance peaks for the ZnFe2O4 samples; the peak is formed when there is matching between the relative permeability and relative permittivity of ferrite, and also one can note that the best values for the attenuation coefficient is at (1050°C), due to the completion of ferrite in this class, as well as increased density which reduces the porosity. The highest values of the attenuation coefficient at (1150°C) are (-20.49, -
22.61) dB at frequencies (8.6, 11.6) GHz respectively.
The figure (3 – d) shows that the highest values of the absorbance are at
(1050°C), also one can note that increasing the values of attenuation coefficient has increased the values of absorbance. The overlap of the values of attenuation coefficient and the absorbance is at 1050°C and
1100°C in the X-band confirms formation the ferrite between these
two temperatures. The result of all other formulas of Mg-Zn ferrites will be reviewed in the table (2-5)

(8)

( ) (9)
of sintering in which the completely dry samples have been weighted,
and the size of the sample which is a Parallelogram is measured by
Where ρ is the Bulk density, ρx
is the X-ray density, P is the porosity, M
using micrometre.
The size is V (Parallelogram = length * width * height); then the density of the sample ρ is (ρ=m/V) where the mass (m) is measured by the unit of gram and V is measured by the unit of cm3.
Table (6) shows the practical density which has been obtained for samples of the Mg- zinc ferrite at different sintering temperatures.
In addition, the thermal treatment of the samples and the temperature of the sintering affect the measured density which increases proportionally with the temperature of the sintering; in other words, the density of samples greatly depends on the temperature of sintering [12-13].
The density also calculated from the the X-ray diffraction pattern parameters using the equation (8) in order to calculate the porosity using
equation (9).
is the molecular mass, NA is the Avogadro's number and a is the lattice
constant
4. Conclusions
The best value of sintering temperatures is at 1100°C which indicates that spinel ferrite needs sintering temperature of more than 1000°C for the complete formation of ferrite and gets best absorbance because of high temperature sintering which cancels all secondary phases that are made up with ferrite. The resonance peaks of three types of the spinel ferrite appearance at the same frequencies (8.60, 9.80, 10.00, 11.60) GHz. These peaks remain at the same frequencies with a different thickness for all types of ferrite, which indicates that the peaks are not related to thickness.
IJSER © 2014 http://www.ijser.org
International Journal of Scientific & Engineering Research, Volume 5, Issue 1 2, December-2014 117
ISSN 2229-5518
5. References
[1] Noorhana Yahya , American J. of Engineering and Applied
Sciences., 1 (2008), 54-57.
[2] R.A. Dunlap, A. Alghamdi, J.W. O’Brien a, S.J. Penney, Journal of
Alloys and Compounds 365 (2004) 84–88
[3] ZbigniewPe¸ Dzich, J. Eur. Ceramic Soc., 24 , (2004), 1053-1056.
[4] D. El Kony and S. A. Saafan , Journal of American Science 8 , (2012) ,10.
[5] Hashim Alimuddin M., , Shalendra Kumar, Sikander Ali , Koo
B.H., Chung H., Kumar R., J. Alloys Compd. 511 (2012) 107– 114.
[6] Thakur A., Mathur P. and Singh M., J. Phys. & Chem. Of solids 68 (2007) 378-381.
[7]S.A.Mazen, S.F. Mansour, H.M.Zaki published on line 15 June
(2003).
[8] Ladgaonkar,P.P.Bakare,S.R.Sainkar,A.S.Vaingankar, Material chemistry and Physics 69 ,(2001),19-24.
[9] C. Gümüs, O.M.Ozkendir, H. Kavak, and Y. Ufuktepe, J. Optoelectronics and Advanced Mater. , 8, 1, (2006), 299-303.
[10] J. G. Van Berkum , J. G. M. , A. C. Varmcuch , R. Delhen , Th. H. Dinkeijser , and E. J. Hemeijer , J. Appl. Crys. , 27, (1994) , 345-357 . [11]T. Obata , K. Komeda , T. Nakao , H. Ueba , and C. Tasygama , J. Appl. Phys. , 81 , (1997) , 199 .
[12] S.F. Demirdjoghlou, A.J. Pointon, "Microwave Properties of Low
Nickel- Gallium-Aluminium Ferrites ", Proc. IEE., 113, 3, (1966), 525. [13] A. Srivastava, P. Singh and M.P. Gupta, "Barium ferrites preparation by Liquid Mix technique and it's characterization ", Jour. Of Materials Scien ., 22, (1987) ,1989.
[14] Hand Book of Microwave Measurements. , 3 (1936) , 1105.
[15] MC Graw, Hill Copanies "Microwave Engineering" (2009) P 41.
Table 1: Listed the X-ray pattern parameters of Mg0.6 Zn0.4 Fe2O4 sample.
[h k | 2θº | d(Å) | 2θº | d(Å) | I/I | FWH | C.S | |
[220] | 30.3 | 2.947 | 30.16 | 2.960 | 39 | 1.29211 | 32.8 | 1.02 |
[311] | 35.6 | 2.516 | 35.52 | 2.525 | 11 | 0.30980 | 27.3 | 0.43 |
[111] | 18.5 | 4.790 | 18.31 | 4.84 | 7 | 1.24921 | 25.4 | 0.31 |
[222] | 37.1 | 2.416 | 37.15 | 2.418 | 6 | 25.270 | 16.9 | 2.85 |
[400] | 43.1 | 2.094 | 43.15 | 2.094 | 0 | 1.2222 | 34.5 | 0.00 |
Table 2: shows the reflection coefficient (S11) Result of Mg1-XZnXFe2O4 sample.
formula | No. of Resonance peaks | At sintering temperature | The highest Values of peaks in (dB) | at frequencies in (GHz) respectively | Overlap of curve between |
ZnFe2O4 | 1 | 1000 | -12.07 | 11.80 | 1050 and 1100 |
ZnFe2O4 | 2 | 1101 | -7.80,-11.50 | 8.60,11.60 | 1050 and 1100 |
ZnFe2O4 | 2 | 1100 | -9.57,-12.50 | 8.60,11.60 | 1050 and 1100 |
Mg0.2Zn0.8Fe2O4 | - | 1000 | - | - | 1000 and 1050 |
Mg0.2Zn0.8Fe2O4 | 2 | 1101 | -8.44,-11.32 | 8.60,11.60 | 1000 and 1050 |
Mg0.2Zn0.8Fe2O4 | 2 | 1100 | -12.45,-13.30 | 8.60,11.60 | 1000 and 1050 |
Mg0.4Zn0.6Fe2O4 | - | 1000 | - | - | - |
Mg0.4Zn0.6Fe2O4 | 2 | 1101 | -15.29,-17.53 | 11.01,11.60 | - |
Mg0.4Zn0.6Fe2O4 | 3 | 1100 | -11.61,-10.76,- 11.27 | 8.60,9.80,11.60 | - |
Mg0.6Zn0.4Fe2O4 | 1 | 1000 | -12.98 | 11.80 | 1050 and 1100 |
Mg0.6Zn0.4Fe2O4 | 3 | 1101 | -8.98,-10.24,- 10.81 | 8.60,9.80,11.60 | 1050 and 1100 |
Mg0.6Zn0.4Fe2O4 | 3 | 1100 | -11.27,-13.16,- 10.87 | 8.60,9.80,11.60 | 1050 and 1100 |
Mg0.8Zn0.2Fe2O4 | 0 | 1000 | - | - | 1050 and 1100 |
Mg0.8Zn0.2Fe2O4 | 3 | 1101 | -11.40,-11.36,- 10.09 | 8.60,9.80,11.60 | 1050 and 1100 |
Mg0.8Zn0.2Fe2O4 | 3 | 1100 | -19.03,-22.01,- 16.73 | 8.60,10.00,11.60 | 1050 and 1100 |
MgFe2O4 | 0 | 1000 | - | - | 1050 and 1100 |
MgFe2O4 | 3 | 1101 | -10.68,-10.05,- 10.60 | 8.60,9.80,11.60 | 1050 and 1100 |
MgFe2O4 | 3 | 1100 | -13.30,-8.82,- 10.74 | 8.60,9.80,11.60 | 1050 and 1100 |
IJSER © 2014 http://www.ijser.org
International Journal of Scientific & Engineering Research, Volume 5, Issue 1 2, December-2014 118
ISSN 2229-5518
Table 3: shows the transmission coefficient (S21) Result of Mg1-XZnXFe2O4 sample.
formula | No. of Resonance peaks | At sintering temperature | The highest Values of peaks in (dB) | at frequencies in (GHz) respectively | Overlap of curve between |
ZnFe2O4 | 1 | 1000 | -7.13 | 12.00 | all |
ZnFe2O4 | 1 | 1101 | -7.80 | 12.00 | all |
ZnFe2O4 | 3 | 1100 | -7.23,-7.17,- 8.64 | 9.01,1020,12.00 | all |
Mg0.2Zn0.8Fe2O4 | 1 | 1000 | -6.76 | 12.00 | all |
Mg0.2Zn0.8Fe2O4 | 2 | 1101 | -9.77,-6.61 | 9.59,12.00 | all |
Mg0.2Zn0.8Fe2O4 | 2 | 1100 | -9.71,-11.70 | 10.20,12.20 | all |
Mg0.4Zn0.6Fe2O4 | 2 | 1000 | -6.53,-8.45 | 10.20,12.20 | - |
Mg0.4Zn0.6Fe2O4 | 2 | 1101 | -6.22,-6.29 | 9.01,10.20 | - |
Mg0.4Zn0.6Fe2O4 | 2 | 1100 | -9.09.-9.12 | 9.01,10.20 | - |
Mg0.6Zn0.4Fe2O4 | - | 1000 | - | - | 1000 and 1050 |
Mg0.6Zn0.4Fe2O4 | 2 | 1101 | -6.98,-7.05 | 8.81,10.00 | 1000 and 1050 |
Mg0.6Zn0.4Fe2O4 | 2 | 1100 | -7.79,-7.69 | 8.81,12.00 | 1000 and 1050 |
Mg0.8Zn0.2Fe2O4 | 1 | 1000 | -12.32 | 12.20 | 1050 and 1100 |
Mg0.8Zn0.2Fe2O4 | 3 | 1101 | -4.82,-6.95,- 8.80 | 9.01,10.20,12.00 | 1050 and 1100 |
Mg0.8Zn0.2Fe2O4 | 3 | 1100 | -6.02,-7.90,- 6.30 | 9.01,10.20,12.00 | 1050 and 1100 |
MgFe2O4 | 2 | 1000 | -7.10,-9.41 | 10.20,12.20 | all |
MgFe2O4 | 2 | 1101 | -7.27,-10.37 | 10.20,12.20 | all |
MgFe2O4 | 2 | 1100 | -7.50,-13.55 | 10.20,12.20 | all |
Table 4: shows the attenuation coefficient Result of Mg1-XZnXFe2O4 sample.
formula | No. of Resonance peaks | At sintering temperature | The highest Values of peaks in (dB) | at frequencies in (GHz) respectively | Overlap of curve between |
ZnFe2O4 | 1 | 1000 | -22.33 | 11.80 | 1050 and 1100 |
ZnFe2O4 | 2 | 1101 | -18.89,-20.69 | 8.60,11.60 | 1050 and 1100 |
ZnFe2O4 | 2 | 1100 | -20.49,-22.61 | 8.60,11.60 | 1050 and 1100 |
Mg0.2Zn0.8Fe2O4 | - | 1000 | - | - | - |
Mg0.2Zn0.8Fe2O4 | 2 | 1101 | -19.86,-22.09 | 8.60,11.60 | - |
Mg0.2Zn0.8Fe2O4 | 2 | 1100 | -22.96,-23.46 | 8.60,11.60 | - |
Mg0.4Zn0.6Fe2O4 | - | 1000 | - | - | - |
Mg0.4Zn0.6Fe2O4 | 2 | 1101 | -24.56,-25.64 | 11.01,11.60 | - |
Mg0.4Zn0.6Fe2O4 | 3 | 1100 | -22.55,-21.98,- 22.33 | 8.60,9.80,11.60 | - |
Mg0.6Zn0.4Fe2O4 | 1 | 1000 | -23.28 | 11.80 | 1050 and 1100 |
Mg0.6Zn0.4Fe2O4 | 3 | 1101 | -21.43,-21.62,- 22.15 | 8.60,9.80,11.60 | 1050 and 1100 |
Mg0.6Zn0.4Fe2O4 | 3 | 1100 | -22.46,-23.62,- 22.20 | 8.60,9.80,11.60 | 1050 and 1100 |
Mg0.8Zn0.2Fe2O4 | 0 | 1000 | - | - | 1050 and 1100 |
Mg0.8Zn0.2Fe2O4 | 3 | 1101 | -22.15,-22.30,- 21.21 | 8.60,9.80,11.60 | 1050 and 1100 |
Mg0.8Zn0.2Fe2O4 | 3 | 1100 | -26.29,-27.47,- 25.27 | 8.60,10.00,11.60 | 1050 and 1100 |
MgFe2O4 | 0 | 1000 | - | - | 1050 and 1100 |
MgFe2O4 | 3 | 1101 | -21.35,-20.87,- 21.30 | 8.60,9.80,11.60 | 1050 and 1100 |
MgFe2O4 | 3 | 1100 | -23.11,-19.85,- 21.40 | 8.60,9.80,11.60 | 1050 and 1100 |
IJSER © 2014 http://www.ijser.org
International Journal of Scientific & Engineering Research, Volume 5, Issue 1 2, December-2014 119
ISSN 2229-5518
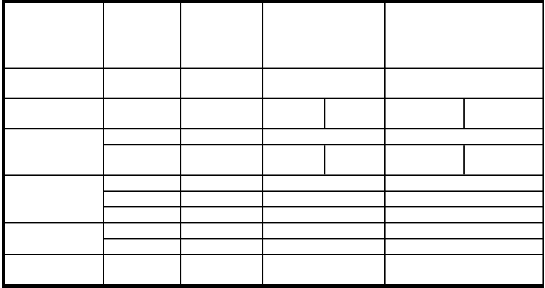
Table 5: shows the absorbance Result of Mg1-XZnXFe2O4 sample.
formula ZnFe2O4 | good bandwidth | At sintering | frequencies range | |
formula ZnFe2O4 | length in | temperature | in (GHz) | Absorbanc | e range % |
formula ZnFe2O4 | (GHz) | | | | |
formula ZnFe2O4 | - | - | - | - | |
Mg0.2Zn0.8Fe2O4 | 1.71 | 1100 | 10.00- 11.40- 10.61 12.50 | 89.56-92.58 | 93.52-96.32 |
1.40 1050 10.40-11.80 81.26-88.62
Mg0.4Zn0.6Fe2O4
2.23 1100 8.00-
9.22
9.60-
10.61 87.52-93.10 93.07-97.44
Mg0.6Zn0.4Fe2O4
Mg0.8Zn0.2Fe2O4
0.8 1100 9.80-10.60 88.56-93.46
1 1050 9.60-10.60 95.07-98.27
4.5 1100 8.00-4.50 91.28-98.42
0.61 1050 10.00-10.61 92.54-98.39
0.61 1100 10.00-10.61 87.18-93.41
MgFe2O4 - - - -
Table (6) listed the measured density of some samples
formula | sintering temperature | Bulk density (ρ) | X-ray density ( ) | Porosity% (P%) |
ZnFe2O4 | 1000 | 3.551 | - | - |
ZnFe2O4 | 1101 | 3.577 | - | - |
ZnFe2O4 | 1100 | 3.715 | - | - |
Mg0.2Zn0.8Fe2O4 | 1000 | 3.730 | - | - |
Mg0.2Zn0.8Fe2O4 | 1101 | 3.986 | - | - |
Mg0.2Zn0.8Fe2O4 | 1100 | 4.042 | - | - |
Mg0.4Zn0.6Fe2O4 | 1000 | 4.021 | - | - |
Mg0.4Zn0.6Fe2O4 | 1101 | 4.102 | - | - |
Mg0.4Zn0.6Fe2O4 | 1100 | 4.157 | - | - |
Mg0.6Zn0.4Fe2O4 | 1000 | 4.207 | - | - |
Mg0.6Zn0.4Fe2O4 | 1101 | 4.293 | - | - |
Mg0.6Zn0.4Fe2O4 | 1100 | 4.375 | 4.895 | 9.96 |
Mg0.8Zn0.2Fe2O4 | 1000 | 3.486 | - | - |
Mg0.8Zn0.2Fe2O4 | 1101 | 3.702 | - | - |
Mg0.8Zn0.2Fe2O4 | 1100 | 3.761 | - | - |
MgFe2O4 | 1000 | 3.269 | - | - |
MgFe2O4 | 1101 | 3.899 | - | - |
MgFe2O4 | 1100 | 4.343 | - | - |
IJSER © 2014 http://www.ijser.org
International Journal of Scientific & Engineering Research, Volume 5, Issue 1 2, December-2014 120
ISSN 2229-5518
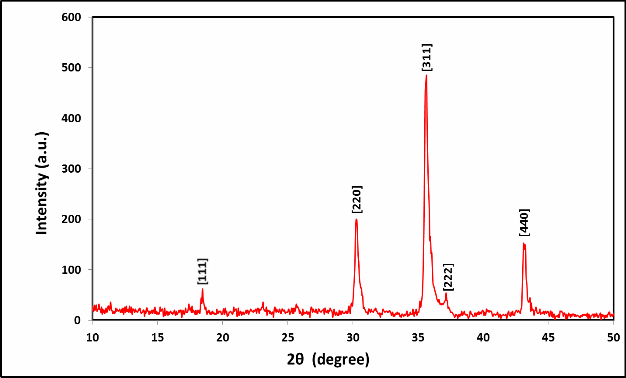
Fig. (1) X-ray pattern of Mg0.6 Zn0.4 Fe2O4 sample sintering at (1100 °C).
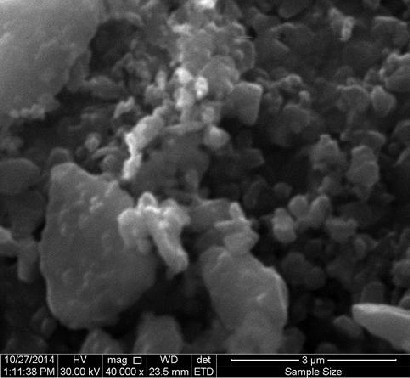
Fig. (2) Scanning Electron Microscope of Mg0.6 Zn0.4 Fe2O4 sample sintering at (1100 °C).

IJSER © 2014 http://www.ijser.org
International Journal of Scientific & Engineering Research, Volume 5, Issue 1 2, December-2014 121
ISSN 2229-5518
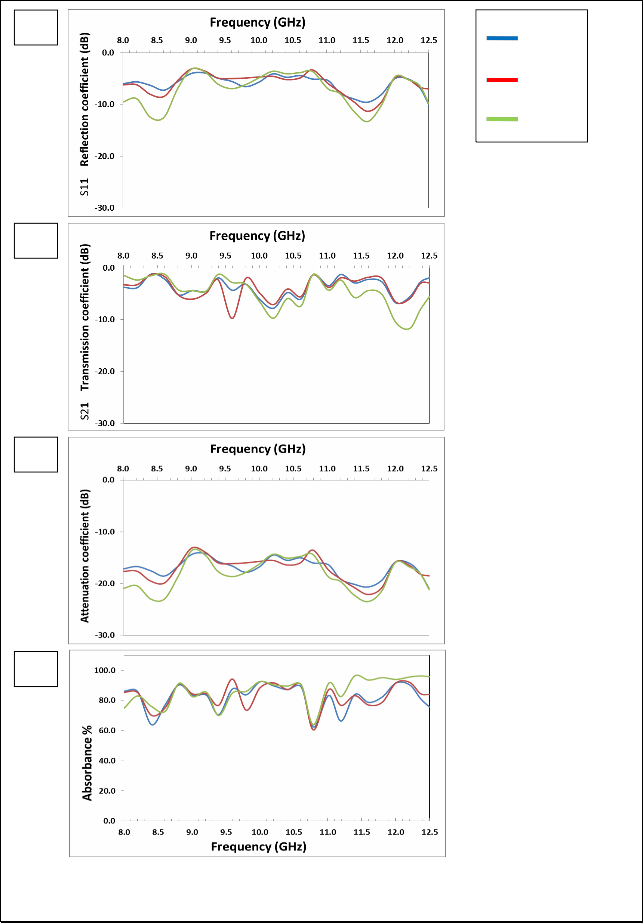
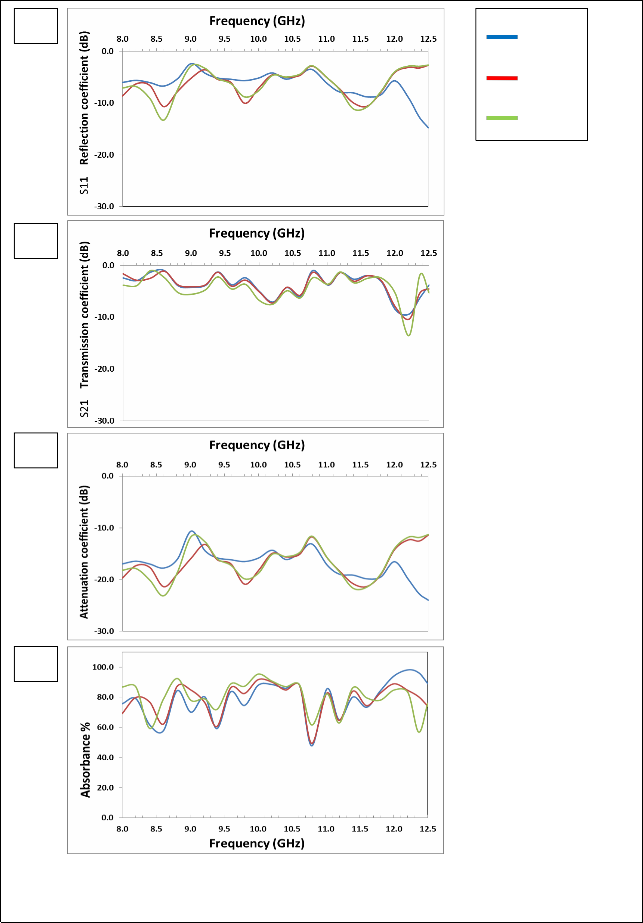
(a)
1000 OC
1050 OC
1100 OC
(b)
(c)
(d)
Fig. (3) Listed the reflection coefficient (S11), transmission coefficient (S21), attenuation coefficient and absorbance Curves as a function of frequency for MgFe2O4 samples prepared using Conventional ceramic method.
IJSER © 2014 http://www.ijser.org
International Journal of Scientific & Engineering Research, Volume 5, Issue 1 2, December-2014 122
ISSN 2229-5518
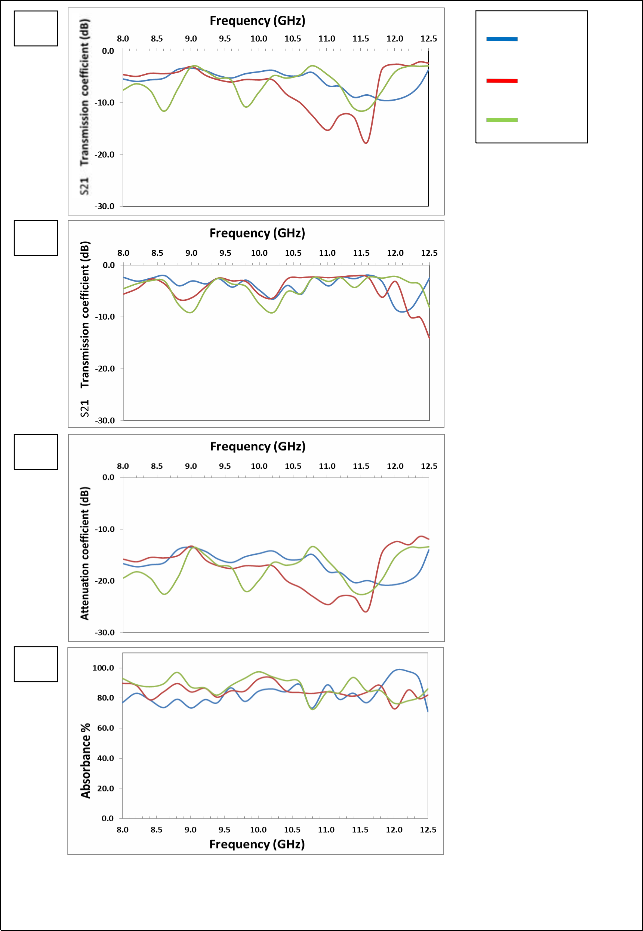
(a)
1000 OC
1050 OC
1100 OC
(b)
(c)
(d)
Fig. (4) Listed the reflection coefficient (S11), transmission coefficient (S21), attenuation coefficient and absorbance Curves as a function of frequency for Mg0.2Zn0.4Fe2O4 samples prepared using Conventional ceramic method.
IJSER © 2014 http://www.ijser.org
International Journal of Scientific & Engineering Research, Volume 5, Issue 1 2, December-2014 123
ISSN 2229-5518
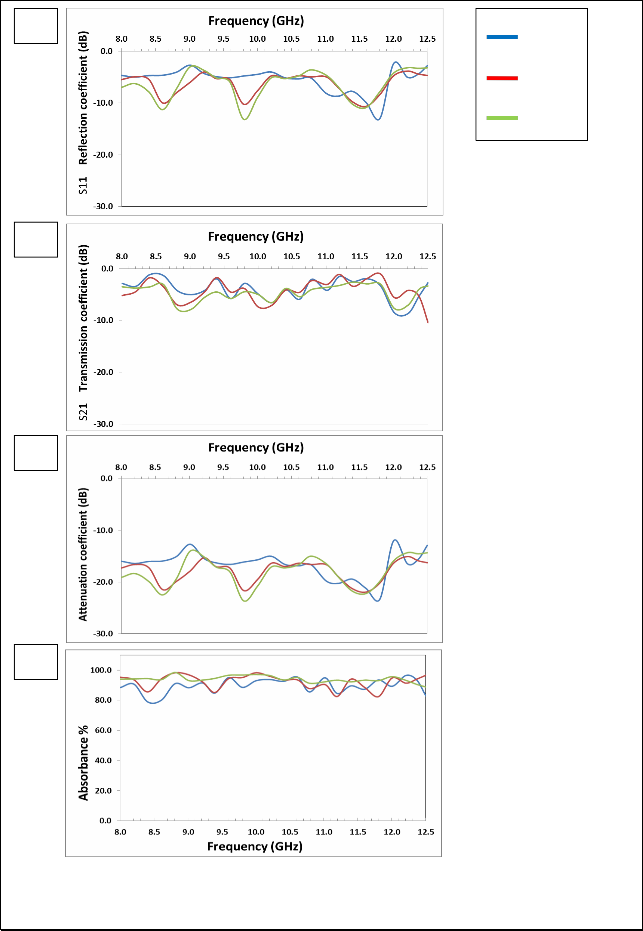
(a)
1000 OC
1050 OC
1100 OC
(b)
(c)
(d)
Fig. (5) Listed the reflection coefficient (S11), transmission coefficient (S21), attenuation coefficient and absorbance Curves as a function of frequency for Mg0.4Zn0.6Fe2O4 samples prepared using Conventional ceramic method.
IJSER © 2014 http://www.ijser.org
International Journal of Scientific & Engineering Research, Volume 5, Issue 1 2, December-2014 124
ISSN 2229-5518
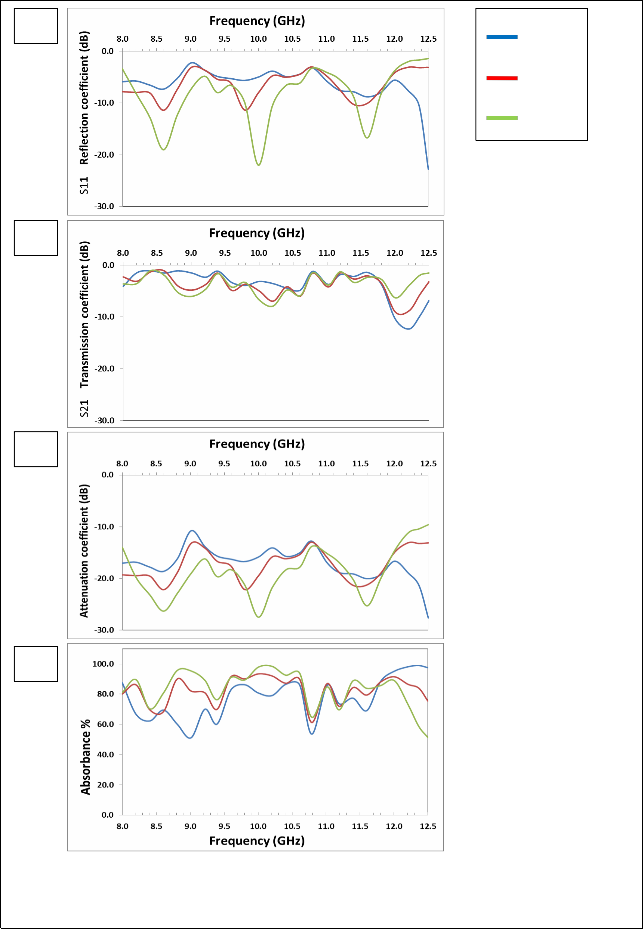
(a)
1000 OC
1050 OC
1100 OC
(b)
(c)
(d)
Fig. (6) Listed the reflection coefficient (S11), transmission coefficient (S21), attenuation coefficient and absorbance Curves as a function of frequency for Mg0.6Zn0.4Fe2O4 samples prepared using Conventional ceramic method.
IJSER © 2014 http://www.ijser.org
International Journal of Scientific & Engineering Research, Volume 5, Issue 1 2, December-2014 125
ISSN 2229-5518
(a)
1000 OC
1050 OC
1100 OC
(b)
(c)
(d)
Fig. (7) Listed the reflection coefficient (S11), transmission coefficient (S21), attenuation coefficient and absorbance Curves as a function of frequency for Mg0.8Zn0.2Fe2O4 samples prepared using Conventional ceramic method.
IJSER © 2014 http://www.ijser.org
International Journal of Scientific & Engineering Research, Volume 5, Issue 1 2, December-2014 126
ISSN 2229-5518
(a)
1000 OC
1050 OC
1100 OC
(b)
(c)
(d)
Fig. (8) Listed the reflection coefficient (S11), transmission coefficient (S21), attenuation coefficient and absorbance Curves as a function of frequency for MgFe2O4 samples prepared using Conventional ceramic method.
IJSER © 2014 http://www.ijser.org