International Journal of Scientific & Engineering Research, Volume 2, Issue 12, December-2011 1
ISSN 2229-5518
Growth Mechanism of SnO2 Nanomaterials De- rived From Backscattered Electron
Image and EDX Observations
Ronald de los Reyes, Gil Nonato C. Santos
Abstract—SnO2 nanomaterials were synthesized using the unseeded, non-catalytic horizontal vapor phase growth (HVPG) deposition. The sample was synthesized at a growth temperature of 1200oC and growth time of 6 hours. The resulting nanostructures ranges from nano- wires, nanorods to nanobelts as confirmed by JEOL JSM 5310-SEM. Backscattered electron image observations show that nanobelts has less intense brightness compared to nanorod and nanowire images. This suggests that the nanobelts are of lighter composition. Using
energy dispersive X-ray (EDX) analysis, it was confirmed that the nanobelts are oxygen deficient, being made up of SnO while the nanorods and nanowires are made of the more common SnO2. From these findings, a growth mechanism was proposed detailing the transition of the SnO2 nanostructures from the powder SnO2 source material.
Index Terns—growth mechanism, SnO2 nanomaterials, backscattered electron image, EDX, HVPG
————————————————————
1 INTRODUCTION
ynthesis of nanomaterials with controlled morphology, size and crystal structure is a key step towards nanotech- nological applications. Recently it has been shown that the horizontal vapor phase growth (HVPG) deposition is success- ful in synthesizing nanostructured SnO2 [1,2,3]. SnO2 is an n- type wide band gap semiconductor with rutile crystal struc- ture. It is a key functional material for optoelectronic devices, gas sensors [4], barrier layer for solar cells [5], anode material
for lithium-based batteries [6] and liquid crystal displays.
By understanding the growth mechanism by which nanomate-
rials are formed in HVPG, it may be possible to device ways in
the future on how to control or alter the growth kinetics of the
SnO2 nanomaterial.
In this work, SnO2 nanomaterials were grown via HVPG
and investigated using scanning electron microscopy (SEM).
During SEM analysis, the electrons bombarding the sample
interact with the sample in different ways. Signals are emitted
from all points in the sample, which carry out a distinct infor-
mation depending on the origin of the signal. Three common
signals that can be obtained are (1) secondary electrons (2)
backscattered electrons and (3) X-rays.
Secondary electrons are outer shell electrons dislodged by
energetic incident electrons and are produced by energy loss
of deflected electrons. These signals originate from the nano-
meter layer of the sample and are obtained to give topograph- ical observations and morphological information of the sam-
ple.
Backscattered electrons are produced by interactions be-
tween incident electrons and the sample’s atomic nuclei. The
intensity of the signal has a direct dependence on the mass
————————————————
Ronald de los Reyes, Master of Science in Physics, Lecturer, De La Salle
University-Manila, Philippines. E-mail: delosreyes.ronald@gmail.com
Gil Nonato C. Santos, Doctor of Philosophy in Materials Science, Profes-
sor, De La Salle University-Manila, Philippines. E-mail:
santosg@dlsu.edu.ph
number Z or the atomic number of the element comprising the sample as shown by figure 1. A backscattered electron image (BEI) of a specimen can give contrast depending on the mean atomic number of the constituent elements and is used to dis- criminate compositional information of the material.
Lastly, X-rays are produced by elastic collisions between primary electron beams and atoms approximately 1000 nm to a few microns deep with in the specimen. During irradiation of the sample by incident electrons, inner shell electrons of the specimen atom are ejected, leaving vacancies in the original position. To fill the vacancies, outer shell electrons are trans- ferred to fill up the vacancies and their excess energy is emit- ted as an X-ray. Since the energies of the individual shell elec- trons are determined by the type of elements, the X-rays gen- erated by the electron transfer are characteristic of the ele- ments. This is the characteristic X-rays of the element. The X- rays are used to identify the elements present on the sample.
2 EXPERIMENTAL SECTION
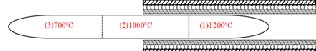
High Purity (99.99%) Merck SnO2 powder, of 35 mg mass was loaded into a closed-end quartz tube. The closed end quartz tube is then connected to the THERMIONICS High Vacuum System to lower the pressure inside the tube to ap- proximately 10-6torr. An appropriate mixture of oxygen gas and LPG is then used to seal the remaining open end of the tube. The tube was sectioned into three zones namely: zone 1, where the SnO2 powder is located; zone 2, which is the middle portion of the tube and zone 3, which is the opposite end of zone 1. A typical set-up of the quartz-tube and furnace set-up is shown in figure 1.
Figure 1: Cut-away view of the horizontal tube furnace-quartz
IJSER © 2011
http://www.ijser.org
International Journal of Scientific & Engineering Research, Volume 2, Issue 12, December-2011 2
ISSN 2229-5518
tube set up. Shown are the different zones and the correspond- ing temperature.
The tube was then loaded into the Thermolyne horizontal tube furnace with zone 1, completely inside the furnace. A temperature gradient was created by letting Zone 2 be at the opening and zone 3 completely outside the furnace. The tem- perature gradient across the length of the tube is monitored by a type-K thermocouple. The tube’s zone 1 was heated at
1200oC for 6 hours and allowed to cool down overnight. Dur- ing annealing, zone 2 has a temperature of 1000oC and zone 3 is at 700oC. The tube is then broken into fragments, with fluffy white products observed in the inner walls of the tube.
Surface and elemental analysis were performed using
JEOL 5310 scanning electron microscope (SEM) and Oxford ISIS energy dispersive X-ray (EDX) system respectively. Im- ages were obtained using the secondary electron and backscat- tered electron signals to obtain topographical and composi- tional information between observed nanostructures of SnO2. These observations were then related with the EDX results.
3 RESULTS AND DISCUSSION
Figure 2 shows a typical quartz tube fragment with the SnO2 deposit present in its inner walls. It can be observed that the SnO2 source material, which was initially confined only at one end, has been dispersed through out the length of the quartz tube.

Figure 2: Quartz tube fragment showing the deposited SnO2 nanomaterial in the inner walls
Figure 3 shows SEM images of the structures that were formed. Common structures observed are nanorods, nano- wires, nanobelts, and nanoparticles. Most of the nanomaterials are found in zone 2. Nucleation tips are observed in the nano- rods as shown in figure 4a. This suggests that the one dimen- sional structures, the nanorods and nanowires have under- gone vapor-liquid-solid (VLS) transition.
Figure 4 shows the backscattered electron image (BEI) of the SnO2 nanomaterials. From this figure, three sites are de- fined as follows: site 1, corresponding to the belt structure; site
2, corresponding to the rod structure; and site 3 corresponding to the background or the SiO2 substrate. There is a noticeable difference in brightness among the three sites, especially be- tween the rod and belt structure. This observation suggests that the belt is lighter in composition compared to the rod. The rod structure is also the brightest in the BEI, indicating that it is heavier in composition compared to any other portion in the
sample.

(a) (b) (c)
Figure 3, from Left to Right: (a) SnO2nanorod exhibiting the presence of a nucleation tip (b) SnO2 nanowires (c) SnO2 nano- belts and nanowires, with some nanoparticles
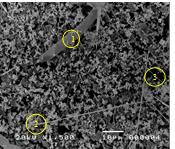
Figure 4: Backscattered electron image (BEI) of the sample showing three different sites: (1) gray area, corresponding to the belt structure; (2) bright area corresponding to the rod structure; (3) dark area corresponding to the background SiO2 substrate
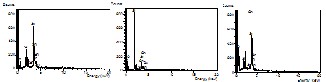
Figure 5a-5c shows the EDX spectra for figure 5’s sites 1, 2 and 3 respectively. The observed Si-peak is attributed to the quartz tube (SiO2) substrate. Table 1 on the other hand shows the atomic and element percentage composition for the 3 de- tected elements namely O, Sn and Si. From the percentage composition (Element %) results, a calculation can be per- formed to remove the oxygen contribution of SiO2, and extract the stoichiometric composition of SnO2. For site 1, the molar ratio is 4 O: 1 Si: 2 Sn. Removing the SiO2 contribution gives a
1:1 Sn to O ratio. This indicates that the belt structure is made up of SnO.
For site 2, it is shown that the elements have molar ratios of 30 O: 1 Si: 8 Sn. Removing the SiO2 contribution leaves a 1:7
Sn to O ratio. The corresponding rod structure therefore has excess oxygen compared with the usual Sn to O ratio of 1:2 or SnO2, which explains why it appears bright in the BEI.
For the percentage composition of site 3, the resulting mo- lar ratios of the elements are 20 O: 24 Si: 3 Sn. No oxygen atom will be left to pair with the Sn atom, after removing the SiO2 contribution. It is therefore identified that dark areas in the backscattered electron image is mostly SiO2 in composition with isolated Sn metal. This also explains why site 3 appears to be dark in the BEI because SiO2 is lighter than SnO2.
IJSER © 2011
http://www.ijser.org
International Journal of Scientific & Engineering Research, Volume 2, Issue 12, December-2011 3
ISSN 2229-5518
Figure 5 from Left to Right: (a) EDX spectrum for site 1 (b) EDX Spectrum for site 2 (c) EDX spectrum for site 3
Table 1: Element and Atomic Percentage composition from the
EDX results for sites 1, 2 and 3
| Site 1 (belt) | Site 2 (rod) | Site 3 (SiO2) |
Ele- ment | Ele- ment % | Atom ic % | Ele- ment % | Atom ic % | Ele- ment % | Atom ic % |
O K | 17.98 | 55.34 | 33.18 | 77.10 | 24.07 | 43.08 |
Si K | 7.94 | 13.92 | 1.96 | 2.59 | 49.60 | 50.56 |
Sn L | 74.08 | 30.74 | 64.86 | 20.31 | 26.33 | 6.35 |
Total | 100% | 100% | 100% | 100% | 100% | 100% |
At this point, it is interesting to look at what happened to the SnO2 powders inside the quartz tube during the growth process. As the quartz tube is heated at 1200oC, the SnO2 powders initially located at zone 1 of the quartz tube sublimes to vapor phase. During this process, decomposition of SnO2 would have occurred given by the equation:
2SnO2 (s) →2SnO (g) + O2 (g) (Eq. 1)
The SnO vapors are then transported, towards the cooler regions of the quartz tube aided by the thermal gradient along the length of the tube. The O2 in reaction 1 would have acted as a carrier gas for the SnO. Although SnO is relatively stable, it can spontaneously undergo the following disproportiona- tion reaction [7], almost simultaneously with the first
2SnO (g) →SnO2 (g) + Sn (l) (Eq. 2)
The vapor SnO would condense first to liquid state in zone 2 together with the liquid Sn metal. The Sn metal may act as a catalyst in this process and give way for the formation of SnO2 nanowires, and nanorods. After an initial period of nuc- leation and incubation, a crystallite will commonly develop into a three-dimensional object with well-defined low index crystallographic faces. The growth process eventually termi- nates when the temperature is below the melting point of about 1000oC, corresponding to zone 2 temperature. Another possible process that may lead to the formation of nanowires is the re-oxidation reactions:
SnO (g) + 0.5 O2 (g) →SnO2 (g) (Eq. 3) Sn (l) + O2 (g) →SnO2 (s) (Eq. 4)
Considering these two equations, it is evident that O2 pre- ferably reacts with liquid Sn rather than with the SnO vapors. Going back to the EDX result of site (3) of figure 5, the exis- tence of isolated Sn metal has been determined. This indicates that the concentration of O2 is limited in the present equip-
ment although a small leak is possible. As shown earlier from the backscattered electron image, the nanoparticles and nano- rods correspond to the bright field and EDX analysis shows that it is oxygen rich, therefore it must be made up of SnO2. The presence of nucleation tips in the SEM images of the na- norods also suggests that the Vapor-Liquid-Solid (VLS) me- chanism is responsible for the formation of the rods and other
1D structure. In addition, it can be said that reaction (2) may not always happen. For cases that the SnO vapor is stable, it may undergo deposition following the vapor-liquid-solid (VLS) or vapor-solid (VS) transition. From the backscattered electron image and EDX analysis, it was shown that the nano- belts are made up of SnO. Since there is no evidence of nuclea- tion tips for the nanobelt structure as shown by the SEM im- ages, it is safe to assume that the VS mechanism is responsible for the formation of the nanobelts.
4 CONCLUSION
SnO2 nanomaterials were synthesized using horizontal vapor phase growth deposition without a catalyst or a seed. The resulting nanostructures range from nanorods, nanowires, nanobelts and nanoparticles as confirmed by the SEM images. Backscattered electron images of the structures were obtained and related with the EDX results. It has been observed that the resulting nanobelts are oxygen deficient, made up of SnO while the nanorods and nanowires are made up of SnO2. With the knowledge of the composition of the source material, and the resulting nanostructure, a growth mechanism is for the formation of tin oxide nanostructures.
The results suggest that during crystal growth, the SnO2 source powder initially located in zone 1, sublimes to vapor phase and was transported to cooler regions in the quartz tube. The SnO2 undergoes dissociation to SnO and O2 with the O2 acting as a carrier gas for SnO and aided by the thermal gradient. Some of the SnO will undergo disproportionation reaction to form SnO2 and Sn. This results to the formation of nanowires and nanobelts. The process proceeds via Vapor- Liquid-Solid (VLS) transition, as shown by the nucleation tips found on the nanorods. On the other hand, some SnO that won’t undergo dispropotionation reaction will be deposited directly as SnO. There are no evidences of a nucleation similar to those of nanorods for the nanobelts and it is suggested that nanobelt formation undergoes Vapor-Solid (VS) transition. Energy dispersive X-ray analysis and backscatterd electron images of the nanomaterials confirm that the nanowires and nanorods are oxygen rich which suggest that it is composed of SnO2. On the other hand, it is found that nanobelts are oxygen deficient, which suggest that it is made of SnO. The substrate’s EDX analysis confirms that is mostly made up of SiO2 and there are isolated Sn metal deposited to it.
ACKNOWLEDGMENT
This work was supported in part by a grant from the Depart- ment of Science and Technology-Science Education Institute, Philippines.
IJSER © 2011
http://www.ijser.org
International Journal of Scientific & Engineering Research, Volume 2, Issue 12, December-2011 4
ISSN 2229-5518
REFERENCES
(1) VT Ngo, GNC Santos, RV Quiroga and A Salvador, “Syn- thesis of Tin Oxide Nanomaterial Using the Vacuum De- position Technique” in Proc. of the
25thSamahangPisikangPilipinas, Los Banos, Laguna, Phil- ippines: 20; 2007.
(2) S Sowl, A Co, V Ngo, GNC Santos, R Pobre, RV Quiroga and A Salvador, “Beaklike SnO2 Nanorods with Fluores- cence and Photoluminescence Properties”, in Proc of the
25thSamahangPisikangPilipinas, Los Banos, Laguna, Phil- ippines, 16, 2007.
(3) GNC Santos, V Ngo, PM Ong, R De Los Reyes, and RV Quiroga, “Growth, Structure Evolution and Thermal Properties of SnO2 Nanomaterial” in Proc. Of the
25thSamahangPisikangPilipinas, Los Banos, Laguna, Phil- ippines: 20; 2007.
(4) OK Varghese, LK Malhotra. Sensors Actuators B53: 19;
1998.
(5) S Ferrere, A Zaban , BA Gregg. J PhysChem 101: 4490;
1997 .
(6) J Zhu, Z Lu, ST Aruna, D Aurbac, AGedanken. ChemMa- ter 12(9): 2557; 2000.
(7) MS Moreno, G Punte, G Rigotti, RC Mercader, AD Weisz, MA Blesa, “Kinetic study of the disproportioation of tin monoxide” Solid State Ionics, 144, 81-86;2001.
IJSER © 2011
http://www.ijser.org