International Journal of Scientific & Engineering Research Volume 4, Issue 1, January-2013 1
ISSN 2229-5518
Prof.P.Natarajan, N.Soniya, Prof.N.Krishnan
Abstract--Image fusion is the process of combining two images into a single image, while retaining the important features of each image. The resulting image contains more information as compared to individual images. Multiple image fusion is an important technique used in military, remote sensing and medical applications.The result of image fusion is a new image that is suitable for human & machine perception. The histogram equalization method is useful in images with backgrounds and foregrounds that are both bright or both dark. In particular, the method can lead to better views of functional and structural parts in MRI and CT images. Different methods of image fusion are described that includes adaptive histogram equalization. Based on this methodology, the system is evaluated and the accurate output will be produced. The fusion algorithm of foreground images and background images is studied. Here, the foreground image is MRI and background image is CT image whereby the fusion rule selection is applied on them.
Keywords - Image Fusion, Functional Images, Anatomical Images, Adaptive Histogram Equalization.
—————————— —————————
image has to be displayed in the equalized form of images and finally, the histogram of foreground and background
image after equalization has also been plotted. The work of
The objective of image fusion is to combine the original input images to produce a different form of multiple images of pixel as an output. The result of this fusion methodology is a new enhanced and detailed image, which is suitable for human & machine visual perception [1]. There are different medical imaging modalities that are needed to be fused to get an exact vision of the detection of different diseases. By fusing the different images, more precise and abundant diagnostic information will be obtained. Foreground is a functional image displaying the non-anatomical information [3] whereas the background provides the anatomical information without functional activity. Space resolution of foreground image and the background image are based on the analysis of the image pixels. Hence both the images are fused to obtain a unique image with functional and anatomical information [3] and with the best resolution. Histogram Equalizer (HE) is one of the methodologies, which is used to detect the specified diagnosis of that particular image. Especially, Adaptive Histogram Equalizer (AHE) gives the clear and accurate diagnosis of the output image.
Initially, foreground image and background image are taken as an input and with these input, histogram equalization has to be done. The histogram of foreground image and as well as the background image [3] before equalization has to be analysed and plotted. Now, the
adaptive histogram of these foreground and background
the edge detection also plays a major role in deciding the result of the final processed image. Conventionally, edge is detected according to algorithms like sobel algorithm, prewitt algorithm, canny algorithm, roberts algorithm and laplacian of gaussian algorithm [5]. In real world applications, this edge detection is very much useful for the medical images that contain objects for the diagnosis of the diseases.
————————————————
Prof.P.Natarajan is currently pursuing Ph.D program in Bharathiyar
University, India, PH.+919443645196. E-mail: pnatarajan@vit.ac.in.
N.Soniya is currently pursuing master degree program in VIT University,
India, PH.+918098454942. E-mail: soniya.nagashanthi@gmail.com .
Dr.N.Krishnan is currently working as professor of Information
Technology and Engineering, Manonmaniam Sundaranar University, Thirunelveli,India,PH.+914622333212, e-mail: krishnancite@ieee.org
Histogram equalization is a technique that allows us to improve the contrast of images with such narrow histograms and it has been found to be a powerful technique in image enhancement [6]. This technique does not change the values contained in the matrix x (m, n) that represents the image. Instead, it modifies the color
IJSER © 2012 http://www.ijser.org
International Journal of Scientific & Engineering Research Volume 4, Issue 1, January-2013 2
ISSN 2229-5518
mapping associated with the values of the matrix x (m, n), so that this tends is uses to evenly every color in the full dynamic range [black to white].
The histogram of an image represents the relative frequency of occurrence of the various gray levels in the image [7]. Below you can see the histograms of two black and white images. Foreground and background images i.e MRI and CT images and it is considered as a functional and anatomical images, For black and white images have 256 gray levels, from 0 to 255, and the vertical lines in the histogram indicate, how many pixels in an image assume a particular gray level [12]. In this experiment it is deal only with black and white images.
AHE is a computer image processing technique used to improve contrast in images. It differs from ordinary histogram equalization in the respect that the adaptive method computes several histograms, each corresponding to a distinct section of the image, and uses them to redistribute the lightness values of the image [8]. It is therefore suitable for improving the local contrast of an image and bringing out more detail.
Ordinary histogram equalization uses the same transformation derived from the image histogram to transform all pixels. This works well when the distribution of pixel values is similar throughout the image [12]. However, when the image contains regions that are significantly lighter or darker than most of the image, the contrast in those regions will not be sufficiently enhanced.
Adaptive histogram equalization (AHE) improves on this by transforming each pixel with a transformation function derived from a neighbourhood region [8]. It was first developed for use in aircraft cockpit displays. In its simplest form, each pixel is transformed based on the histogram of a square surrounding the pixel [12]. The derivation of the transformation functions from the histograms is exactly the same as for ordinary histogram equalization: The transformation function is proportional to the cumulative distribution function (CDF) of pixel values in the neighbourhood.
The size of the neighbourhood region is a parameter of the method. It constitutes a characteristic length scale: contrast at smaller scales is enhanced, while contrast at larger scales is reduced.
Due to the nature of histogram equalization, the result value of a pixel under AHE is proportional to its rank among the pixels in its neighbourhood. This allows an efficient implementation on specialist hardware that can compare the center pixel with all other pixels in the neighbourhood [8]. An unnormalized result value can be computed by adding 2 for each pixel with a smaller value than the center pixel, and adding 1 for each pixel with equal value.
When the image region containing a pixel's neighbourhood is fairly homogeneous, its histogram will be strongly peaked, and the transformation function will map a narrow range of pixel values to the whole range of the result image [8]. This causes AHE to over amplify small amounts of noise in largely homogeneous regions of the image.
Different imaging techniques may provide with complementary and occasionally conflicting information. The combination of images can often lead to additional information not apparent in separate images [3]. The goal of image fusion is to impose a structural anatomical framework in functional images [1]. Often in a functional image there is not enough anatomical detail.
Generally functional images have low spatial resolution and anatomical images have high spatial resolution [3]. So, with anatomical images, a lesion can be detected with an accuracy of milli-meters. With the functional images this is not possible, but they have ability to detect lesions, before the anatomy is damaged [2]. The functional image is considered as an MRI brain image [4] and the anatomical image is considered as a CT brain image.
The fusion of both types of images could avoid undesired effects. General procedure is as follows. The resolution of
IJSER © 2012 http://www.ijser.org
International Journal of Scientific & Engineering Research Volume 4, Issue 1, January-2013 3
ISSN 2229-5518
foreground image and background image are different. The size validation and alpha factor is used to fuse both the images. The Foreground should be image co-registered with respected, so that both images represent the same region [2]. Select and merge both Foreground and background i.e MRI and CT images [4].
In edge detection algorithm it contains various methods of algorithms to detect the edges [11]. The alorithm’s like sobel algorithm, prewitt algorithm, canny algorithm, roberts algorithm and laplacian of gaussian algorithm. These are
the algorithm’s which is used for the edge detection.
BW edge of I takes a grayscale or a binary image I as its input, and returns a binary image BW of the same size as I, with 1's where the function finds edges in I and 0's elsewhere.
By default, edge uses the sobel method to detect edges, but the following provides a complete list of all the edge- finding methods supported by this function:
The Sobel method finds edges using the sobel approximation to the derivative [5]. It returns edges at those points, where the gradient of I is maximum.
BW edge, I of 'sobel' specifies the Sobel method. BW edge, I of 'sobel' in thresh specifies the sensitivity threshold for the sobel method. Edge ignores all edges that are not stronger than thresh. If you do not specify thresh, or if thresh is empty ([]), edge chooses the value automatically.
BW edge, I of 'sobel' in thresh and direction specifies the direction of detection for the sobel method. Direction is a string specifying whether to look for 'horizontal' or 'vertical' edges or 'both' (the default).
BW edge, I of 'sobel', options provides an optional string input. String 'no thinning' speeds up the operation of the algorithm by skipping the additional edge thinning stage [5]. By default, or when 'thinning' string is specified, the algorithm applies edge thinning. BW and thresh of edge, I in 'sobel' returns the threshold value.
The Prewitt method finds edges using the Prewitt approximation to the derivative. It returns edges at those points where the gradient of I is maximum [5].
BW edge, I of 'prewitt' specifies the Prewitt method. BW edge, I of 'prewitt' in thresh specifies the sensitivity threshold for the Prewitt method. Edge ignores all edges that are not stronger than thresh. If you do not specify thresh [5], or if thresh is empty ([]), edge chooses the value automatically.
BW edge, I of 'prewitt' in thresh and direction specifies the direction of detection for the Prewitt method. Direction is a string specifying whether to look for 'horizontal' or 'vertical' edges or 'both' (the default). BW of thresh edge, I of
'prewitt' returns the threshold value.
The Canny method finds edges by looking for local maxima of the gradient of I. The gradient is calculated using the derivative of a Gaussian filter [10]. The method uses two thresholds, to detect strong and weak edges, and includes the weak edges in the output only, if they are connected to strong edges [9]. This method is therefore less likely than the others to be fooled by noise, and more likely to detect true weak edges.
BW edge, I of 'canny' specifies the canny method.
BW edge, I of 'canny' in thresh specifies sensitivity thresholds for the canny method [5]. Thresh is a two- element vector in which the first element is the low threshold, and the second element is the high threshold. If you specify a scalar for thresh, this scalar value is used for the high threshold and 0.4*thresh is used for the low threshold. If you do not specify thresh, or if thresh is empty ([]), edge chooses low and high values automatically. The value for thresh is relative to the highest value of the gradient magnitude of the image.
BW edge, I of 'canny' in thresh and sigma specifies the canny method, using sigma as the standard deviation of the Gaussian filter. The default sigma is sqrt(2); the size of the filter is chosen automatically, based on sigma. BW of thresh edge, I of 'canny' returns the threshold values as a two-
element vector.
IJSER © 2012 http://www.ijser.org
International Journal of Scientific & Engineering Research Volume 4, Issue 1, January-2013 4
ISSN 2229-5518
The Roberts method finds edges using the Roberts approximation to the derivative [5]. It returns edges at those points, where the gradient of I is maximum.
BW edge, I of 'roberts' specifies the Roberts method.
BW edge, I of 'roberts' in thresh specifies the sensitivity threshold for the Roberts method. Edge ignores all edges that are not stronger than thresh. If you do not specify thresh [5], or if thresh is empty ([]), edge chooses the value automatically.
BW edge, I of 'roberts', options where options can be the text string 'thinning' or 'no thinning'. When you specify
'thinning', or don't specify a value, the algorithm applies
edge thinning. Specifying the 'no thinning' option can speed up the operation of the algorithm by skipping the additional edge thinning stage. BW of thresh edge, I of
'roberts' returns the threshold value.
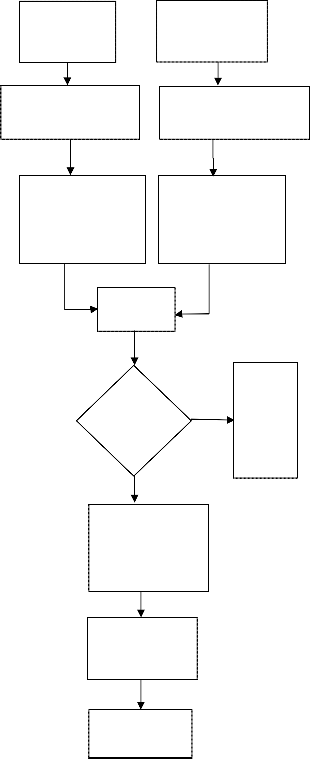
Foreground
Image
(MRI Image)
Adaptive Histogram
Equalization Method
Adaptive histogram equalized form of foreground image
Image
Fusion
Background
Image
(CT Image)
Adaptive Histogram
Equalization Method
Adaptive histogram equalized form of background image
The Laplacian of Gaussian method finds edges by looking for zero crossings after filtering I with a Laplacian of Gaussian filter. BW edge, I of 'log' specifies the Laplacian
of Gaussian method.
Yes
Array size is equal
No Display output: Array size is not equal
BW edge, I of 'log' in thresh specifies the sensitivity threshold for the Laplacian of Gaussian method [5]. Edge ignores all edges that are not stronger than thresh. If you do not specify thresh, or if thresh is empty ([]), edge chooses the value automatically. If you specify a threshold of 0, the output image has closed contours, because it includes all the zero crossings in the input image.
BW edge, I of 'log' in thresh and sigma specifies the Laplacian of Gaussian method, using sigma as the standard deviation of the LOG filter [5]. BW of thresh edge, I of 'log' returns the threshold value.
In this flow chart, It is fully described about the entire architecture of this paper. And it is very clear about the overall process, which are first starts with foreground and
background image.
Fused form of foreground and background image
Edge Detection
Algorithm
Edge Detected
Image
Table1. Architecture of the system
IJSER © 2012 http://www.ijser.org
International Journal of Scientific & Engineering Research Volume 4, Issue 1, January-2013 5
ISSN 2229-5518
In this section, the comparative analyses of various different types of edge detection are performed. The edge detection algorithm such as sobel algorithm, prewitt algorithm, canny algorithm, roberts algorithm and laplacian of gaussian algorithm. Initially, the MRI image is considered as a foreground image i.e functional image and CT image is considered as a background image i.e anatomical image. Hence the fused form of these images is considered as an output. With this fused image, the comparison of edge detection is analysed. Now, the fused image is applied to the entire edge detection algorithms but finally, its came to know the canny algorithm produces the clear and accurate form of edge detection to that fused image with more information compared to the original images.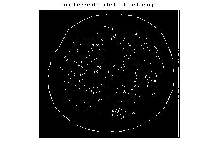
Fig 3.1 Sobel edge detected fused image
Fig 3.2 Prewitt edge detected fused image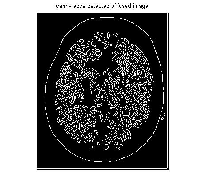
Fig 3.3 Canny edge detected fused image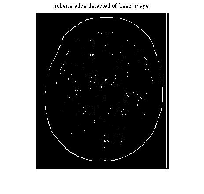
Fig 3.4 Roberts edge detected fused image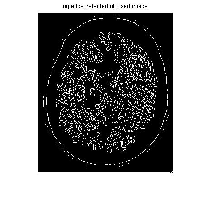
Fig 3.5 Log edge detected fused image
In this section, the fore ground image as MRI image and the background image as CT images are taken as an input. The Adaptive histogram equalization is applied to the MRI and CT input images. Due to this process, the MRI brain image and as well as the CT brain image are enhanced. Hence the
fusion of MRI and CT image is getting improved.
IJSER © 2012 http://www.ijser.org
International Journal of Scientific & Engineering Research Volume 4, Issue 1, January-2013 6
ISSN 2229-5518
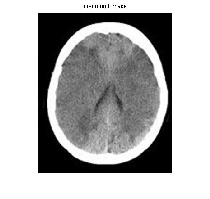
Fig 4.1 Foreground image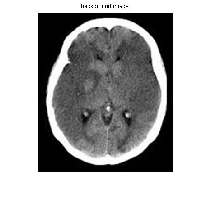
Fig 4.2 Background image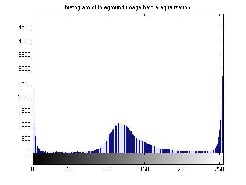
Fig 4.3 Histogram of foreground image before equalization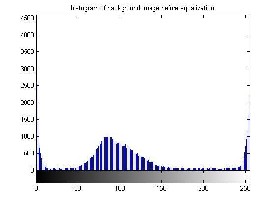
Fig 4.4 Histogram of background image before equalization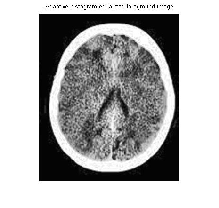
Fig 4.5 Adaptive histogram equalized foreground image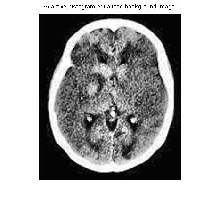
Fig 4.6 Adaptive histogram equalized background image
IJSER © 2012 http://www.ijser.org
International Journal of Scientific & Engineering Research Volume 4, Issue 1, January-2013 7
ISSN 2229-5518
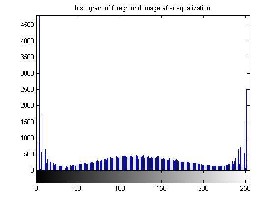
Fig 4.7 Histogram of foreground image after equalization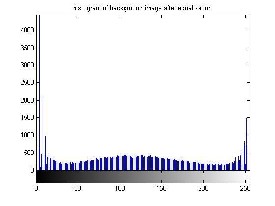
Fig 4.8 Histogram of background image after equalization
Now, the fusion has been take place, the enhanced form of MRI image and CT image as displayed with help of adaptive histogram equalization. Finally, the resulted image gives more information compare to the original two images. This image easily diagnoses the diseases.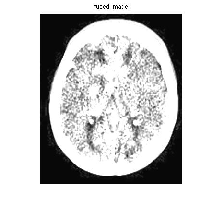
Fig 4.9 Fused image
The comparison of entire edge detection algorithms like sobel, prewitt, roberts, canny and log edge detection, which discussed in the above comparison analysis. Now, it is very clearly shows that compare to all other edge detection algorithm, the canny edge detection algorithm produces a very accurate and clear form of edge detected image.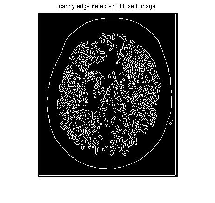
Fig 4.10 Edge detected image
This is the objective criteria of various MRI and CT images which gives some qualitative analysis measures of those particular images and its calculations.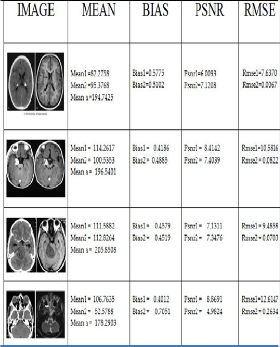
Table 2. Objective criteria of various images
IJSER © 2012 http://www.ijser.org
International Journal of Scientific & Engineering Research Volume 4, Issue 1, January-2013 8
ISSN 2229-5518
In this paper, the fore ground image as MRI image i.e functional image and the background image as CT images i.e anatomical image are taken as an input. The Adaptive histogram equalization method is applied to the MRI input image. Now, it is plotted the histogram of foreground image before equalization. Due to this process, the MRI brain image is enhanced. And again it is plotted the histogram of foreground image after equalization. Hence the fusion of MRI and CT image is getting improved. Now, the fusion has been take place, the fused form of MRI image and CT image as displayed. Finally, the resulted image gives more information compare to the original two images. This image easily diagnoses the disease as shown. The comparison of entire edge detection algorithms like sobel, prewitt, roberts, canny and Laplacian of gaussian edge detection. It is very clearly shows that compare to all other edge detection algorithm, the canny edge detection algorithm produces a very accurate and clear form of edge detected image.
Equalization and Its Variations”. Computer Vision, Graphics, and
Image Processing 39 355-368, (1987).
[9] Natarajan P, “Newfangled MRI Brain Edge Detection Using Enhanced Canny Algorithm”, 2011 IEEE International Conference on Computational Intelligence and Computing Research, PP 84 - 87, Dec 2011.
[10] Natarajan P, Krishnan N, “MRI Brain Image Edge Detection with Windowing and Morphological Erosion”, 2011 IEEE International Conference on Computational Intelligence and Computing Research, PP 94 - 97, Dec 2011.
[11] Natarajan P, N.Krishnan, Sugavanesh C, “Neoteric Approach for Edge Detection in Brain MRI Images”, 2011 IEEE International Conference on Computational Intelligence and Computing Research, PP 80 - 83, Dec 2011.
[12] Natarajan P, N.Krishnan, Sugavanesh C, “Brain MRI Image Edge Detection Using Top-Hat Mathematical Morphology”, 2011 IEEE International Conference on Computational Intelligence and Computing Research, PP 120 - 123, Dec 2011.
[13] Natarajan P, N.Krishnan, Rajesh N, “Brain MRI Image Edge Detection Using Gradient Method”, 2011 IEEE International Conference on Computational Intelligence and Computing Research, PP 124 - 126, Dec 2011.
[1] M.MaliniDeepika, Dr.V.Vaithyanathan, “An Efficient method to improve the spatial property of medical images”, Journal of Theoretical and Applied Information Technology, Vol. 35 No.2, pp.
141-148
[2] Jing Yuan, Brandon Miles, Juan Shi, Greg Garvin, Xue-Cheng Tai, and Aaron Fenster,”Efficient Convex Optimization Approaches to Variational Image Fusion”, Medical Imaging Lab, Robarts Research Institute, University of Western Ontario London, Ontario, Canada N6A 5B7.
[3] Habib Zaidi, PhD, PD Marie-Louise Montandon, PhD, Abass Alavi, MD, PhD (Hon), DSc (Hon)b, ”The Clinical Role of Fusion Imaging Using PET, CT, and MR Imaging”, Magn Reson Imaging Clin N Am, 18, 2010.
[4] Roger Lundqvist, ”Atlas-Based Fusion of Medical Brain Images”, Acta Universitatis Upsaliensis, Comprehensive Summaries of Uppsala Dissertations from the Faculty of Science and Technology
673, 62pp. Uppsala, ISBN 91-554-5180-2.
[5] Prof. J.Mehena, ”Medical Images Edge Detection Based on Mathematical Morphology”, International Journal of Computer & Communication Technology, (IJCCT), Volume-2, Issue-VI, 2011.
[6] Volker Schatz, ”Low-latency histogram equalization for infrared image sequences - a hardware implementation”, Journal of Real- Time Image Processing, June, 2011.
[7] Johnson J L, Padgett M L. “PCNN models and applications”. IEEE Transactions on Neural Networks, Vol. 10, No. 3, pp 480-498, May
1999.
[8] S. M. Pizer, E. P. Amburn, J. D. Austin, Robert Cromartie, ARI Geselowitz, Trey Greer, Bart Ter Haar Romeny, John B. Zimmerman, and Karel Zuiderveld, “Adaptive Histogram
IJSER © 2012 http://www.ijser.org