International Journal of Scientific & Engineering Research, Volume 6, Issue 3, March-2015 153
ISSN 2229-5518
Frequency response analysis of a Clamped Composite Plate with a Central Circular Cutout using ANSYS
Kolaventi.sasikumar, B.V.S. Raghu Vamsi, P.N.V. Balasubrahmanyam, E.Vekateswararao
Abstract: Every object vibrates because of unbalanced forces arise within it, at a particular frequency called as natural frequency. W hen this object is subject to the external force having the same frequency, the object vibrates with larger amplitudes and is said to be under resonant condition. For the safe working of any mechanical component, this operating frequency should be large and far away from the natural frequency. In this work, a clamped rectangular composite plate with a circular cut out at its centre subjected to clamped boundary condition is considered and its vibration characteristics are studied. The effect of various parameters like aspect ratio (l/w), diameter of the hole to the width of the plate (d/w), thickness of the ply, and the orientation of the fibers in the ply on the natural frequencies is observed. The problem is analyzed used the finite element software ANSYS. It has been found that the effect of these parameters is significant on the frequency ratio. The increase in l/w ratio and d/w ratio, orientation of layers resulted in increase of frequency ratio whereas with increase in no. of layers the frequency ratio remain unchanged even thought the frequency values changed.
Index terms: Composite materials, frequency ratio, cutout, clamped boundary condition, finite element analysis, vibration analysis
1. INTRODUCTION
—————————— ——————————
functionally graded plates with multiple circular and
Plates are flat structural elements having thickness much smaller than other dimensions. Example is a Turbine disc. According to the criterion, a thin plate is defined as a plate in which the ratio of the thickness to the smaller span is less than1/20. Aspect ratio is defined as the ratio of the length of the plate to the width of the plate.


Aspect ratio = length of the plate = l width of the plate w
Based on this ratio, how a plate will bend can be predicted. If the aspect ratio>2.0, then the plate will bend along the direction of shorter dimension only. If the aspect ratio<2.0, then the bend will takes place along both the directions simultaneously. In this work, aspect ratio is varied over a span of 2.5, with an interval of 0.5. Non-dimension form of natural frequency is defined by a parameter, frequency ratio.
noncircular cutouts using finite element method. The volume fraction of the material constituents is assumed to follow a simple power law distribution. It should be mentioned that free vibration for FG plates (such as rectangular /skew /trapezoidal /circular plates) with multiple cutouts has not been studied yet and hence the results out coming from this paper may be used as bench marks for future works. A. Alibiglu et. al. [3] presented the free vibration of composite plate with various edges condition and carrying distributed patch mass. The Rayleigh_Ritz approach is applied to give frequency characteristic of the rectangular plates. The deflection of the plate is postulated by a double fourier series function. The effect of the various combination of clamped(c) and simply supported(s) edges conditions on the response of plates, is also presented. Jyoti Vimal [4] studied the free vibration characteristics of functionally graded skew plates with
Frequency ratio =
natural frequency of the plate with hole

natural frequency of the plate without hole
circular cutout, using ANSYS. The functionally graded materials (FGMs) are assumed to be graded across their thicknesses according to a power law distribution of the
K. Srividya et. al.[1] dealt with the free vibration
analysis of a thick four-layered skew laminated composite plate with a circular cutout. Three dimensional finite element models (FEM) which use the elasticity theory for
the determination of stiffness matrices are modeled in ANSYS software to evaluate first five natural frequencies of the laminate. The variation of natural frequencies with respect to various boundary conditions for different stacking sequences is presented. It is observed that, the natural frequencies are high at c-c-c-c (four sides clamped) case. Janghorban et. al.[2] investigated the free vibrations of
volume fractions and the Poisson’s ratio is taken as
constant. The effects of cutout, cutout size, volume fraction
index, boundary conditions and thickness ratio on the natural frequencies is studied.
Kanak Kalita et. al [5] studied the free vibration response of isotropic plates subjected to various boundary conditions using the ANSYS. The analysis for isotropic plate is carried out for uniform thickness and different aspect ratios (a/b= 0.4, 1.0, 1.5 and 2.0). Then problem of free vibration analysis of composite square plates having 3 lamina layers and 5 lamina layer (angle ply) is also considered. The laminate considered is of equal thickness.
IJSER © 2015 http://www.ijser.org
International Journal of Scientific & Engineering Research, Volume 6, Issue 3, March-2015 154
ISSN 2229-5518
Hussain et. al.[6] presented the behavior of symmetric laminated plates with different cutout locations subjected to free vibrations under clamped boundary conditions using ANSYS 13.0. From the analysis it is inferred that the fundamental frequency of laminated composite plates decreases with increase in L/h ratio. K. Torabi et. al [7] investigated the transverse vibrations of rectangular plate with circular central hole and obtained the natural frequencies by Rayleigh-Ritz Method. In this study, the effects of increasing the diameter of the hole and the effects of number of point supported on the natural frequencies were investigated and the optimum radius of the circular hole for different boundary conditions is obtained. The method has been verified with many known solutions. Dr. N. K. Jain [8] performed the finite element analysis to study the effect of fibre orientation on natural frequency (ω) for different mode shape in the simply supported and fixed rectangular fibrous composite plates with central circular hole, using ANSYS.
S. D. Kulkarni [9] had modified the 4–node discrete kirchoff quadrilateral element using smoothed shape functions obtained using least square smoothing technique and is used for the free vibration analysis of skew and rectangular plates. This modified element is based on Reddy’s third order theory and has seven degrees of freedom (DOF) per node. The formulation of the stiffness and consistent mass matrices is carried out using variational principle. The performance of the developed element is assessed for its accuracy by comparing the results of the present element with the analytical and exact elasticity solutions available in the literature as well as with the 3 D finite element results obtained using ANSYS for rectangular and skew plates. H. L. Chen[11], have proposed a Bessel function method to obtain an exact solution for the vibration problems of a rectangular plate by superposing different Bessel functions to satisfy three edge conditions : ( i) fully simply supported, (ii) fully clamped , (iii)two opposite edges simply supported and the other two edges clamped. T. Sakiyama et. al [12] proposed an approximate method for generally analyzing the free vibration of rectangular plates with variable thickness. At first the approximate solutions of rectangular plate with variable thickness for a concentrated load are obtained at the discrete points equally distributed on the plate. The solution for deflection gives the discrete-type Green function of the plate. It is shown that the numerical solution for the Green function has the good convergence and accuracy. Neffati et. al. [13] studied the free vibrations of thin isotropic rectangular plates with various edge conditions by solving the mathematical model that governs the vibration behavior of the plate using a Galerkin-based finite element method. Cubic quadrilateral serendipity sub
parametric elements with twelve degrees of freedom are used in this analysis. The effect of the aspect ratio, the number of elements, and the number of sampling points on the accuracy of the solution is also presented.
2. MODELING
A rectangular plate of size 1 m x 0.5 m with a central circular hole is considered. The diameter of the hole is related to the width of the plate (D/w). In this work, the physical model of the plate is designed using the commands in ANSYS. To study the effect on natural frequencies, (1) Aspect ratio (l/w) is varied from 0.5 to 2.5 with an interval of 0.5 (2) The ratio of diameter of the hole to the width (D/W) of the plate is varied from 0.2 to 0.8 with an interval of 0.2 (3) No. of layers is varied from 5-20 with an interval of 5. (4) The orientation of the layers is varied as
0/0/0, 0/30/0, 0/60/0, 0/90/0.
3. MATERIAL PROPERTIES
The mechanical properties of the composite used in this work are tabulated below:
Table.1. Material Properties of Carbon/Epoxy
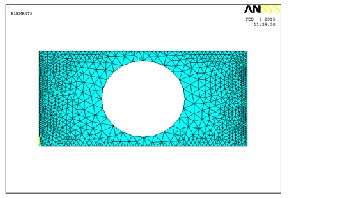
4. MESHING

Meshing means dividing the physical object with infinite degrees of freedom into small parts having finite degrees of freedom. Each part is known as element and each element is connected in between with endpoints called nodes. 4-node 181 is a 2-D shell element with 6 DOF i.e. 3 in rotation & 3 in translations at each node, suitable for analyzing thin to moderately-thick shell structures. Shell181 is well-suited for linear, large rotation, and/or large strain nonlinear applications. Here for the plate without hole we considered the mapped meshing because of regular surface and for the plate with hole we considered the free meshing because of surface irregularity. The size of the element considered in this analysis is 0.001 m.
Fig. (a) Element Shape of Shell-181 element
IJSER © 2015 http://www.ijser.org
International Journal of Scientific & Engineering Research, Volume 6, Issue 3, March-2015 155
ISSN 2229-5518
Fig. (b) Meshed view of the plate
5. LOADS AND SUPPORT CONDITIONS
In this work, all the edges of the plate are clamped. No external loads are applied on the plate and only the self weight of the plate is considered to obtain the natural frequency of plates. The problem is solved using the finite element package, ANSYS 12.0. First 5 modes are extracted and the corresponding natural frequencies are noted. These values are converted into non-dimensional form i.e. frequency ratio using the formula mentioned in section-I. The variation of frequency ratio w.r.t change in aspect ratio corresponding to the changes in D/w ratio, no. of layers and thickness of each layer as well as orientation are plotted graphically and are given from fig.1 to fig. 80.
6. RESULTS AND DISCUSSION
In this research work, free vibrations of a composite rectangular plate with a central hole are studied. The final conclusions drawn from the analysis are presented below;
1. The configuration of geometry selected in this work does not permit the ratio d/w = 1. This indicates the diameter of hole becoming equal to the width of the plate.
2. Increase in no. of layers represents the reduction in
thickness of each layer.
3. For a square plate (l/w=1.0), frequency ratio
corresponding to the d/w=0.4 is low and d/w=0.8 is
high. This has been observed for all orientations (00, 300, 600 and 900), all number of layers (5, 10, 15, and 20) and for all the layer thicknesses (4mm,
2mm, 1.33mm and 1.0 mm) respectively.
4. With increase in aspect ratio (l/w), it has been
observed that the frequency ratio is decreasing gradually for mode-1 and this has been observed for all the no. of layers (5, 10, 15 and 20) and also for increase in d/w ratio up to 0.6. Later it has been observed that the frequency ratio for d/w = 0.8 is very large for all the aspect ratios but followed the same trend exhibited by other d/w ratios. This is because of larger change in stiffness.
5. It has been observed that beyond l/w=2.0, the frequency ratio is independent of aspect ratio and d/w ratio i.e. remaining constant following same trend.
6. In mode-1, the frequency ratio is high for d/w=0.8 and low for d/w=0.2. For orientation (00-900-00), beyond the l/w=1.5, all the profiles are converging to a single value for no. of layers 5 and 10 respectively and is observed to be independent of l/w ratio for no. of layers 15 and 20 respectively.
7. For all orientations, in mode-2, it has been found
that the frequency ratio is decreasing up to l/w =
1.5 and became independent of aspect ratio beyond
1.5. The same trend is observed for all the
orientations (except 900) and all no. of layers. For the orientation (0-90) it has been observed that all the frequency ratio curves are converging to a single value beyond the l/w=1.5.
8. In mode-3, the frequency ratio is observed to be
decreasing with increase in l/w ratio up to 1.5 and then increasing up to 2.0 and then remained constant. The same trend is observed for all the thicknesses of layers, no. of layers and orientations. Also, the frequency ratio is observed to be maximum for plate with d/w=0.8 for all conditions. Again, it has been observed that the low value of frequency ratio is observed for d/w=0.4 below l/w=1.5 and for d/w=0.2 beyond l/w=2.0.
9. In mode-4, frequency ratio is observed to be high
for d/w=0.8 for all l/w ratios and is observed to be decreasing gradually up to l/w=2.0 and then remaining constant. Again it has been observed that for d/w=0.4, the frequency ratio is observed to be decreasing up to l/w=1.0 and then it followed the trend of increasing up to l/w=1.5 and decreasing up to 2.0 and then remaining constant beyond that similar to d/w=0.2 and 0.6.
10. In mode-5, frequency ratio is observed to be high for d/w=0.8 for all l/w ratios and for d/w=0.4 the frequency ratio is observed to be low for l/w ratio beyond 1.0. In addition, the frequency ratio is observed to be decreasing between l/w ratio 1.5 and 2.0 and then remaining constant beyond 2.0.
7. CONCLUSIONS
In this research work, the vibration characteristic of a clamped rectangular plate with a central circular cutout is studied and the following conclusions are drawn.
1. With increase in l/w ratio, the frequency ratio is observed to be decreasing up to l/w<2.0 and beyond this the frequency ratio is observed to be remaining constant.
IJSER © 2015 http://www.ijser.org
International Journal of Scientific & Engineering Research, Volume 6, Issue 3, March-2015 156
ISSN 2229-5518
2. With increase in d/w ratio, the frequency ratio is observed to be increasing. The frequency ratio for d/w=0.8 is very high when compared with other values. But this configuration is not recommended in practical as the size of the hole is very large, which reduces the strength of the plate.
3. With increase in no. of layers, the frequency ratio is
observed to be remaining almost constant even though the frequency values remain changed.
4. With the decrease in thickness of each layer, the natural frequency values are observed to be increasing.
5. With the change in orientation of the layers, the frequency values are observed to be increasing.
REFERENCES:
[1] Kode Srividya, V. Balakrishna Murthy, M.R.S.
Satyanarayana, “Effect of Boundary Conditions on Free Vibration Analysis of Thick Fiber Reinforced Plastic Skew Laminate with Circular Cutout” IJESRT, Vol. 3(6), June 2014
[2] Janghorban Maziar, Rostamsowlat Iman “Free Vibration Analysis of Functionally Graded Plates with Multiple Circular and Noncircular Cutouts” Chinese Journal Of Mechanical Engineering, Vol. 24 aNo. 6 a2011
[3] A. Alibiglu “Free vibration of rectangular composite plates with localized patch mass Transactions”, SMIRT 19, Toronto, August 2007.
[4] Jyoti Vimal, R.K. Sribastava, A.D.Bhatt, “Free vibration analysis of functionally graded skew plates with circular
cutouts”, International Journal of Engineering Science and
Technology, Vol. 6, No. 4, April 2014
[5] Kanak Kalita and Abir Dutta “Free vibration Analysis of Isotropic and Composite Rectangular Plates”, International Journal of Mechanical Engineering and Research, Volume 3, Number 4 (2013), pp. 301-308.
[6] Syed Altaf Hussainin, “Vibration Analysis of Laminated Composite Plates with Holes”, International Journal of Engineering and Scienc & Reserch Technology, 3(7): July, 2014,
[7] K. Torabi*, A.R. Azadi “Vibration Analysis for Rectangular Plate Having a Circular Central Hole with Point Support by Rayleigh-Ritz Method”, Journal of Solid Mechanics Vol. 6, No.
1 (2014) pp. 28-4.
[8] Dr. N. K. Jain “Vibration Analysis of Fibrous Composite Plates with Central Circular Hole” International J. Technology. Jan. – June, 2014; Vol. 4
[9] Mansours Nikkhah-Bahrami “free vibration analysis of a rectangular plate subjecyed various boundary conditions”.
[10] H. L. Chen “Bessel function method is proposed to obtain
an exact solution for the vibration problems of a rectangular plate”
[11] S. D. Kulkarni “Finite Element Analysis of Thick Isotropic Plates for Free Vibration Response”, International Journal of Earth Sciences and Engineering, Volume 04, No 06 SPL, October 2011, pp. 490-493.
[12] T. Sakiyama and M. Huang, “Free vibration analysis of rectangular plates with variable thickness”, Reports of the Faculty of Engineering, Nagasaki University, Vol. 28, No.5l
[13] Neffati M. Werfalli, Abobaker A. Karoud, “Free vibration analysis of rectangular plates using galerkin-based finite element method”, International Journal of Mechanical Engineering, Volume 2 Issue 2
IJSER © 2015 http://www.ijser.org
International Journal of Scientific & Engineering Research, Volume 6, Issue 3, March-2015 157
ISSN 2229-5518
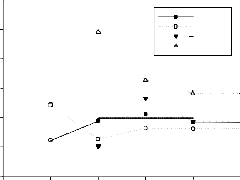
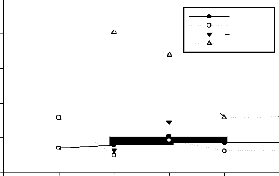
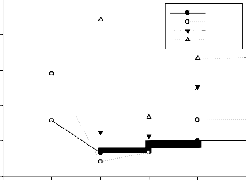
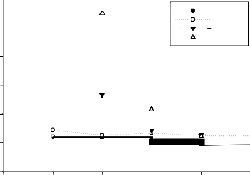
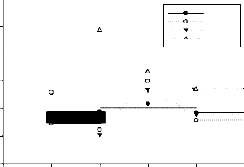
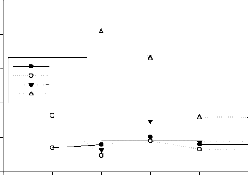
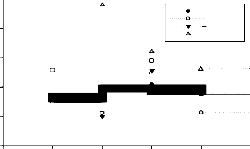
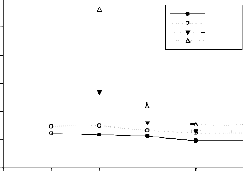
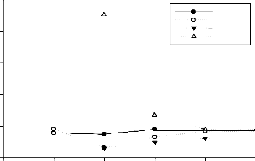
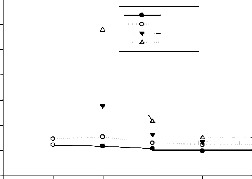
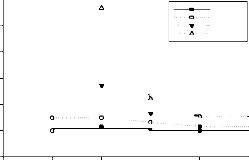
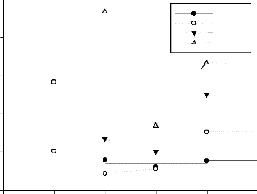
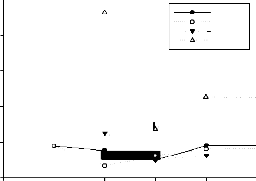
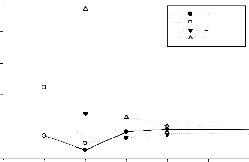
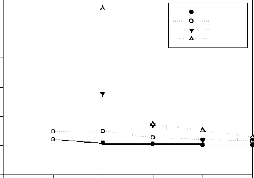
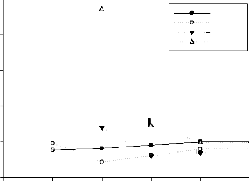
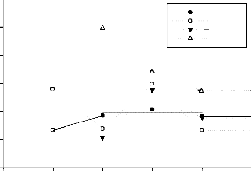
Fig. 1 Frequency ratio vs. l/w ratio for Orientation 0-30- 0-30-0 for 5-layers – Mode-1 | Fig. 2 Frequency ratio vs. l/w ratio for Orientation 0- 30-0-30-0 for 5-layers – Mode-2 |
ORIENTATION(0-30),5 LAYERS FOR MODE 1 3.5 d/w=0.2 3.0 d/w=0.4 d/w=0.6 d/w=0.8 2.5 2.0 1.5 1.0 0.5 0.0 0.5 1.0 1.5 2.0 2.5 l/w ratio | ORIENTATION (0-30),5 LAYERS FOR MODE 2 1.8 d/w=0.2 d/w=0.4 1.6 d/w=0.6 d/w=0.8 1.4 1.2 1.0 0.8 0.0 0.5 1.0 1.5 2.0 2.5 l/w ratio |
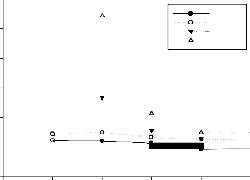
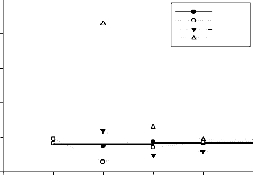
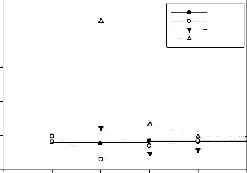
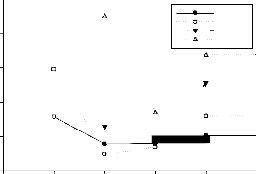
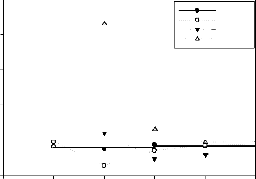
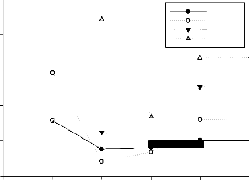
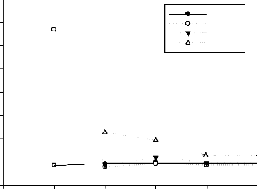
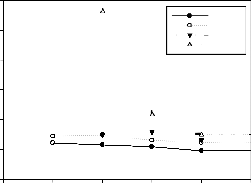
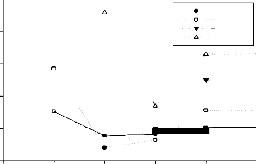
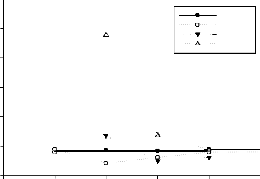
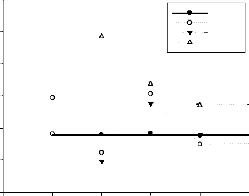
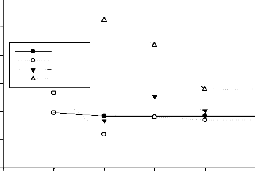
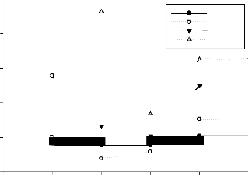
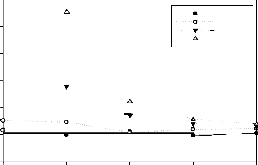
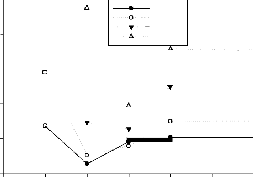
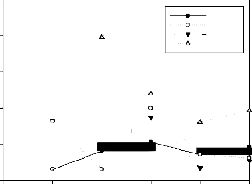
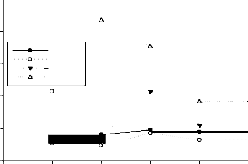
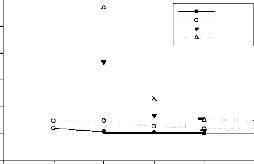
Fig. 3 Frequency ratio vs. l/w ratio for Orientation 0-30- 0-30-0 for 5-layers – Mode-3 | Fig. 4 Frequency ratio vs. l/w ratio for Orientation 0- 30-0-30-0 for 5-layers – Mode-4 |
ORIENTATION(0-30) 5 LAYERS FOR MODE 3 1.8 d/w=0.2 d/w=0.4 d/w=0.6 1.6 d/w=0.8 1.4 1.2 1.0 0.8 0.6 0.0 0.5 1.0 1.5 2.0 2.5 l/w ratio | ORIENTATIO(0-30),5 LAYERS FOR MODE 4 1.4 d/w=0.2 d/w=0.6 d/w=0.8 1.2 1.1 1.0 0.9 0.8 0.0 0.5 1.0 1.5 2.0 2.5 l/w ratio |
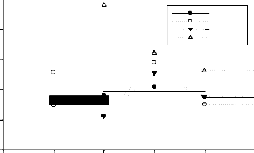
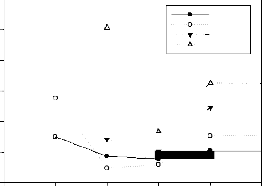
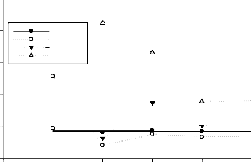
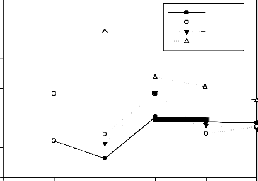
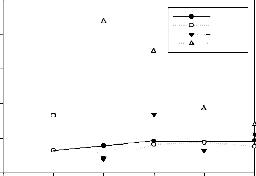
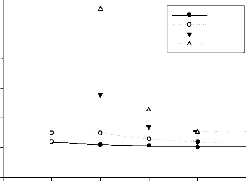
Fig. 5 Frequency ratio vs. l/w ratio for Orientation 0-30- 0-30-0 for 5-layers – Mode-5 | Fig. 6 Frequency ratio vs. l/w ratio for Orientation 0- 30-0 pattern for 10-layers – Mode-1 |
ORIENTATION(0-30),5 LAYERS FOR MODE 5 1.8 d/w=0.2 d/w=0.4 1.6 d/w=0.6 d/w=0.8 1.4 1.2 1.0 0.8 0.0 0.5 1.0 1.5 2.0 2.5 l/w ratio | ORIENTATION(0-30),10 LAYERS FOR MODE 1 3.5 d/w=0.2 d/w=0.4 3.0 d/w=0.6 d/w=0.8 2.5 2.0 1.5 1.0 0.5 0.0 0.5 1.0 1.5 2.0 2.5 l/w ratio |
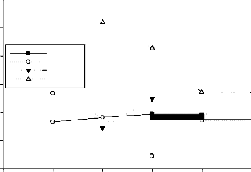
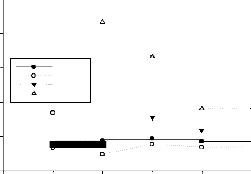
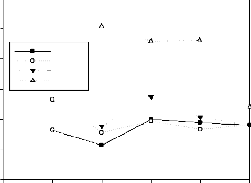
Fig. 7 Frequency ratio vs. l/w ratio for Orientation 0-30- | Fig. 8 Frequency ratio vs. l/w ratio for Orientation 0- |
IJSER © 2015 http://www.ijser.org
International Journal of Scientific & Engineering Research, Volume 6, Issue 3, March-2015 158


ISSN 2229-5518
0 pattern for 10-layers – Mode-2 | 30-0 pattern for 10-layers – Mode-3 |
ORIENTATION(0-30),10 LAYERS FOR MODE 2 1.8 d/w=0.2 d/w=0.4 1.6 d/w=0.6 d/w=0.8 1.4 1.2 1.0 0.8 0.0 0.5 1.0 1.5 2.0 2.5 l/w ratio | ORIENTATION(0-30), 10 LAERS FOR MODE 3 1.8 d/w=0.2 d/w=0.4 1.6 d/w=0.6 d/w=0.8 1.4 1.2 1.0 0.8 0.0 0.5 1.0 1.5 2.0 2.5 l/w ratio |
Fig. 9 Frequency ratio vs. l/w ratio for Orientation 0-30- 0 pattern for 10-layers – Mode-4 | Fig. 10 Frequency ratio vs. l/w ratio for Orientation 0- 30-0 pattern for 10-layers – Mode-5 |
ORIENTATION(0-30),10 LAYERS FOR MODE 4 1.4 

1.3 
1.2 
1.1 
1.0  0.9 
0.8 0.0 0.5 1.0 1.5 2.0 2.5 l/w ratio | ORIENTATION(0-30),10 LAYERS FOR MODE 5 1.8 

1.6  
1.4 1.2 


1.0  0.8 0.0 0.5 1.0 1.5 2.0 2.5 l/w ratio |
Fig. 11 Frequency ratio vs. l/w ratio for Orientation 0- 30-0 pattern for 15-layers – Mode-1 | Fig. 12 Frequency ratio vs. l/w ratio for Orientation 0- 30-0 pattern for 15-layers – Mode-2 |
ORIENTATION(0-30),15 LAYERS FOR MODE 1 3.5 d/w=0.2 d/w=0.4 3.0 d/w=0.6 d/w=0.8 2.5 2.0 1.5 1.0 0.5 0.0 0.5 1.0 1.5 2.0 2.5 L/W RATIO | ORIENTATION(0-30),15 LAYERS FOR MODE 2 1.8 d/w=0.2 d/w=0.4 1.6 d/w=0.6 d/w=0.8 1.4 1.2 1.0 0.8 0.0 0.5 1.0 1.5 2.0 2.5 l/w ratio |
Fig. 13 Frequency ratio vs. l/w ratio for Orientation 0- 30-0 pattern for 15-layers – Mode-3 | Fig. 14 Frequency ratio vs. l/w ratio for Orientation 0- 30-0 pattern for 15-layers – Mode-4 |


IJSER © 2015 http://www.ijser.org
International Journal of Scientific & Engineering Research, Volume 6, Issue 3, March-2015 159


ISSN 2229-5518
ORIENTATION(0-30),15 LAYERS FOR MODE 3 1.8 d/w=0.2 d/w=0.4 1.6 d/w=0.6 d/w=0.8 1.4 1.2 1.0 0.8 0.0 0.5 1.0 1.5 2.0 2.5 l/w ratio | ORIENTATION(0-30),15 LAYERS FOR MODE 4 1.4 d/w=0.2 d/w=0.4 1.3 d/w=0.6 d/w=0.8 1.2 1.1 1.0 0.9 0.8 0.0 0.5 1.0 1.5 2.0 2.5 l/w ratio |
Fig. 15 Frequency ratio vs. l/w ratio for Orientation 0- 30-0 pattern for 15-layers – Mode-5 | Fig. 16 Frequency ratio vs. l/w ratio for Orientation 0- 30-0 pattern for 20-layers – Mode-1 |
ORIENTATION(0-30),15 LAYERS FOR MODE 5 1.8 1.6 1.4 d/w=0.2 d/w=0.4 d/w=0.6 d/w=0.8 1.2 1.0 0.8 0.0 0.5 1.0 1.5 2.0 2.5 l/w ratio | ORIENTATION(0-30),20 LAYERS FOR MODE 1 3.5 

3.0  2.5 2.0 
1.5 1.0  0.5 0.0 0.5 1.0 1.5 2.0 2.5 l/w ratio |
Fig. 17 Frequency ratio vs. l/w ratio for Orientation 0- 30-0 pattern for 20-layers – Mode-2 | Fig. 18 Frequency ratio vs. l/w ratio for Orientation 0- 30-0 pattern for 20-layers – Mode-3 |
ORIENTATION(0-30),20 LAYERS FOR MODE 2 1.8 d/w=0.2 d/w=0.4 1.6 d/w=0.6 d/w=0.8 1.4 1.2 1.0 0.8 0.0 0.5 1.0 1.5 2.0 2.5 l/w ratio | ORIENTATION(0-30),20 LAYERS FOR MODE 3 1.8 d/w=0.2 d/w=0.4 1.6 d/w=0.6 d/w=0.8 1.4 1.2 1.0 0.8 0.0 0.5 1.0 1.5 2.0 2.5 l/w ratio |
Fig. 19 Frequency ratio vs. l/w ratio for Orientation 0- 30-0 pattern for 20-layers – Mode-4 | Fig. 20 Frequency ratio vs. l/w ratio for Orientation 0- 30-0 pattern for 20-layers – Mode-5 |
IJSER © 2015 http://www.ijser.org
International Journal of Scientific & Engineering Research, Volume 6, Issue 3, March-2015 160
ISSN 2229-5518
ORIENTATION(0-30),20 LAYERS FOR MODE 4 1.3 d/w=0.2 1.2 d/w=0.4 d/w=0.6 d/w=0.8 1.1 1.0 0.9 0.8 0.0 0.5 1.0 1.5 2.0 2.5 l/w ratio | ORIENTATION(0-30),20 LAYERS FOR MODE 5 1.8 d/w=0.2 d/w=0.4 1.6 d/w=0.6 d/w=0.8 1.4 1.2 1.0 0.8 0.0 0.5 1.0 1.5 2.0 2.5 L/W RATIO |
Fig. 21 Frequency ratio vs. l/w ratio for Orientation 0- 45-0 pattern for 5-layers – Mode-1 | Fig. 22 Frequency ratio vs. l/w ratio for Orientation 0- 45-0 pattern for 5-layers – Mode-2 |
ORIENTATION(0-45),5 LAYERS FOR MODE 1 3.5 d/w=0.2 d/w=0.4 3.0 d/w=0.6 d/w=0.8 2.5 2.0 1.5 1.0 0.5 0.0 0.5 1.0 1.5 2.0 2.5 l/w ratio | ORIENTATION(0-45),5 LAYERS FOR MODE 2 1.8 d/w=0.2 d/w=0.4 d/w=0.6 1.6 d/w=0.8 1.4 1.2 1.0 0.8 0.0 0.5 1.0 1.5 2.0 2.5 l/w ratio |
Fig. 23 Frequency ratio vs. l/w ratio for Orientation 0- 45-0 pattern for 5-layers – Mode-3 | Fig. 24 Frequency ratio vs. l/w ratio for Orientation 0- 45-0 pattern for 5-layers – Mode-4 |
ORIENTATION(0-45), 5 LAYERS FOR MODE 3 1.8 d/w=0.2 d/w=0.4 1.6 d/w=0.6 d/w=0.8 1.4 1.2 1.0 0.8 0.0 0.5 1.0 1.5 2.0 2.5 l/w ratio | ORIENTATION(0-45),5 LAYERS FOR MODE 4 1.4 

1.3  1.2 
1.1 

1.0  0.9 0.8 0.0 0.5 1.0 1.5 2.0 2.5 l/w ratio |
Fig. 25 Frequency ratio vs. l/w ratio for Orientation 0-
45-0 pattern for 5-layers – Mode-5


Fig. 26 Frequency ratio vs. l/w ratio for Orientation 0-
45-0 pattern for 10-layers – Mode-1

IJSER © 2015 http://www.ijser.org
International Journal of Scientific & Engineering Research, Volume 6, Issue 3, March-2015 161


ISSN 2229-5518
ORIENTATION(0-45),5 LAYERS FOR MODE 5 1.8 1.6 
1.4 

1.2 

1.0  0.8 0.0 0.5 1.0 1.5 2.0 2.5 l/w ratio | ORIENTATION(0-45),10 LAYERS FOR MODE 1 3.5 d/w=0.2 d/w=0.4 3.0 d/w=0.6 d/w=0.8 2.5 2.0 1.5 1.0 0.5 0.0 0.5 1.0 1.5 2.0 2.5 l/w ratio |
Fig. 27 Frequency ratio vs. l/w ratio for Orientation 0- 45-0 pattern for 10-layers – Mode-2 | Fig. 28 Frequency ratio vs. l/w ratio for Orientation 0- 45-0 pattern for 10-layers – Mode-3 |
ORIENTATION(0-45),10 LAYERS FOR MODE 2 1.8 d/w=0.2 d/w=0.4 1.6 d/w=0.6 d/w=0.8 1.4 1.2 1.0 0.8 0.0 0.5 1.0 1.5 2.0 2.5 l/w ratio | ORIENTATION(0-45),10 LAYERS FOR MODE 3 1.8 d/w=0.2 d/w=0.4 1.6 d/w=0.6 d/w=0.8 1.4 1.2 1.0 0.8 0.0 0.5 1.0 1.5 2.0 2.5 l/w ratio |
Fig. 29 Frequency ratio vs. l/w ratio for Orientation 0- 45-0 pattern for 10-layers – Mode-4 | Fig. 30 Frequency ratio vs. l/w ratio for Orientation 0- 45-0 pattern for 10-layers – Mode-5 |
ORIENTATION(0-45),10 LAYERS FOR MODE 4 1.3 d/w=0.2 d/w=0.4 1.2 d/w=0.6 d/w=0.8 1.1 1.0 0.9 0.8 0.0 0.5 1.0 1.5 2.0 2.5 l/w ratio | ORIENTATION(0-45),10 LAYERS FOR MODE 5 1.8 
1.6 


1.4 
1.2 

1.0  0.8 0.0 0.5 1.0 1.5 2.0 2.5 l/w ratio |
Fig. 31 Frequency ratio vs. l/w ratio for Orientation 0- 45-0 pattern for 15-layers – Mode-1 | Fig. 32 Frequency ratio vs. l/w ratio for Orientation 0- 45-0 pattern for 15-layers – Mode-2 |


IJSER © 2015 http://www.ijser.org
International Journal of Scientific & Engineering Research, Volume 6, Issue 3, March-2015 162


ISSN 2229-5518
ORIENtATION(0-45),15 LAYERS FOR MODE 1 3.5 d/w=0.2 3.0 d/w=0.4 d/w=0.6 d/w=0.8 2.5 2.0 1.5 1.0 0.5 0.0 0.5 1.0 1.5 2.0 2.5 l/w ratio | ORIENTATION(0-45),15 LAYERS FOR MODE 2 1.8 

1.6  1.4 1.2 

1.0   
0.8 0.0 0.5 1.0 1.5 2.0 2.5 l/w ratio |
Fig. 33 Frequency ratio vs. l/w ratio for Orientation 0- 45-0 pattern for 15-layers – Mode-3 | Fig. 34 Frequency ratio vs. l/w ratio for Orientation 0- 45-0 pattern for 15-layers – Mode-4 |
ORIENTATION(0-45),15 LAYERS FOR MODE 3 1.8 


1.6 
1.4 1.2 1.0  0.8 0.0 0.5 1.0 1.5 2.0 2.5 l/w ratio | ORIENTATION(0-45),15 LAYERS FOR MODE 4 1.4 

1.3 
1.2 
1.1 
1.0 0.9  0.8 0.0 0.5 1.0 1.5 2.0 2.5 l/w ratio |
Fig. 35 Frequency ratio vs. l/w ratio for Orientation 0- 45-0 pattern for 15-layers – Mode-5 | Fig. 36 Frequency ratio vs. l/w ratio for Orientation 0- 45-0 pattern for 20-layers – Mode-1 |
ORIENTATION(0-45),15 LAYERS FOR MODE 5 4.5 d/w=0.2 4.0 d/w=0.4 d/w=0.6 3.5 d/w=0.8 3.0 2.5 2.0 1.5 1.0 0.5 0.0 0.5 1.0 1.5 2.0 2.5 l/w ratio | ORIENTATION(0-45),20 LAYERS FOR MODE 1 3.5 d/w=0.2 3.0 d/w=0.4 d/w=0.6 d/w=0.8 2.5 2.0 1.5 1.0 0.5 0.0 0.5 1.0 1.5 2.0 2.5 l/w ratio |
Fig. 37 Frequency ratio vs. l/w ratio for Orientation 0- 45-0 pattern for 20-layers – Mode-2 | Fig. 38 Frequency ratio vs. l/w ratio for Orientation 0- 45-0 pattern for 20-layers – Mode-3 |
IJSER © 2015 http://www.ijser.org
International Journal of Scientific & Engineering Research, Volume 6, Issue 3, March-2015 163
ISSN 2229-5518
ORIENTATION(0-45),20 LAYERS FOR MODE 2 1.8 d/w=0.2 d/w=0.4 1.6 d/w=0.6 d/w=0.8 1.4 1.2 1.0 0.8 0.0 0.5 1.0 1.5 2.0 2.5 l/w ratio | ORIENTATION(0-45),20 LAYERS FOR MODE 3 1.8 d/w=0.2 d/w=0.4 1.6 d/w=0.6 d/w=0.8 1.4 1.2 1.0 0.8 0.0 0.5 1.0 1.5 2.0 2.5 l/w ratio |
Fig. 39 Frequency ratio vs. l/w ratio for Orientation 0- 45-0 pattern for 20-layers – Mode-4 | Fig. 40 Frequency ratio vs. l/w ratio for Orientation 0- 45-0 pattern for 20-layers – Mode-5 |
ORIENTATION(0-45),20 LAYERS FOR MODE 4 1.3 d/w=0.2 d/w=0.4 1.2 d/w=0.6 d/w=0.8 1.1 1.0 0.9 0.8 0.0 0.5 1.0 1.5 2.0 2.5 l/w ratio | ORIENTATION(0-45),20 LAYERS FOR MODE 5 1.8 1.6 1.4 d/w=0.2 d/w=0.4 d/w=0.6 d/w=0.8 1.2 1.0 0.8 0.6 0.0 0.5 1.0 1.5 2.0 2.5 l/w ratio |
Fig. 41 Frequency ratio vs. l/w ratio for Orientation 0- 60-0 pattern for 5-layers – Mode-1 | Fig. 42 Frequency ratio vs. l/w ratio for Orientation 0- 60-0 pattern for 5-layers – Mode-2 |
ORIENTATION(0-60),5 LAYERS FOR MODE1 3.5 d/w=0.2 d/w=0.4 3.0 d/w=0.6 d/w=0.8 2.5 2.0 1.5 1.0 0.5 0.0 0.5 1.0 1.5 2.0 2.5 l/w ratio | ORIENTATION(0-60),5 LAYARS FOR MODE 2 1.8 d/w=0.2 d/w=0.4 1.6 d/w=0.6 d/w=08 1.4 1.2 1.0 0.8 0.0 0.5 1.0 1.5 2.0 2.5 l/w ratio |
Fig. 43 Frequency ratio vs. l/w ratio for Orientation 0- 60-0 pattern for 5-layers – Mode-3 | Fig. 44 Frequency ratio vs. l/w ratio for Orientation 0- 60-0 pattern for 5-layers – Mode-4 |
IJSER © 2015 http://www.ijser.org
International Journal of Scientific & Engineering Research, Volume 6, Issue 3, March-2015 164


ISSN 2229-5518
ORIENT AT ION(0-60),5 LAYERS FOR M ODE 3 1.8 

1.6  
1.4 
1.2 
1.0 0.8 0.0 0.5 1.0 1.5 2.0 2.5 l/w ratio | ORIENTATION(0-60).5 LAYERS FOR MODE4 1.4 d/w=0.2 1.3 d/w=0.4 d/w=0.6 1.2 d/w=0.8 1.1 1.0 0.9 0.8 0.7 0.6 0.0 0.5 1.0 1.5 2.0 2.5 l/w ratio |
Fig. 45 Frequency ratio vs. l/w ratio for Orientation 0- 60-0 pattern for 5-layers – Mode-5 | Fig. 46 Frequency ratio vs. l/w ratio for Orientation 0- 60-0 pattern for 10-layers – Mode-1 |
ORIENTATION(0-60),5LAYERS FOR MODE 5 1.8 d/w=0.2 d/w=0.4 1.6 d/w=0.6 d/w=0.8 1.4 1.2 1.0 0.8 0.0 0.5 1.0 1.5 2.0 2.5 l/w ratio | ORIENTATION(0-60),10 LAYERS FOR MODE 1 4.0 d/w=0.2 3.5 d/w=0.4 d/w=0.6 d/w=0.8 3.0 2.5 2.0 1.5 1.0 0.5 0.0 0.5 1.0 1.5 2.0 2.5 l/w ratio |
Fig. 47 Frequency ratio vs. l/w ratio for Orientation 0- 60-0 pattern for 10-layers – Mode-2 | Fig. 48 Frequency ratio vs. l/w ratio for Orientation 0- 60-0 pattern for 10-layers – Mode-3 |
ORIENTATION(0-60),10 LAYERS FOR MODE 2 2.0 d/w=0.2 1.8 d/w=0.4 d/w=0.6 d/w=0.8 1.6 1.4 1.2 1.0 0.8 0.0 0.5 1.0 1.5 2.0 2.5 l/w ratio | ORIENTATION(0-60),10LAYERS FOR MODE 3 2.0 d/w=0.2 1.8 d/w=0.4 d/w=0.6 d/w=0.8 1.6 1.4 1.2 1.0 0.8 0.0 0.5 1.0 1.5 2.0 2.5 L/W RATIO |
Fig. 49 Frequency ratio vs. l/w ratio for Orientation 0- 60-0 pattern for 10-layers – Mode-4 | Fig. 50 Frequency ratio vs. l/w ratio for Orientation 0- 60-0 pattern for 10-layers – Mode-5 |
IJSER © 2015 http://www.ijser.org
International Journal of Scientific & Engineering Research, Volume 6, Issue 3, March-2015 165


ISSN 2229-5518
ORIENTATION(0-60),10 LAYERS FOR MODE 4 1.4 

1.3  1.2 
1.1 

1.0 0.9 0.8 0.0 0.5 1.0 1.5 2.0 2.5 l/w ratio | ORIENTATION(0-60),10 LAYERS FOR MODE 5 1.8 1.6 1.4 d/w=0.2 d/w=0.4 d/w=0.6 d/w=0.8 1.2 1.0 0.8 0.0 0.5 1.0 1.5 2.0 2.5 l/w ratio |
Fig. 51 Frequency ratio vs. l/w ratio for Orientation 0- 60-0 pattern for 15-layers – Mode-1 | Fig.52 Frequency ratio vs. l/w ratio for Orientation 0- 60-0 pattern for 15-layers – Mode-2 |
ORIENTATION(0-60),15 LAYERS FOR MODE 1 3.5 d/w=0.2 d/w=0.4 3.0 d/w=0.6 d/w=0.8 2.5 2.0 1.5 1.0 0.5 0.0 0.5 1.0 1.5 2.0 2.5 l/w ratio | ORIENTATION(0-60),15 LAYERS FOR MODE 2 1.10 
1.05  1.00 0.95 0.90 
0.85 0.0 0.5 1.0 1.5 2.0 2.5 l/w ratio |
Fig. 53 Frequency ratio vs. l/w ratio for Orientation 0- 60-0 pattern for 15-layers – Mode-3 | Fig. 54 Frequency ratio vs. l/w ratio for Orientation 0- 60-0 pattern for 15-layers – Mode-4 |
ORIENTATION(0-60).15 LAYERS FOR MODE 3 1.8 d/w=0.2 d/w=0.4 1.6 d/w=0.6 d/w=0.8 1.4 1.2 1.0 0.8 0.0 0.5 1.0 1.5 2.0 2.5 l/w ratio | ORIENTATION(0-60),15 LAYERS FOR MODE 4 1.4 d/w=0.2 d/w=0.4 1.3 d/w=0.6 d/w=0.8 1.2 1.1 1.0 0.9 0.8 0.0 0.5 1.0 1.5 2.0 2.5 l/w ratio |
Fig. 55 Frequency ratio vs. l/w ratio for Orientation 0- 60-0 pattern for 15-layers – Mode-5 | Fig. 56 Frequency ratio vs. l/w ratio for Orientation 0- 60-0 pattern for 20-layers – Mode-1 |
IJSER © 2015 http://www.ijser.org
International Journal of Scientific & Engineering Research, Volume 6, Issue 3, March-2015 166

ISSN 2229-5518
ORIENTATION(0-60),15 LAYERS FOR MODE 5 1.8 1.6 1.4 d/w=0.2 d/w=0.4 d/w=0.6 d/w=0.8 1.2 1.0 0.8 0.6 0.0 0.5 1.0 1.5 2.0 2.5 l/w ratio | ORIENT AT ION(0-60),20 LAYERS FOR M ODE 1 3.5 d/w=0.2 3.0 d/w=0.4 d/w=0.6 d/w=0.8 2.5 2.0 1.5 1.0 0.5 0.0 0.5 1.0 1.5 2.0 2.5 l/w ratio |
Fig. 57 Frequency ratio vs. l/w ratio for Orientation 0- 60-0 pattern for 20-layers – Mode-2 | Fig. 58 Frequency ratio vs. l/w ratio for Orientation 0- 60-0 pattern for 20-layers – Mode-3 |
ORIENTATION(0-60),20 LAYERS FOR MODE 2 1.8 d/w=0.2 d/w=0.4 1.6 d/w=0.6 d/w=0.8 1.4 1.2 1.0 0.8 0.0 0.5 1.0 1.5 2.0 2.5 l/w ratio | ORIENTATION(0-60).20 LAYERS FOR MODE 3 1.8 d/w=0.2 d/w=0.4 1.6 d/w=0.6 d/w=0.8 1.4 1.2 1.0 0.8 0.0 0.5 1.0 1.5 2.0 2.5 l/w ratio |
Fig. 59 Frequency ratio vs. l/w ratio for Orientation 0- 60-0 pattern for 20-layers – Mode-4 | Fig. 60 Frequency ratio vs. l/w ratio for Orientation 0- 60-0 pattern for 20-layers – Mode-5 |
ORIENTATION(0-60),20 LAYERS FOR MODE 4 1.3 


1.2  
1.1  

1.0  0.9  0.8 0.0 0.5 1.0 1.5 2.0 2.5 l/w ratio | ORIENTATION(0-60),20 LAYERS FOR MODE 5 1.8 1.6 d/w=0.2 d/w=0.4 d/w=0.6 d/w=0.8 1.4 1.2 1.0 0.8 0.0 0.5 1.0 1.5 2.0 2.5 l/w ratio |
Fig. 61 Frequency ratio vs. l/w ratio for Orientation 0- 90-0 pattern for 5-layers – Mode-1 | Fig. 62 Frequency ratio vs. l/w ratio for Orientation 0- 90-0 pattern for 5-layers – Mode-2 |


IJSER © 2015 http://www.ijser.org
International Journal of Scientific & Engineering Research, Volume 6, Issue 3, March-2015 167
ISSN 2229-5518
ORIENTATION (0-90) 5 LAYERS FOR MODE 1 3.5 d/w=0.2 d/w=0.4 3.0 d/w=0.6 d/w=0.8 2.5 2.0 1.5 1.0 0.5 0.5 1.0 1.5 2.0 2.5 l/w ratio | ORIENTATION (0-90), 5-LAYERS FOR MODE2 1.8 d/w=0.2 d/w=0.4 1.6 d/w=0.6 d/w=0.8 1.4 1.2 1.0 0.8 0.0 0.5 1.0 1.5 2.0 2.5 3.0 l/w ratio |
Fig. 63 Frequency ratio vs. l/w ratio for Orientation 0- 90-0 pattern for 5-layers – Mode-3 | Fig. 64 Frequency ratio vs. l/w ratio for Orientation 0- 90-0 pattern for 5-layers – Mode-4 |
ORIENTATION (0-90),5-LAYERS FOR MODE 3 1.8 d/w=0.2 d/w=0.4 d/w=0.6 1.6 d/w=0.8 1.4 1.2 1.0 0.8 0.0 0.5 1.0 1.5 2.0 2.5 3.0 l/w ratio | ORIENTATION(0-90),5-LAYERS FOR MODE4 1.4 d/w=0.2 d/w=0.4 1.3 d/w=0.6 1.2 1.1 1.0 0.9 0.8 0.0 0.5 1.0 1.5 2.0 2.5 l/w ratio |
Fig. 65 Frequency ratio vs. l/w ratio for Orientation 0- 90-0 pattern for 5-layers – Mode-5 | Fig. 66 Frequency ratio vs. l/w ratio for Orientation 0- 90-0 pattern for 10-layers – Mode-1 |
ORIENTATION(0-90),5 LAYERS FOR MODE5 1.8 1.6 d/w=0.2 1.4 d/w=0.4 d/w=0.6 d/w=0.8 1.2 1.0 0.8 0.6 0.0 0.5 1.0 1.5 2.0 2.5 l/w ratio | ORIENTATION(0-90),10 LAYERS FOR MODE 1 3.5 d/w=0.2 d/w=0.4 3.0 d/w=0.6 d/w=0.8 2.5 2.0 1.5 1.0 0.5 0.0 0.5 1.0 1.5 2.0 2.5 l/w ratio |
Fig. 67 Frequency ratio vs. l/w ratio for Orientation 0- 90-0 pattern for 10-layers – Mode-2 | Fig. 68 Frequency ratio vs. l/w ratio for Orientation 0- 90-0 pattern for 10-layers – Mode-3 |
IJSER © 2015 http://www.ijser.org
International Journal of Scientific & Engineering Research, Volume 6, Issue 3, March-2015 168


ISSN 2229-5518
ORIENTATION(0-90),10 LAYERS FOR MODE2 1.8 d/w=0.2 d/w=0.4 1.6 d/w=0.6 d/w=0.8 1.4 1.2 1.0 0.8 0.0 0.5 1.0 1.5 2.0 2.5 l/w ratio | ORIENTATION(0-90),10 LAYERS FOR MODE 3 1.8 

1.6  
1.4 1.2 
1.0  0.8 0.0 0.5 1.0 1.5 2.0 2.5 l/w ratio |
Fig. 69 Frequency ratio vs. l/w ratio for Orientation 0- 90-0 pattern for 10-layers – Mode-4 | Fig. 70 Frequency ratio vs. l/w ratio for Orientation 0- 90-0 pattern for 10-layers – Mode-5 |
ORIENTATION(0-90),10 LAYERS FOR MODE 4 1.4 d/w=0.2 d/w=04 1.3 d/w=0.6 d/w=0.8 1.2 1.1 1.0 0.9 0.0 0.5 1.0 1.5 2.0 2.5 l/w ratio | ORIENTATION(0-90),10 LAYERS FOR MODE 5 1.8 d/w=0.2 d/w=0.4 1.6 d/w=0.6 d/w=0.8 1.4 1.2 1.0 0.8 0.0 0.5 1.0 1.5 2.0 2.5 l/w ratio |
Fig. 71 Frequency ratio vs. l/w ratio for Orientation 0- 90-0 pattern for 15-layers – Mode-1 | Fig. 72 Frequency ratio vs. l/w ratio for Orientation 0- 90-0 pattern for 15-layers – Mode-2 |
ORIENTATION(0-90),15 LAYERS FOR MODE 1 3.5 d/w=0.2 3.0 d/w=0.4 d/w=0.6 d/w=0.8 2.5 2.0 1.5 1.0 0.5 0.0 0.5 1.0 1.5 2.0 2.5 l/w ratio | ORIENTATION(0-90),15LAYERS FOR MODE 2 1.8 d/w=0.2 d/w=0.4 1.6 d/w=0.6 d/w=0.8 1.4 1.2 1.0 0.8 0.0 0.5 1.0 1.5 2.0 2.5 l/w ratio |
Fig. 73 Frequency ratio vs. l/w ratio for Orientation 0- 90-0 pattern for 15-layers – Mode-3 | Fig. 74 Frequency ratio vs. l/w ratio for Orientation 0- 90-0 pattern for 15-layers – Mode-4 |
IJSER © 2015 http://www.ijser.org
International Journal of Scientific & Engineering Research, Volume 6, Issue 3, March-2015 169


ISSN 2229-5518
ORIENTATION(0-90),15-LAYERS FOR MODE 3 2.0 

1.8 
1.6 
1.4 
1.2 1.0  0.8 0.0 0.5 1.0 1.5 2.0 2.5 l/w ratio | ORIENTATION(0-90),15LAYERS FOR MODE 4 1.4 d/w=0.2 d/w=0.4 1.3 d/w=0.6 d/w=0.8 1.2 1.1 1.0 0.9 0.8 0.0 0.5 1.0 1.5 2.0 2.5 l/w ratio |
Fig. 75 Frequency ratio vs. l/w ratio for Orientation 0- 90-0 pattern for 15-layers – Mode-5 | Fig. 76 Frequency ratio vs. l/w ratio for Orientation 0- 90-0 pattern for 20-layers – Mode-1 |
ORIENTATION(0-90),15 LAYERS FOR MODE 5 1.8 1.6 d/w=0.2 d/w=0.4 1.4 d/w=0.6 d/w=0.8 1.2 1.0 0.8 0.0 0.5 1.0 1.5 2.0 2.5 l/w ratio | ORIENTATION(0-90),20 LAYERS FOR MODE1 3.5 d/w=0.2 d/w=0.4 d/w=0.6 d/w=0.8 2.5 2.0 1.5 1.0 0.5 0.0 0.5 1.0 1.5 2.0 2.5 l/w ratio |
Fig. 77 Frequency ratio vs. l/w ratio for Orientation 0- 90-0 pattern for 20-layers – Mode-2 | Fig. 78 Frequency ratio vs. l/w ratio for Orientation 0- 90-0 pattern for 20-layers – Mode-3 |
ORIENTATION(0-90),20 LAYERS FOR MODE 2 2.0 1.8 d/w=0.2 1.6 d/w=0.4 d/w=0.6 d/w=0.8 1.4 1.2 1.0 0.8 0.0 0.5 1.0 1.5 2.0 2.5 l/w ratio | 0RIENTATION(0-90), 20-LAYERS FOR MODE 3 1.8 1.6 1.4 1.2 1.0 d/w=0.2 0.8 d/w=0.4 d/w=0.6 d/w=0.8 0.6 0.0 0.5 1.0 1.5 2.0 2.5 l/w ratio |
Fig. 79 Frequency ratio vs. l/w ratio for Orientation 0- 90-0 pattern for 20-layers – Mode-4 | Fig. 80 Frequency ratio vs. l/w ratio for Orientation 0- 90-0 pattern for 20-layers – Mode-5 |

IJSER © 2015 http://www.ijser.org
International Journal of Scientific & Engineering Research, Volume 6, Issue 3, March-2015 170
ISSN 2229-5518
1.8
ORIENTATION(0-90),20 LAYERS FOR MODE 4
2.0
ORIENTATION(0-90),20 LAYERS FOR MODE 5
1.6
1.4
d/w=0.2 d/w=0.4 d/w=0.6 d/w=0.8
1.8
1.6
d/w=0.2 d/w=0.4 d/w=0.6 d/w=0.8
1.2
1.4
1.2
1.0
1.0
0.8
0.0 0.5 1.0 1.5 2.0 2.5
l/w ratio
0.8
0.0 0.5 1.0 1.5 2.0 2.5
l/w ratio
• B.V.S.RAGHU VAMSI is currently working as Assistant Professor, Dept. of Mechanical Engg., Gudlavalleru Engineering College, India, PH-+919492508145, E-mail: bvsraghuvamsi@hotmail.com
• K.SASI KUMAR is currently pursuing masters degree program in Machine Design in Sir CR Reddy College of Engineering, India, PH-+919492938978. E-mail:
kolaventi.sasikumar@gmail.com
• P.N.V.BALA SUBRAHMANYAM is currently working as Assistant Professor, Dept. of Mechanical Engg., Gudlavalleru Engineering College, India, PH-+919885599644, E-mail: bala.mech1513@gmail.com
• E. VENKATESWARA RAO is currently working as Assistant Professor in Dept. of Mechanical Engg.. in Sir CR Reddy College of Engineering, India , PH:
+919441151496 E-mail: e_venkat15@yahoomail.com
IJSER © 2015 http://www.ijser.org