International Journal of Scientific & Engineering Research Volume 2, Issue 7, July-2011 1
ISSN 2229-5518
Fractal and Chaos Properties of Explosion Earthquakes Followed by Harmonic Tremor at Semeru Volcano, East Java, Indonesia
Sukir Maryanto, Didik R. Santosa, Iyan Mulyana, Muhamad Hendrasto
Abstract— Fractal and chaos analyses of successive event of explosion earthquake and harmonic tremor recorded at Semeru volcano were applied to investigate the dynamical system regarding to their eruptive mechanism. The eruptive activity at Semeru volcano East Java, Indonesia is intermittent emission of ash and bombs with Strombolian style which occurred at interval of 15 to 45 minutes. The explosive eruptions accompanied by explosion earthquakes and followed by harmonic tremor which generated by continuous emission of volcanic ash. Spectral, fractal and Lyapunov exponent of successive event of explosion and harmonic tremor were analyzed. Peak frequencies of explosion earthquakes range 1.2 to 1.9 Hz and those of the harmonic tremor have peak frequency range 1.5 – 2.2 Hz. Temporal change of fractal dimension shows a higher fractal dimension of explosion earthquakes and gradually decrease during the occurrence of harmonic tremors. The phase space is reconstructed and evaluated based on the Lyapunov exponents. Harmonic tremors have smaller Lyapunov exponent than explosion earthquakes. It can be considerably as correlated complexity of the mechanism from the variance of spectral and fractal dimension and can be concluded that the successive event of harmonic tremor and explosions are chaotic.
Index Terms— Semeru volcano, explosion earthquakes, harmonic tremor, spectral, fractal dimension, lyapunov exponent.
—————————— • ——————————
EMERU volcano is an andesitic stratovolcano located in East Java (Fig. 1). The peak’s summit rises 3676 m above sea level and it is the highest, active volcano on
the island of Java. Frequent explosions at the summit cra- ter of Jonggring Seloko have been occurring continuously since 1941.[1],[2] During this period, small to moderate strombolian and vulcanian type explosions have oc- curred, producing explosion plumes rising 400–1000 m above the summit. During active periods, lava flow, lava dome extrusion and pyroclastic flows have also been ob- served. In 2005 the frequency of the explosions averaged
3453 times per month and 115 per day, respectively.[3],[4] In previous study, Maryanto et al., 2005, classified harmonic tremor at Sakurajima volcano into 2 groups: Harmonic Tremors occurred after B-type earthquake swarms (HTB) and Harmonic Tremor which occurred immediately after Eruption (HTE). There is no study fo- cus on harmonic tremor after an eruption at Semeru vol- cano previously. We have analyzed Harmonic Tremors after an Eruption (HTE) that occurred at Semeru volcano on March 2005. HTEs that occurred at Sakurajima volcano were characterized to understand more detail volcanic activity as supporting information for prediction of vol-
canic eruption.[5]
Most of the previous study mentioned above are
mainly based on the characteristics of spectra which
mostly triggered by linear process, however little intent
has been given on nonlinear process. In contrary, theoret-
ically volcanic tremors can be generated by some kind of
nonlinear processes.[6] Methods based on the discipline
of nonlinear dynamics have been rarely applied to the
volcanic tremor and explosion earthquake recorded at some volcanoes. The first investigation of fractal proper- ties of volcanic signals have been conducted for volcanic tremor for the tremor and gas piston events recorded at Kilauea volcano, Hawaii.[7] The results revealed a fractal dimension of the tremor attractor in the range of 3.1-4.1 with the average value of 3.75. This was interpreted that the source of tremor is not controlled by a stochastic process (where fractal dimension should be infinite), therefore it can be described by only a few degrees of freedom. Some studies of tremor and low-frequency events reported similar estimates of the fractal dimen- sions confirming the low-dimensional nature of the phe- nomena.[6],[7],[8],[9],[10] Furthermore, the time interval between two successive explosions can be considered as a dynamical variable.
In the present paper, another approach of fractal and chaos analyses of the explosion earthquakes followed by harmonic tremor has been applied. We applied the me- thod to successive event of explosion earthquakes and harmonic tremors recorded at Semeru volcano, East Java, Indonesia. First, we briefly describe the data obtained from Center for Volcanology and Geological Hazard Mi- tigation, Indonesia. We then present a method to estimate the fractal dimension and Lyapunov exponent of the ex- plosion earthquakes and harmonic tremor. We follow with an application of the method to our data and termi- nate with a discussion of the implications of these results for driving mechanism of the events.
IJSER © 2011 http://www.ijser.org
International Journal of Scientific & Engineering Research Volume 2, Issue 7, July-2011 2
ISSN 2229-5518
Semeru volcano has been monitored continuously by
CVGHM using 5 seismometers at stations PCK, KPL,
TABLE 1
![]()
EXPLOSION EARTHQUAKE FOLLOW ED BY HARMONIC TREMOR EVENTS.
TRS, LEK and BES, distributed 0.76-8.9 km apart from the active crater. Seismic sensor installed at the summit and northwest-south slope (Fig. 1). The 5 stations are![]()
Time of eruption Estimated time interval between eruption and harmonic tremor (min)
Estimated du- ration (min)
equipped with short-period (1 Hz) vertical seismometer. The temporary stations (PCK, KPL, and TRS) installed during September – December 2005. The signals from seismometers transmitted to the Sawur Volcano Observa- tory by FM radio telemetry. The recorded seismic signals transmitted to the G. Sawur Volcano Observatory by FM radio telemetry. [11]
The seismic signals are recorded by analog drum re- corders; Kinemetrics PS-2 and digitally sampled 100 Hz by data loggers (Datamark LS-7000) with GPS time cali- bration. Characteristic signals such as volcanic earth- quakes, tectonic earthquakes, and eruption earthquakes also harmonic tremor are recognized on the seismograms. The selected successive events of explosion earthquakes and harmonic tremor are represented in Table I. The harmonic tremor occurred about 2-3 minutes after explo- sion.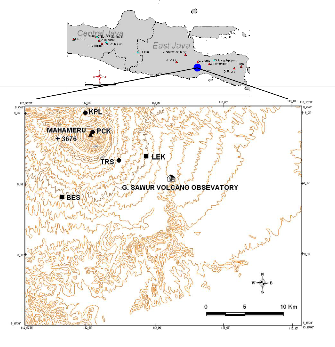
-6o 15” S
S E M E R U
![]()
2005:03:12 23:36 2 6
![]()
2005:03:13 00:39 2 10
![]()
2005:03:14 05:34 3 21
![]()
2005:03:15 00:05 3 23
![]()
2008:01:18 03:40 2 15
![]()
2008:01:18 04:24 2 6
![]()
2008:01:18 04:34 2 11
![]()
2008:01:18 05:22 2 6
![]()
2008:01:24 15:03 2 6
![]()
2008:09:28 03:53 3 12
![]()
2008:09:29 04:35 2 7
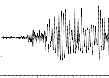
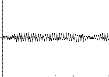
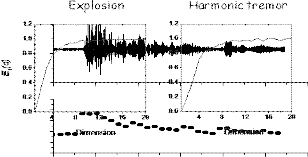
A typical of seismogram HTE recorded at Semeru volcano shown in Fig. 2. The explosive eruption occurred on 00h05m42.93s on March 15, 2005 and waveform be- came harmonic tremor at 00h09m49.73s, three minutes after the beginning of the eruption. The harmonic tremor continued for 23 minutes.
The duration and time interval of harmonic tremors after the beginning explosion earthquake on March, 2005 can be detected at the range of 30s - 1020s.
In order to investigate the frequency contents of harmonic
TABLE 1
EXPLOSION EARTHQUAKE FOLLOW ED BY HARMONIC TREMOR EVENTS.

75000
0
-75000
75000
0
0 100 200 300 400 500 600 700 800 900 1000 1100 1200
Time (second)
75000
0
-75000
60 70 80 90
-75000
320 330 340 350
Fig. 1. Map of Semeru volcano and locations of seismic stations at this volcano operated by Center of Volcanology and Geological Hazard Mitigation. Triangle, circles and squares represent summit crater, temporary and permanent stations, respectively. In this study, we used permanent stations (BES and LEK).
Time (second) Time (second)
Fig. 2. Vertical component seismogram of small eruption followed by harmonic tremor (upper part). Left bottom shown a typical of the explosion earthquake and right bottom is harmonic tremor.
tremor, the spectra of harmonic tremors at Semeru volca- no were examined. Fast Fourier Transform (FFT) algo- rithm was applied to digitized seismograms. The time windows used for FFT analysis were 10.24 second long starting from the onset of explosion earthquakes. The time localization can be obtained by windowing the data at different times with sliding window functions. The
IJSER © 2011 http://www.ijser.org
International Journal of Scientific & Engineering Research Volume 2, Issue 7, July-2011 3
ISSN 2229-5518
75000
0
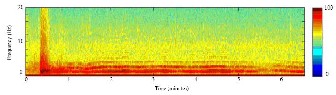
Fig. 3. Spectrogram of vertical component of HTE recorded at sta- tion LEK March 13, 2005 which calculated using time windows
10.24 s overlap 50%.
Fourier transform of this procedure applied on a signal is called short-time Fourier transform (STFT), or spectro-
-75000
2.6
2.4
2.2
2.0
1.8
1.6
0 60 120 180 240 300 360
0 60 120 180 240 300 360
gram.
Figure 3 represent a spectrogram of HTE recorded at
station LEK which occurred on March 13, 2005. Broader
frequency bands at the beginning of the spectrogram are caused by explosion earthquakes. A few minutes later, sharp peaks are recognized and their frequencies spaced regularly.
To grasp temporal changes of peak frequencies more clearly, we calculated the running spectra of HTE without overlap of time windows, by shifting the time windows of
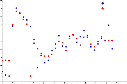
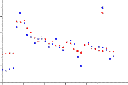
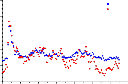
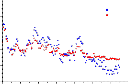
10.24 s. Temporal changes of dominant frequency of har- monic tremor at BES and LEK station are shown in Fig. 4.
Waveforms with duration 240 seconds are divided in- to 24 time windows. In the 1st time windows, dominant frequency has 2.1 Hz and then 2nd to 12th dominant fre- quency gradually decreased, it is shifted to 1.8 Hz. In 12th to 24th, the frequency increased from 1.8 to 2.3 Hz on BES station. The temporal change at LEK station has similar pattern. 1st to 5th dominant frequency has 2 Hz and then
6th to 14th the frequency gradually decreased it is shifted
to 1.8 Hz. In 14th to 23rd the frequency become increased
from 1.8 to 2.3 Hz. Frequency of second mode also
changes similarly.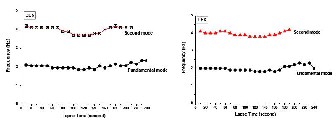
Fig. 4. Temporal change of peak frequency of harmonic tremor recorded at LEK and BES station on March 14, 2005.[11]
The volcanic seismic signal contains the fluctuations con- cerned with frequency, amplitude, self-affine property, chaotic behavior, etc. Therefore, if we divide the whole time-sequential data into several short time intervals and
measure the degrees of freedom of the fluctuations inside
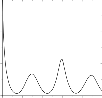
Fig. 7. Example of calculated MinimuTmimee(smecb)edding dimension for
![]()
Explosion and hwainrdmow o1 nic tremor at station LEK calculated using
Cao’s method.
![]()
window 2
![]()
window m
�t
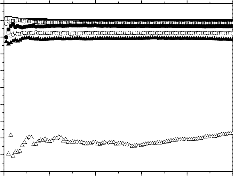
Fig. 5. Typical of successive event of explosion earthquakes and harmonic tremor and its temporal change of fractal dimension. The fractal dimension was estimated based on CEM with TDFD.
evaluate the fraction dimensions and called the time- dependent fractal dimension (TDFD).[11]
In practice, we divided the seismogram data into short time intervals by a windowing with a window function. We then evaluate the fractal dimensions of the points in- side this windowing. Next, we move this window by n points (�t) and again evaluate the fractal dimension of moved window. By repeating this process throughout the whole data, we can observe the change in the fractal di- mension with respect to time. In the case of TDFD, the horizontal axis is the window index and vertical axis is the fractal dimension value. Fig. 5 shows typical succes- sive events of explosion earthquakes and harmonic tre- mor occurred on March 15, 2005 and its temporal change of fractal dimension determined by CEM with TDFD.
One of the easiest ways in obtaining the Lyapunov expo- nent can be done by observing the separation of two close initial trajectories on the attractor and taking the loga- rithm of the separation. This method cannot be applied to the observation data that have no dealing with two or more sets data closed to initial conditions. In this case, we have to reconstruct the phase space from the time series data.[12]
Reconstructing the phase space from the time series with appropriate time delay and embedding dimension makes it possible to obtain an attractor whose Lyapunov spectrum is identical to that of the original attractor. Ma- thematically, a reconstructed phase space can be de- scribed as follows
these time-intervals, we can observe the change in the degree of fluctuations with respect to time. These fluctua-
y(k ) = S (k ),
S (k + r ),
S (k + 2r )... , S (k + (m - 1)r )
(1)
tions are effectively characterized by the fractal dimen- sions. In this paper, we will approach the CEM in order to
Where S(k) is the time series from single observation, 1"
represents appropriate delay time and for a digitized
IJSER © 2011 http://www.ijser.org
International Journal of Scientific & Engineering Research Volume 2, Issue 7, July-2011 4
ISSN 2229-5518
time-series is a multiple of the sampling interval used. The dimension m of the reconstructed space is considered as the sufficient dimension for recovering the object with- out distorting any of its topological properties, thus it may be different from the true dimension of the space where this object lies. This procedure of phase space re- construction is termed embedding and the formulation of Takens is called the delay embedding theorem, with m being the embedding dimension. In practical applications both the delay time and the embedding dimension have to be determined from the time-series itself.
In a phase space reconstruction procedure, we must
cover the appropriate number of coordinates m of the phase space. The idea of a number of coordinates m is a dimension in which the geometrical structure of the phase space is completely unfolded.[14]
The basic method in determining the embedding di- mension in phase-space reconstruction is the False Near- est Neighbor method.[15],[17] Suppose the vector yNN is a false neighbor of y, having arrived in its neighborhood by projection from a higher dimension, because the present dimension m does not unfold the attractor, then by going to the next dimension m+1, we may move this false neighbor out of the neighborhood of y. Thus, if the addi- tional distance is large compared to the distance in di- mension d between nearest neighbors, we have a false neighbor. Otherwise, we have a true neighbor. In order to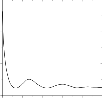
3
2
1
0
0 20 40 60 80 100
3
2
1
0
0 20 40 60 80 100
have a straightforward representation of the minimum embedding dimension, Cao [14] defined the mean value of E1, which generally represents the relative Euclidean distance between y NN and y NN in two consecutive dimen- sions. Cao’s number E1 consequently will stop changing when the dimension m is greater than the minimum em- bedding dimension m0.
Figure 7 depicts the Cao number as a function of em-
Time lag (multiple of sampling interval)
Fig. 6. Example of calculated Mutual information of explosion and harmonic tremor at station LEK calculated for delay times 1–100s.
ensure that the points in each dimension (coordinate) are independent of each other. Therefore, time delay r must be chosen so as to result in points that are not corre- lated to previously generated points. One proposed way of choosing the delay time r for phase space reconstruc- tion is by calculating the Mutual Information of the time series data and choosing r as the time of the first local minimum [13]. The Mutual Information of time series xi{t=1, 2, …, M} is defined:
bedding dimension. It can be observed that E1 approaches a constant value for a dimension higher than four. Thus, we can conclude that the minimum dimension that will totally unfold the phase space is 5.
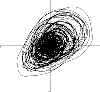
Examples of an attractor of explosion earthquake and harmonic tremor are shown in Figs. 8 and 9, respectively. The attractor obtained from the seismogram of HTE rec- orded at station LEK.
5.1.3. Estimation of Lyapunov exponent
The current method is principally based on the work of
Sano and Sawada.[16] Let us consider a general m-
dimensional discrete time dynamical system.
pxy (i, j )
(3)
MI (X ,Y ) = L
![]()
L pxy (i, j )log
( j )
(2)
i j x y
Where in the first step, a sequence Xi{i=1, 2, …, M} of
length M is considered in the time series Xi. Let the prob-
ability distribution in Xi be px(i) and the probability dis- tribution in the sequence Yi{j=a, a+1, …, a+M} obtained by shifting Xi by a be py(j). By varying the time shift a, let the time delay, for which first takes the local minimum,
be r. Figure 6 shows the mutual information of the HTB.
The first minimum value of the mutual information is
approximately 0.05 sec.
The next step in reconstructing phase space is to re-
 x+0.05s
x
 x+0.15s
x
 x+0.10s
x
 x+0.2
x+0.2
x
Fig. 8. Four projections of explosion earthquake for delay time 0.05 s, 0.10 s, 0.15 and 0.20, respectively.
IJSER © 2011 http://www.ijser.org
International Journal of Scientific & Engineering Research Volume 2, Issue 7, July-2011 5
ISSN 2229-5518
The Jacobian matrix DFN at the N-th mapping is defined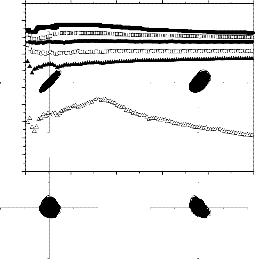
10 as:
5
![]()
-5
1
(7)
-10
-15
x+0.05s
![]()
2
![]()
x+0.10s
Using the eigenvalues oi(N), the Lyapunov spectrum Ai (i
= 1, 2 …m) is derived as followed:[15],[ 17]
-20
![]()
![]()
![]()
4
![]()
![]()
![]()
lim
5
-25
6
i =
N
log cr
N i
(N )
(8)
-30 x
-35
-40
x The Lyapunov exponent, Ai is defined as a divergence rate in bits per unit time (bits/sec) i.e. logarithm of base
two. In the case of experimental time series, the Jacobian
0 1000 2000 3000 4000 5000
time
matrix of Eq. (6) cannot directly be used since the dynam-
x+0.15s
x+0.2
ical system of the object of measurement is unknown. The
Jacobian matrix of Eq. (6) in the tangent space is estimated
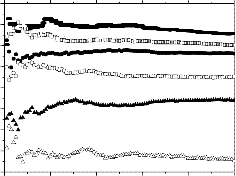
Fig. 12. Lyapunov exponent spectrum of explosion earth- quakes recorded at station LEK (event20050313 00:39).
from the experimental data according to the method by
Sano and Sawada.[16]
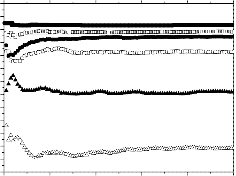
x x Fig. 10 shows the Lyapunov exponent, Ai of explosion earthquakes, part of HTE recorded at station BES. The
largest lyapunov exponent, A1 is positive (A1 ~ 2) for the
Fig. 9. Four projections of harmonic tremor event for delay time
0.05 s, 0.10 s, 0.15 and 0.20, respectively.
where Xi is a state of the system and F : Rm �Rm is a m- dimensional mapping. Considering the infinitesimal small displacement at Xi be 5Xi. Then, there holds:
explosion earthquakes. The harmonic tremor part also has a positive largest lyapunov exponent (A1 ~ 1) as shown in Fig. 11.
Furthermore, to check the spatial change, we also cal- culate lyapunov exponent of HTE recorded at station LEK. Fig.12 shows the largest Lyapunov exponent of explosion
(4)
By forming the Taylor expansion and applying the linear approximation, the following mapping is obtained for the 4 small displacement 5Xi at Xi
0
(5)
where DF(Xi) is thei +1Jacobian mai trix oi f F at point Xi. The
mapping is a time dependent linear mapping. Defining
5X0 as the initial value and executing N time mappings by
DF, there results:
-4
![]()
-6 1
![]()
-8 2
![]()
-10 3
![]()
-12 4
![]()
-14 5
X N
4
2
N -1
)DF(X
N -2
)...DF(X0
) X0
(6)
-16
-18
-20
-22
![]()
6
0 1000 2000 3000 4000 5000
time
0
-2
-4
-6
-8
-10
-12
![]()
1
![]()
2
![]()
3
![]()
4
![]()
5
![]()
6
0 1000 2000 3000 4000 5000
time
Fig. 11. Lyapunov exponent spectrum of harmonic tremor recorded at station BES (event20050313 00:39)..
earthquakes at station LEK. The largest Lyapunov expo- nent, A1 is also positive (A1 ~2.5). At this station, the har- monic tremor part also has positive largest lyapunov ex- ponent (A1 ~ 1.5) as shown in Fig. 13.
Fig. 10. Lyapunov exponent spectrum of explosion earthquakes recorded at station BES (event20050313 00:39).
IJSER © 2011 http://www.ijser.org
International Journal of Scientific & Engineering Research Volume 2, Issue 7, July-2011 6
ISSN 2229-5518
In our study, the temporal change of fractal dimension of successive event between explosion earthquakes and harmonic tremor have been calculated based on CEM with moving windows of 1024 points and 50% over- lap.[11] The temporal pattern shows that fractal dimen- sion gradually decreased from explosion earthquakes to volcanic tremor and fluctuates in a certain range during the occurrence of harmonic tremor. The fractal dimension of explosion earthquakes has higher value than harmonic tremor at all events and can be considerably as correlated complexity of the source mechanism from the variance of fractal dimension.
The spatio-temporal change of fractal dimension of these events shown in Fig. 14.[11] Various studies have suggested that the dominant frequency of tremor is re- lated to the dimension of magma body and coupling be-
Sakurajima increased from 0.9 to 3.7 Hz (Maryanto et al. [19]. This suggests that condition of conduit is more stable and the size is smaller at Semeru. This associated by the change dimension and/or physical boundary conditions of conduit. Furthermore, Maryanto et al.[11],[19]and Ta- meguri et al.[20],[21] suggest the following facts should be considered as constraints for modeling of their genera- tion mechanism; spectrum peaks appear at the frequen- cies of multiple integers of the fundamental frequencies, peak frequencies of harmonic tremor are rather stable, source depths coincide with the gas pocket at uppermost part the conduit.
The chaotic behavior of earthquakes followed by har-
monic tremor identified based on Lyapunov exponent.
The Lyapunov exponents of these events have been esti-
tween magma and gas. Change of spectral structure with
time is associated by the change of dimension and/or
2.6
2.4
BES LEK
2.6
2.4
BES LEK
2.2
2.2
5
0
-5
![]()
-10
1
![]()
-15 2
![]()
![]()
-20 3
4
![]()
-25
5
![]()
-30
6
-35
-40
-45
2.0
1.8
1.6
2.6
2.4
2.2
2.0
1.8
1.6
0 60 120 180 240 300 360
BES LEK
0 60 120 180 240 300 360
Time (s)
2.0
1.8
1.6
2.6
2.4
2.2
2.0
1.8
1.6
0 200 400 600 800 1000 1200 1400
BES LEK
0 200 400 600 800 1000 1200 1400
Time (s)
Fig. 13. Lyapunov exponent spectrum of harmonic tremor record- ed at station LEK (event20050313 00:39).
physical boundary conditions of the origin (Kamo,
1977).[18] The changes dominant frequency harmonic
tremor at Semeru volcano may be existence changes the
conduit size and dimension. It was interpreted as the im-
plication of gas accumulation release that occurred spo-
radically. The source of gas is magma chamber convec-
tion that accumulates gas near the surface and form gas
pocket. This gas pocket is covered by semi-solid lava
plug. After the gas release process, the pocket will be
empty and then refill continuously by another gas that
produced from magma chamber. In addition, the varia-
tion of fractal dimension along the seismogram can be
explained in terms of stationary or non-stationary beha- vior of source. Maryanto and Iyan (2009) suggest that explosion earthquakes show non-stationary behavior in- dicated by higher fractal dimension, � 2.2-2.5, while har- monic tremors present stationary behavior characterized by lower fractal dimension � 1.6-1.9.[11]
Based on the spectral analyses, compared with har- monic tremor after explosion at Sakurajima, the change of frequency is smaller at Semeru. The harmonic tremor at
mated by using the algorithm proposed by Sano and Sa- wada method [16]. We applied the method to both of ex- plosion earthquakes and harmonic tremor parts of HTE recorded at station BES and LEK. The largest Lyapunov exponent, A1 of harmonic tremor are smaller than the ex- plosion earthquakes at both stations. These indicate that explosion earthquakes have more complicated structure of signals or the quantity information embodied in a pat- tern. Because of successive events contain of two different types of volcanic seismic signals, we estimated that the source of these events should be changed from unstable to more stable source as detected by temporal change of fractal dimension and higher Lyapunov exponent of ex- plosion earthquake than harmonic tremor. In this case, when an explosion earthquake occurred a resonance may occur immediately at the upper part of the conduit.
The explosion earthquakes followed by harmonic tre- mors contain of fluctuations concerned with frequency, amplitude, self-affine property, and chaotic behavior, these events may caused by non-linear source processes involving one or several different kinds of magmatic ac- tivity that not only supported by theoretical considera- tions [22], [23], but also by certain characteristics ob-
IJSER © 2011 http://www.ijser.org
International Journal of Scientific & Engineering Research Volume 2, Issue 7, July-2011 7
ISSN 2229-5518
served in volcanic seismic signals.
Though the results of spectra, fractal and chaos ana-
lyses can tell us about change of conduit and/or source of
harmonic tremor, they cannot provide a clue as to what the physical mechanism of this source is. Other methods, that can extract information concerning the physical properties and geometrical configuration of the rock-fluid system from seismic and acoustic data combined with visual observations, are needed in order to accomplish this task. Future volcano monitoring and prediction ef- forts should, therefore, rely on a multidisciplinary ap- proach on experimental, observational and theoretical when trying to study the nature of harmonic tremor sources whether independent or associated with other volcanic earthquakes.
The authors wish to thank Hery Kuswandarto, Suparno, Liswanto of G. Sawur Volcano Observatory at Semeru for their help during the collecting data. This work was sup- ported in part by a Grant-in-Aid for Scientific Research (Hibah Kompetensi) from Directorate General of Higher Education, Ministry of Education, Republic of Indonesia (No. 876.3/H10.21/PG/2010) .
[1] K. Kusumadinata, Catalogue of References on Indonesian Volcanoes with Eruptions in Historical Time, Volcanological Survey of Indo- nesia, pp 304, 1979.
[2] S. Siswowidjoyo, U. Sudarsono, A.D. Wirakusumah, “The
threat of hazards in the Semeru volcano region in East Java, In- donesia,” Journal of Asian Earth Sciences, vol 15; pp. 185-194,
1997.
[3] I Mulyana, “Characteristics of harmonic tremor at Semeru vol- cano, East Java, Indonesia,” JICA Final Report of Volcanology and Comprehensive Sediment-related Disaster Prevention Measures J05-00876, Sept. 2006)
[4] K. Nishi, M. Hendrasto, I. Mulyana, U. Rosadi, M.A. Purbawi-
nata, “Micro-tilt changes prior to the summit explosions at Se- meru volcano, Indonesia” Earth, Planets and Space, vol. 59; pp.
151-159, March 2007.
[5] S. Maryanto, M. Iguchi, and T. Tameguri, “Spatio-Temporal
Characteristics on Spectra and Particle Motion of Harmonic
Tremors at Sakurajima Volcano, Japan,” Ann. Disast. Prev. Res. Inst., Kyoto University, vol. 48B, pp. 329-339, Apr. 2005.
[6] B Chouet and HR Shaw, “Fractal Properties of Tremor and Gas- piston Events Observed at Kilauea Volcano, Hawaii,” Journal of Geophysics Research, vol. 96, no B6, pp. 10177-10189, Jun. 1991.
[7] C Godano, C Cardaci, and E Privitera, “Intermittent Behaviour of Volcanic Tremor at Mt. Etna,” Pure Appl. Geophysics, vol.
147, no. 4, pp. 729–744, Oct. 1996.
[8] C Godano and P Capuano, “Source Characterisation of Low
Frequency Events at Stromboli and Vulcano Islands (Isole Eolie
Italy),” Journal of Seismology, vol. 3, no. 4, pp. 393-408, Oct.
1999.
[9] KI Konstantinou, “Deterministic Nonlinear Source Processes of Volcanic Tremor Signals Accompanying the 1996 Vatnajökull Eruption, Central Iceland,” Geophys. J. Int., vol. 148, no. 3, pp
663-675, March 2002.
[10] KI Konstantinou and Lin CH, “Nonlinear Time Series Analysis
of Volcanic Tremor Events Recorded at Sangay Volcano, Ecua- dor. Pure Appl. Geophysics, vol. 161, no. 1, pp. 145–163, Jan.
2004.
[11] S. Maryanto, I. Mulyana, “Temporal Change of Fractal Dimen-
sion of Explosion Earthquakes and Harmonic Tremors at Seme- ru volcano, East Java, Indonesia, using Critical Exponent Me- thod”, Intl. Journal of Math. Physical and Engineering Sciences, vol. 3, pp. 113-117, May 2009.
[12] S. Maryanto, D.R. Santosa, I. Mulyana, and M. Hendrasto “Pre- liminary Chaos Analyses of Explosion Earthquakes Followed by Harmonic Tremors at Semeru volcano, East Java, Indonesia”, Submitted for Intl. Conference On Geological Sciences and En- gineering, Venice, Italy, 24-26 Nov. 2010.
[13] M. Nakagawa, Chaos and Fractal in Engineering, Singapore: World Scientific, ch. 3, 1999
[14] L. Cao, “Practical method for determining the minimum em-
bedding dimension of scalar time series”, Physica D, vol. 110, pp 43-50, May 1997
[15] M.B. Kennel, R. Brown and H.D.I Abarbanel, “Determining embedding dimension for phase-space reconstruction using a geometrical construction”, Phys. Rev. A, vol. 45, pp. 3403-3411,
1992.
[16] M. Sano and Y. Sawada, “Measurement of the Lyapunov spec-
trum from a chaotic time series”, Phys. Rev. Lett., vol. 55, no.10, pp. 1082-1085, 1985.
[17] N. Ni Soe, M. Nakagawa, “Chaotic Properties of Hemodynamic
response in Functional Near Infrared Spectroscopic Measure- ment of Brain Activity ,” Intl. Journal of Biological and Life Sciences, vol. 4; pp 34-43, 2008
[18] K. Kamo, “ Some phenomena before the summit eruptions at
Sakura-zima volcano”, Bull. Volcanol. Soc. Japan, vol. 23, pp 53-
64 (Japanese with English abstract), 1978
[19] S. Maryanto, M. Iguchi, and T. Tameguri, “Constraints on the
sources mechanism of harmonic tremors based on seismologi- cal, ground deformation, and visual observations at Sakurajima Volcano, Japan,” Journal of Volcanology and Geothermal Re- search, vol. 170, pp. 198-217, 2008
[20] T. Tameguri, S. Maryanto, and M. Iguchi, “Moment tensor
analysis of harmonic tremors at Sakurajima Volcano,” Ann. Disast. Prev. Res. Inst. Kyoto University, vol. 48B, pp. 323-328, Apr. 2005.
[21] T. Tameguri, S. Maryanto, and M. Iguchi, “Source Mechanism of Harmonic Tremor at Sakurajima Volcano,” Bull. Volcanol. Soc. Japan, vol. 52, pp 273-279, 2007.
[22] B. Chouet, “Excitation of a buried magmatic pipe: a seismic
source model for volcanic tremor,” J. Geophys. Res., vol. 90, no.
B2, pp 1881-1893, Feb. 1985.
[23] B.R. Julian, “Volcanic tremor: non-linear excitation by fluid
flow,” J. Geophys. Res., vol. 99, no. B6, pp 11859-11877, Jun.
1994.
S.M. Author Graduated from Physics Department, Brawijaya Uni-
versity in 1995, Master of Science in Geophysics of Gadjah Mada University, Yogyakarta, Indonesia in 2000, and obtained Doctor of Science from Kyoto University, Japan in 2007. Current research interests in Physical Volcanology at Geophysics laboratory, Brawi- jaya University, Malang, East Java, Indonesia.
D.R.S. Author Graduated from Physics Department, Brawijaya Uni- versity in 1992, Master of Science from Physics Department of Gad- jah Mada University, Yogyakarta, Indonesia in 1997, and obtained Doctor of Engineering from Hiroshima University, Japan in 2005.
I.M. Author is a researcher from Center for Volcanology and Geolog- ical Hazard Mitigation (CVGHM), Bandung, West java, Indonesia.
M.H. Author is a researcher from Center for Volcanology and Geo- logical Hazard Mitigation (CVGHM), Bandung, West java, Indonesia.
IJSER © 2011 http://www.ijser.org